@Akash Hello Sir,
Incidents related to Algostra usually require a detailed review along with the strategy name and other relevant information. We kindly request that you please raise this concern from the Algostra page under the Feedback section
@Akash Hello Sir,
Incidents related to Algostra usually require a detailed review along with the strategy name and other relevant information. We kindly request that you please raise this concern from the Algostra page under the Feedback section
We hope your query has been resolved, as a member of our team has already connected with you and assisted
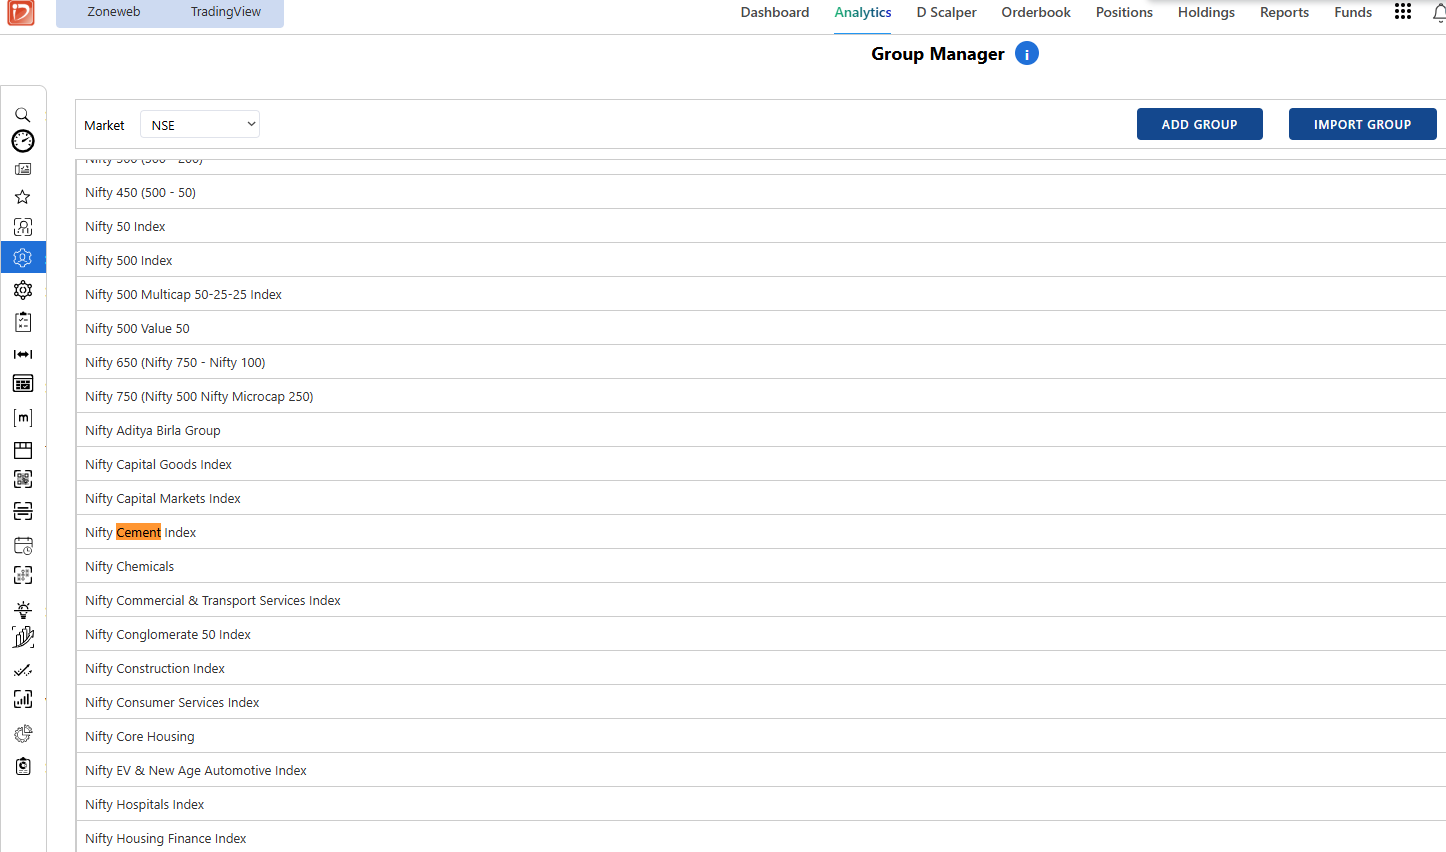
Sir Nifty Cement Index is already present in the Group manager, we keep all the sectors and Indices updated as and when NSE comes up with any new sectoral/thematic index
Could you please let us know which other indices are you not able to see?
@Karan Shah Hello Sir,
We use the annual figures published in the companies' Annual Reports. Since Anant Raj has not released its latest Annual Report yet, the annual numbers currently shown are for FY2025.
@Karan Shah Hello sir, apologies for the intermittent issue, can you pls check now?
@NISHIT GALA Thank you sir for bringing it to our notice, we have rectified this, upcoming emails will take you to the blog
Thank you sir for the feedback, we will enhance the above mentioned points in Radar soon
Hello sir, As per the screenshots, NEULANDAB met the scanner conditions and appeared in the scan results. However, it was not added to the final momentify basket because the available per-stock allocation was insufficient for its price.
You can verify this in the Momentify logs, where it should show a message indicating insufficient amount. Therefore, the stock was identified correctly but was excluded from the basket due to allocation constraints.
To assist you better we kindly request you to share your UCC via DM
You can directly apply Stop Loss in backtesting.