• Recent
  • Categories
  • 0 Unread 0
  • Popular
  • Tags
  • More
    • Guidelines
    • Disclaimer
  • Users
Skins
  • Light
  • Default
  • Cerulean
  • Cosmo
  • Flatly
  • Journal
  • Litera
  • Lumen
  • Lux
  • Materia
  • Minty
  • Morph
  • Pulse
  • Quartz
  • Sandstone
  • Simplex
  • Sketchy
  • Spacelab
  • United
  • Yeti
  • Zephyr
  • Dark
  • Cyborg
  • Darkly
  • Slate
  • Solar
  • Superhero
  • Vapor
Collapse
Definedge Forum Logo

Can Private Banks End the Four-Year Drought?

Scheduled Pinned Locked Moved Charts
bank niftyhdfcbanksbin
4 Posts 2 Posters 497 Views
    • Oldest to Newest
    • Newest to Oldest
    • Most Votes
Reply
  • Reply as topic
Log in to reply
This topic has been deleted. Only users with topic management privileges can see it.
  • Brijesh Bhatia Offline
    bbrijeshB Offline
    Brijesh Bhatia

    Pro User

    wrote on last edited by admin
    #1

    Since the pandemic-induced market in 2020, PSU banks have been on a remarkable run, consistently outperforming their private counterparts. The ratio chart of the Nifty Private Bank Index to the Nifty PSU Bank Index peaked in 2020, signalling a significant advantage for PSU banks over private banks during this period. Among the underperformers was the behemoth, HDFC Bank, which struggled to keep pace.

    However, recent trends suggest a shift in momentum. The metaphorical elephant, HDFC Bank, has awakened, and private banks are beginning to regain footing. But how long can this resurgence last?

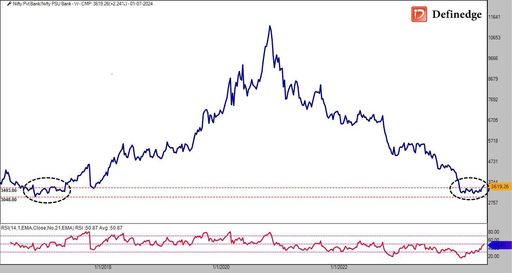
    Nifty Pvt Bank/Nifty PSU Bank Ratio Chart
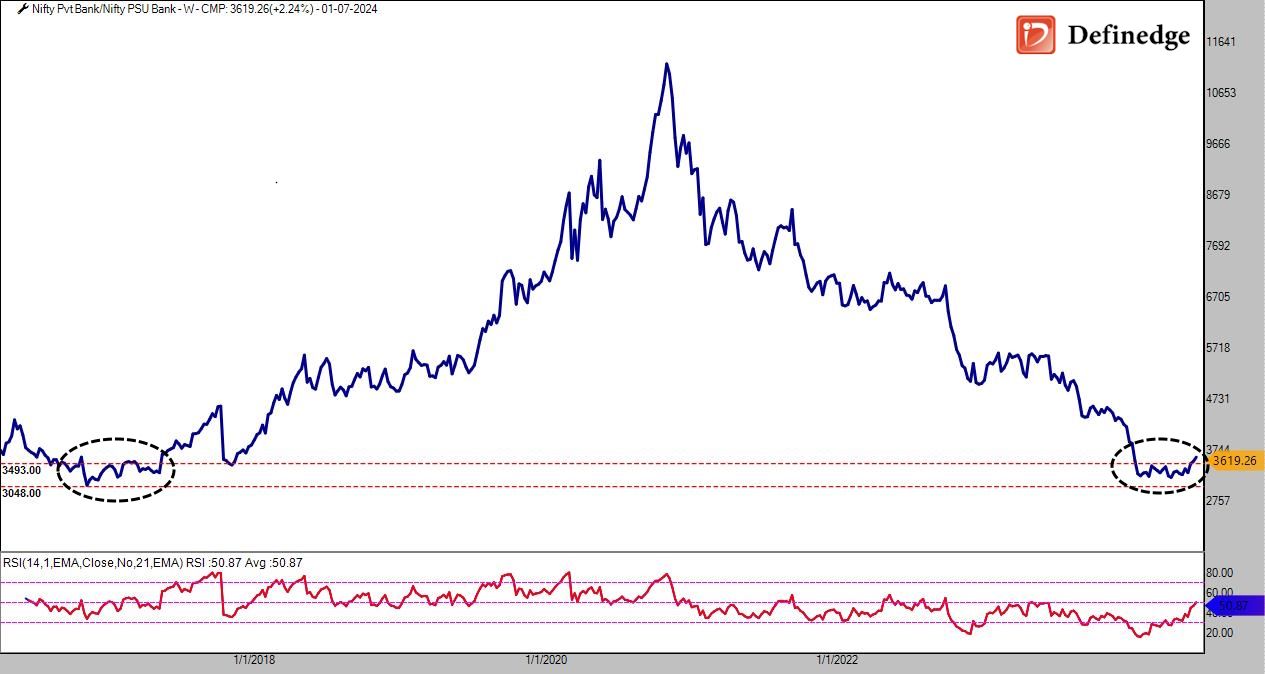
    PVT vs PSU_03-07-2024.jpg
    Source: TradePoint

    An analysis of the ratio chart reveals a promising development. The slope is turning northwards from the support zone established in 2016-2017, hinting that PSU banks may soon start to underperform relative to private banks. This trend suggests that now might be an opportune moment to refocus on private banking institutions.

    Moreover, the RSI (Relative Strength Index) indicator adds to the optimism. It has turned positive and crossed above the median line of 50, a bullish signal indicating that private banks may outperform PSU banks in the coming months.

    We ran the "All Chart Matrix" in RZone to check the stock trend on Multi-Chart and Multi-Timeframe.
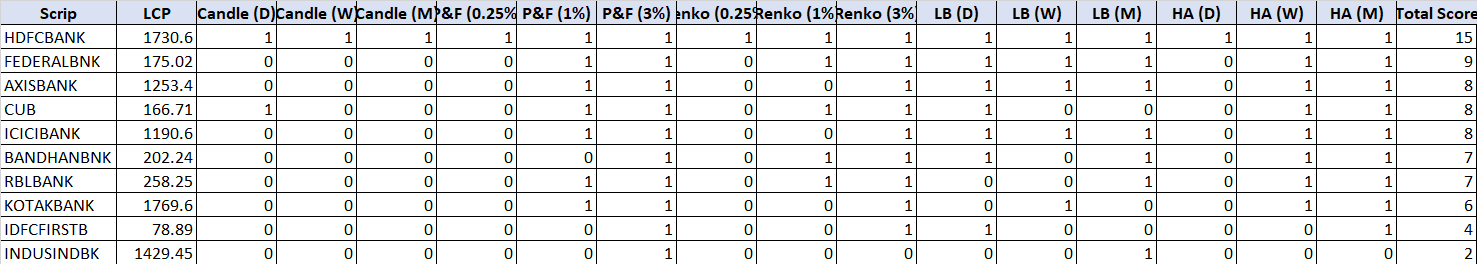
    e2477f4a-d7b4-42fc-a2e1-2c0c75ab2084-image.png
    Source: RZone

    In conclusion, the four-year drought for private banks could be nearing its end. With favourable technical indicators and a shift in market sentiment, private banks appear poised for a potential resurgence.

    Regards,
    Brijesh Bhatia,
    Definedge Forum.

    1 Reply Last reply
    4
  • M Offline
    M Offline
    Manik Arora
    wrote on last edited by
    #2

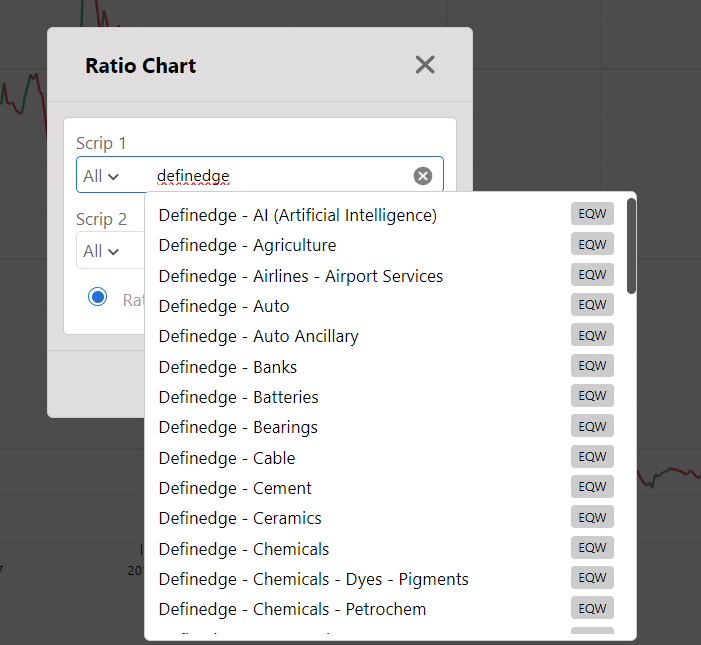
    Sir, can I see rato charts for definedge custom sectors on tradepoint web.. I can view the stocks within the sectors but not the sector itself.. for eg. Definedge Tyres/ Nifty 500.. how to do that

    1 Reply Last reply
    0
  • Brijesh Bhatia Offline
    bbrijeshB Offline
    Brijesh Bhatia

    Pro User

    wrote on last edited by
    #3

    Open Ratio Chart and write Definedge, you will get the list of Definedge EQW index. Check below:

    image.png

    Regards,
    Brijesh Bhatia,
    Definedge Forum.

    1 Reply Last reply
    0
  • M Offline
    M Offline
    Manik Arora
    wrote on last edited by
    #4

    no sir, the definedge sectors dont come.. it says 'no matching symbol found'

    1 Reply Last reply
    0


Recent Posts

  • manzandu123@gmail.comM
    Daily Setup 12th MAY 2025 (MKLH)
  • V
    REBALANCING
  • P
    Issue in quarterly option - Momentum Investing
  • DefinedgeD
    Friday webinar
  • J
    Open vertical counts target price selection
  • Login

  • Login or register to search.
  • Blog
  • Youtube Videos
  • Refresh
  • First post
    Last post
0
  • Recent
  • Categories
  • Unread 0
  • Popular
  • Tags
  • More
    • Guidelines
    • Disclaimer
  • Users
  • Login

  • Login or register to search.
  • Blog
  • Youtube Videos
  • Refresh