• Recent
  • Categories
  • 0 Unread 0
  • Popular
  • Tags
  • More
    • Guidelines
    • Disclaimer
  • Users
Skins
  • Light
  • Default
  • Cerulean
  • Cosmo
  • Flatly
  • Journal
  • Litera
  • Lumen
  • Lux
  • Materia
  • Minty
  • Morph
  • Pulse
  • Quartz
  • Sandstone
  • Simplex
  • Sketchy
  • Spacelab
  • United
  • Yeti
  • Zephyr
  • Dark
  • Cyborg
  • Darkly
  • Slate
  • Solar
  • Superhero
  • Vapor
Collapse
Definedge Forum Logo

Rallis India

Scheduled Pinned Locked Moved Charts
1 Posts 1 Posters 62 Views
    • Oldest to Newest
    • Newest to Oldest
    • Most Votes
Reply
  • Reply as topic
Log in to reply
This topic has been deleted. Only users with topic management privileges can see it.
  • Brijesh Bhatia Offline
    bbrijeshB Offline
    Brijesh Bhatia

    Pro User

    wrote on last edited by
    #1

    Rallis India, the stock price witnessed a remarkable reversal, surging from a support level of Rs. 180 to Rs. 210.

    There are multiple bullish patterns visible on the chart:

    RALLIS_2023-07-06.png

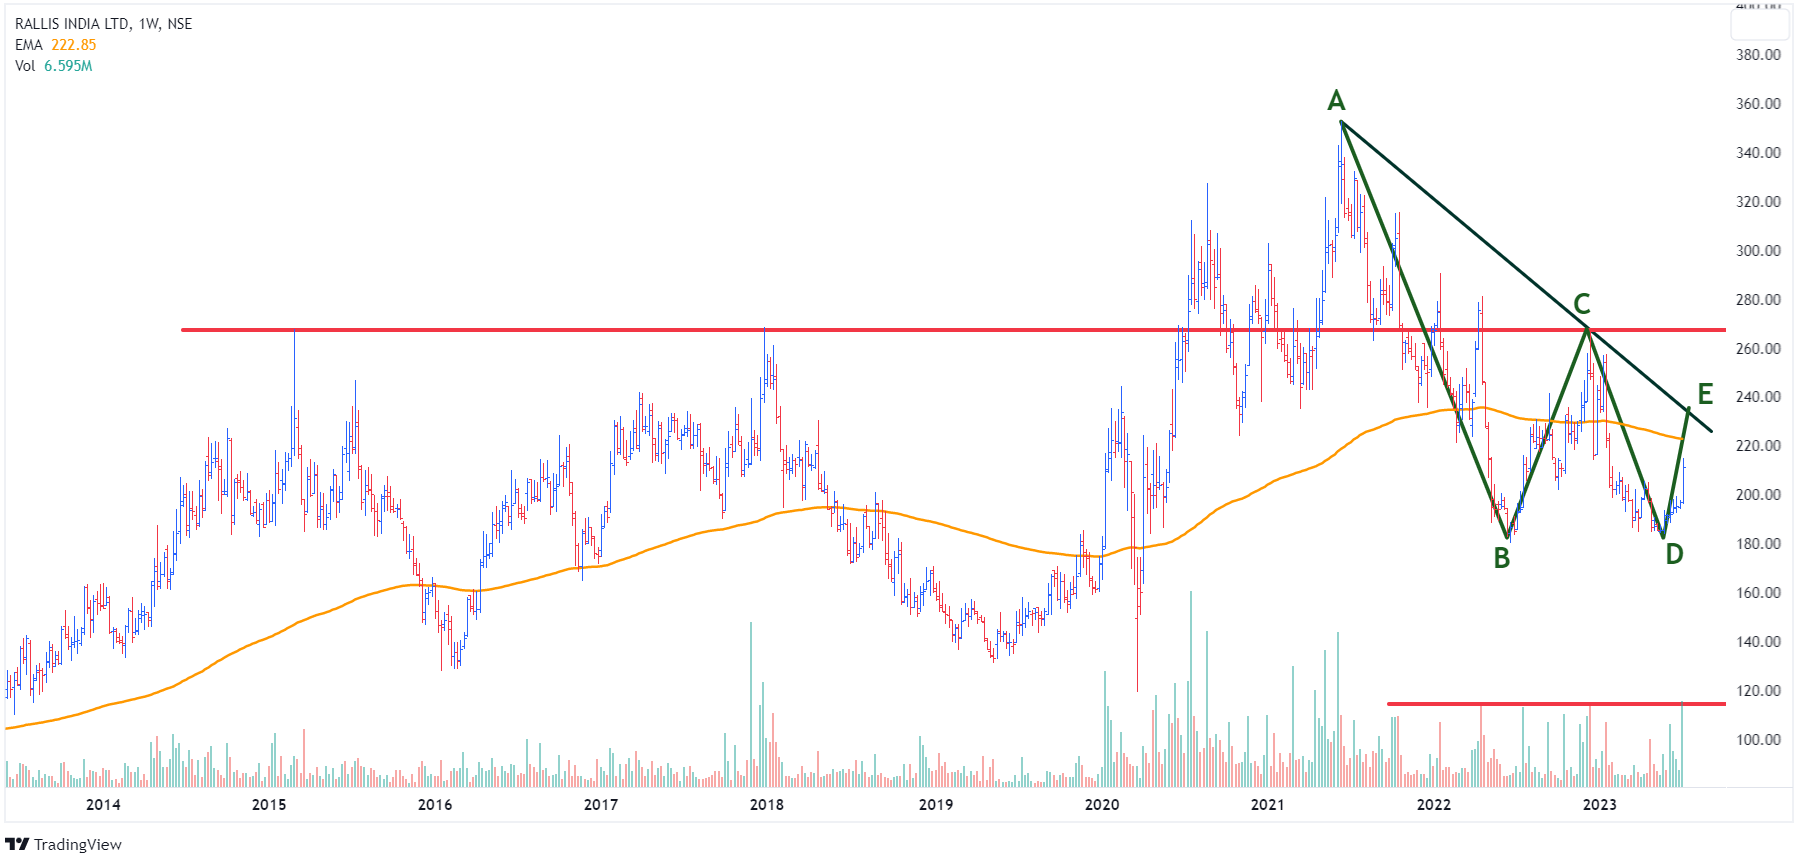
    **1. Bullish Dragon Harmonic Pattern: **
    The Bullish Dragon harmonic pattern is a significant technical formation that suggests a potential reversal from a bearish to a bullish trend. This pattern consists of a tail, head, and legs. In this case, the tail is placed at Rs. 235, indicating a potential resistance level.

    A breakout from the harmonic patterns at the tail opens the door for further upward movement for probable levels of Rs. 330.

    2. Double Bottom:
    A minor hurdle is observed on the chart at Rs. 270, which, when surpassed, would result in the confirmation of a double bottom pattern. The breakout from the neckline will confirm the bottom and strengthen the bullish case for the stock.

    The presence of a common double-bottom pattern is likely to attract more buyers as this is a well-known and widely recognized bullish reversal formation that can generate increased buying interest from traders and investors.

    The influx of buyers could further propel the stock price towards the target of Rs. 330.

    At the current price of Rs. 210, it is advisable to exercise patience and wait for a breakout, as it may lead to an effective trade setup. The current volumes are not substantial enough to convince long-term investors at the current levels.

    Regards,
    Brijesh Bhatia,
    Definedge Forum.

    1 Reply Last reply
    0


Recent Posts

  • manzandu123@gmail.comM
    Daily Setup 12th MAY 2025 (MKLH)
  • V
    REBALANCING
  • P
    Issue in quarterly option - Momentum Investing
  • DefinedgeD
    Friday webinar
  • J
    Open vertical counts target price selection
  • Login

  • Login or register to search.
  • Blog
  • Youtube Videos
  • Refresh
  • First post
    Last post
0
  • Recent
  • Categories
  • Unread 0
  • Popular
  • Tags
  • More
    • Guidelines
    • Disclaimer
  • Users
  • Login

  • Login or register to search.
  • Blog
  • Youtube Videos
  • Refresh