• Recent
  • Categories
  • 0 Unread 0
  • Popular
  • Tags
  • More
    • Guidelines
    • Disclaimer
  • Users
Skins
  • Light
  • Default
  • Cerulean
  • Cosmo
  • Flatly
  • Journal
  • Litera
  • Lumen
  • Lux
  • Materia
  • Minty
  • Morph
  • Pulse
  • Quartz
  • Sandstone
  • Simplex
  • Sketchy
  • Spacelab
  • United
  • Yeti
  • Zephyr
  • Dark
  • Cyborg
  • Darkly
  • Slate
  • Solar
  • Superhero
  • Vapor
Collapse
Definedge Forum Logo

The Outperforming Bullish Sector for February can be...

Scheduled Pinned Locked Moved Charts
ratio chartrsigolden cross
6 Posts 6 Posters 280 Views
    • Oldest to Newest
    • Newest to Oldest
    • Most Votes
Reply
  • Reply as topic
Log in to reply
This topic has been deleted. Only users with topic management privileges can see it.
  • Brijesh Bhatia Offline
    bbrijeshB Offline
    Brijesh Bhatia

    Pro User

    wrote on last edited by
    #1

    When analyzing sectors relative to the Nifty50, technical analysts often rely on ratio charts to identify outperforming and underperforming sectors. But what if we could go a step further and spot a bullish setup on these ratio charts? Such setups could strengthen our medium-term view on which sector is likely to outperform.

    To identify a strong sector, use the following parameters on a ratio chart and scan them using tools like RZone:

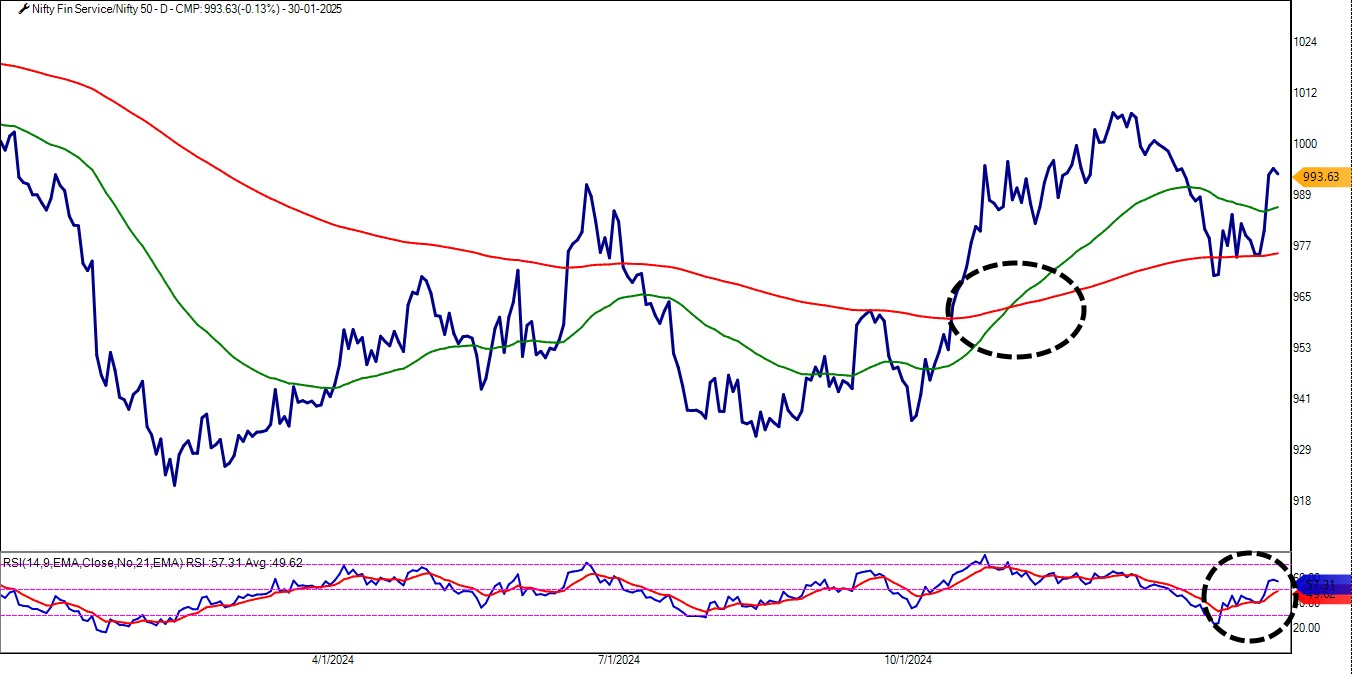
    1. Golden Cross: When the short-term moving average crosses above the long-term moving average on a ratio chart, it signals a potential long-term bullish trend for that sector.

    2. RSI Positive Crossover: Look for the RSI crossing above 50, signaling that momentum is shifting in favor of the bulls.

    3. RSI Above 50: The RSI should stay above the 50 midline, confirming that the sector is in a strong bullish phase.

    This combination of indicators is a powerful setup for identifying sectors likely to outperform for an extended period.

    Here is the sector found using the scanner.

    Nifty Financial Services / Nifty 50 Ratio Chart:

    89bc8632-8bbe-4f58-9a5d-f6bfc1491a8d-image.png

    Want to learn how to scan for these setups? Let us know in the comments below!

    Regards,
    Brijesh Bhatia,
    Definedge Forum.

    1 Reply Last reply
    2
  • R Offline
    R Offline
    Rishabh Jain
    wrote on last edited by
    #2

    good one brijesh bhai

    1 Reply Last reply
    1
  • P Offline
    P Offline
    PRANAV GULABANI

    Pro User

    wrote on last edited by
    #3

    Always interested to learn

    1 Reply Last reply
    1
  • M Offline
    M Offline
    Manish Pillai

    Pro User

    wrote on last edited by
    #4

    Always look forward to learning from you Brijesh bhai

    1 Reply Last reply
    1
  • G Offline
    G Offline
    Sachchida Nand Gupta

    Pro User

    wrote on last edited by
    #5

    looking forward from you.

    1 Reply Last reply
    1
  • V Offline
    V Offline
    Virendra Mahajan
    wrote on last edited by
    #6

    Interested to learn the trade through the setup. Thank You !

    1 Reply Last reply
    1


Recent Posts

  • DefinedgeD
    Friday webinar
  • A
    Master Momentum Trading
  • manzandu123@gmail.comM
    Daily Setup 09th MAY 2025 (MKLH)
  • A
    Market Trend Filter | MAST Value
  • prashant.shah26@gmail.comP
    Feature request - Momentum Strategy
  • Login

  • Login or register to search.
  • Blog
  • Youtube Videos
  • Refresh
  • First post
    Last post
0
  • Recent
  • Categories
  • Unread 0
  • Popular
  • Tags
  • More
    • Guidelines
    • Disclaimer
  • Users
  • Login

  • Login or register to search.
  • Blog
  • Youtube Videos
  • Refresh