 Nifty 500 (Broad Market) – Long-Term RSI Perspective
-
Nifty 500 (Broad Market) – Long-Term RSI Perspective
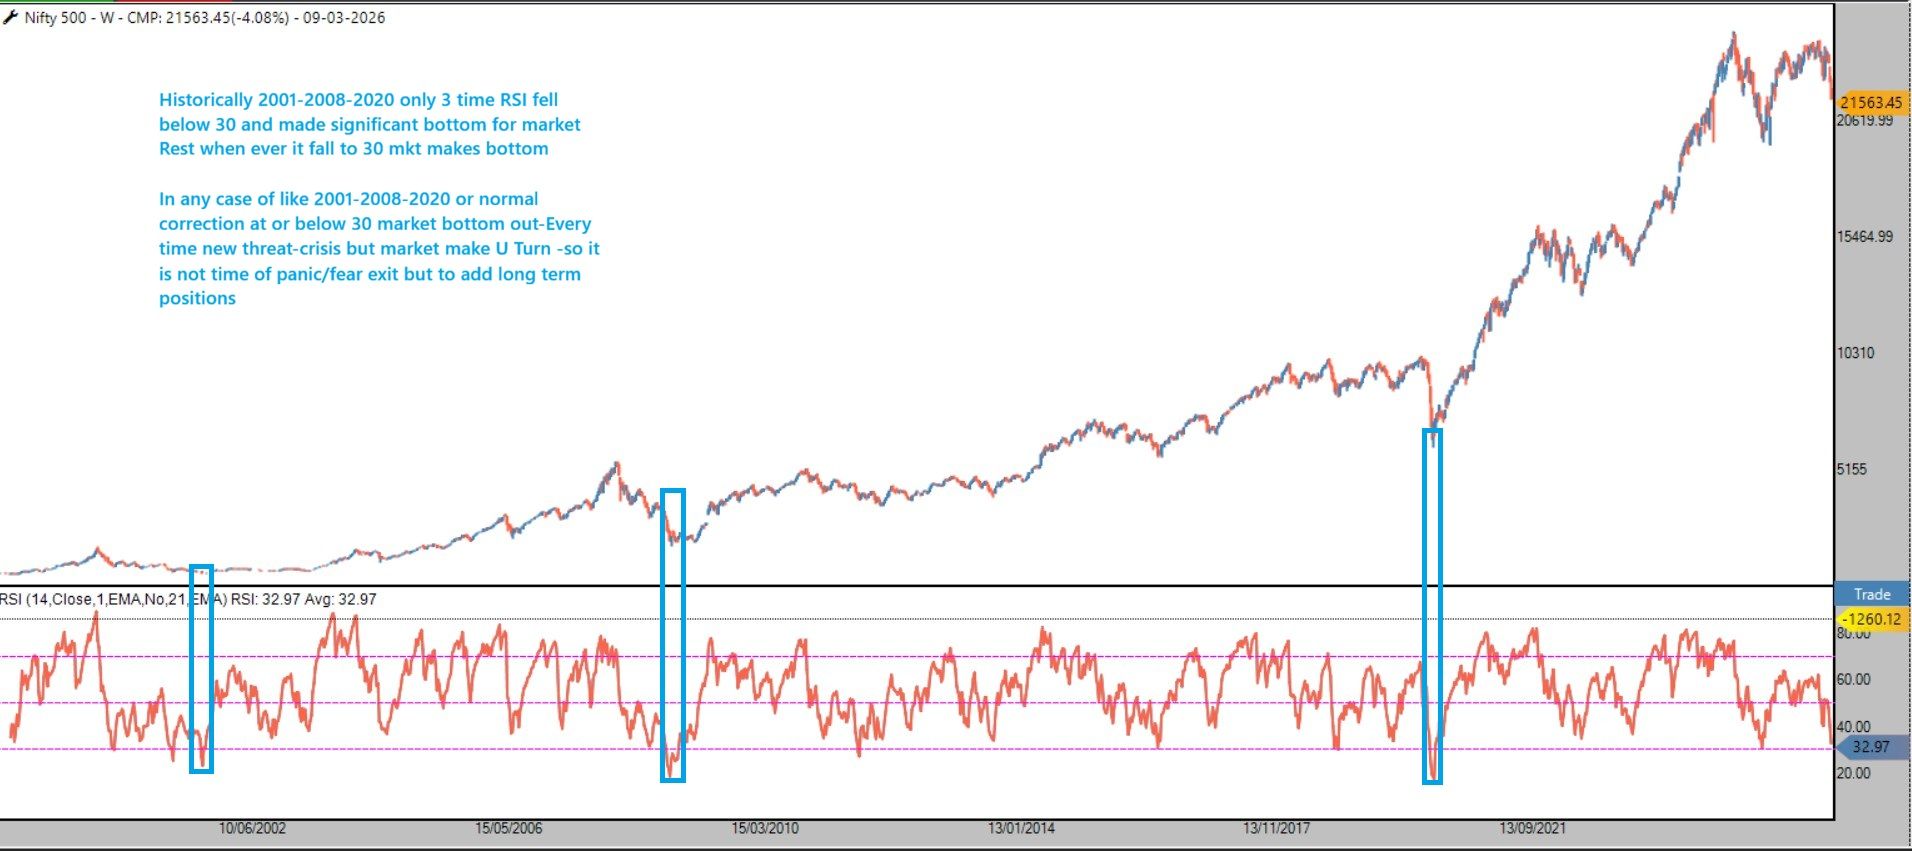
The Nifty 500 Index, representing nearly 96% of India’s total market capitalization, offers one of the clearest pictures of overall market sentiment.
A study of the weekly RSI over the past two decades reveals an important pattern:
 Historical Observation
Since 2001, the weekly RSI has fallen below 30 only three times:
2001–2002: Dot-com aftermath
2008–2009: Global Financial Crisis
2020: COVID crashEach of these instances coincided with major long-term market bottoms.
 Normal Market Corrections
Outside of extreme crises, whenever the weekly RSI approaches the 30 zone, markets tend to form intermediate bottoms and stage strong recoveries.
 ️ What This Means for Investors
Periods when RSI approaches or dips near oversold territory historically coincide with maximum pessimism.
These phases often feel like the worst time emotionally, but statistically they have been among the best opportunities to accumulate long-term positions.
 Key Insight
Markets typically bottom on fear and uncertainty, not on comfort or consensus.
Historically, oversold RSI zones in the broad market have marked phases of opportunity rather than panic exits.For long-term investors and portfolio allocators, such periods should be viewed through the lens of strategic accumulation rather than emotional reaction.
Nishesh Jani,CFTe
#Nifty500 #StockMarketIndia #MarketCycle #TechnicalAnalysis #RSI #MarketBottom #Investing #StockMarket #LongTermInvesting #MarketInsights #nisheshjani #AhmedabadNest
-
remember this accumlation alert ?