Charting the Yen's Rise, But... {USDJPY}
-
The carry trade has become the focal point of market discussions as the Japanese Yen has appreciated significantly against the Dollar (USD), moving from 162 to 142 in just five weeks. This shift follows the Bank of Japan's (BOJ) decision to increase its key interest rate to around 0.25%. The hike in borrowing costs has led to a cool-off in global equity markets, particularly affecting US fund houses.
Technical Analysis:
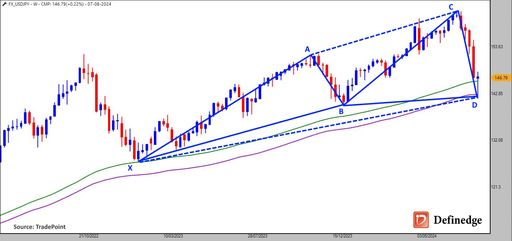
The USD/JPY pair has yet to break the December 2023 low of 140, indicating that it remains in a bullish phase according to Dow Theory (positive for the USD).
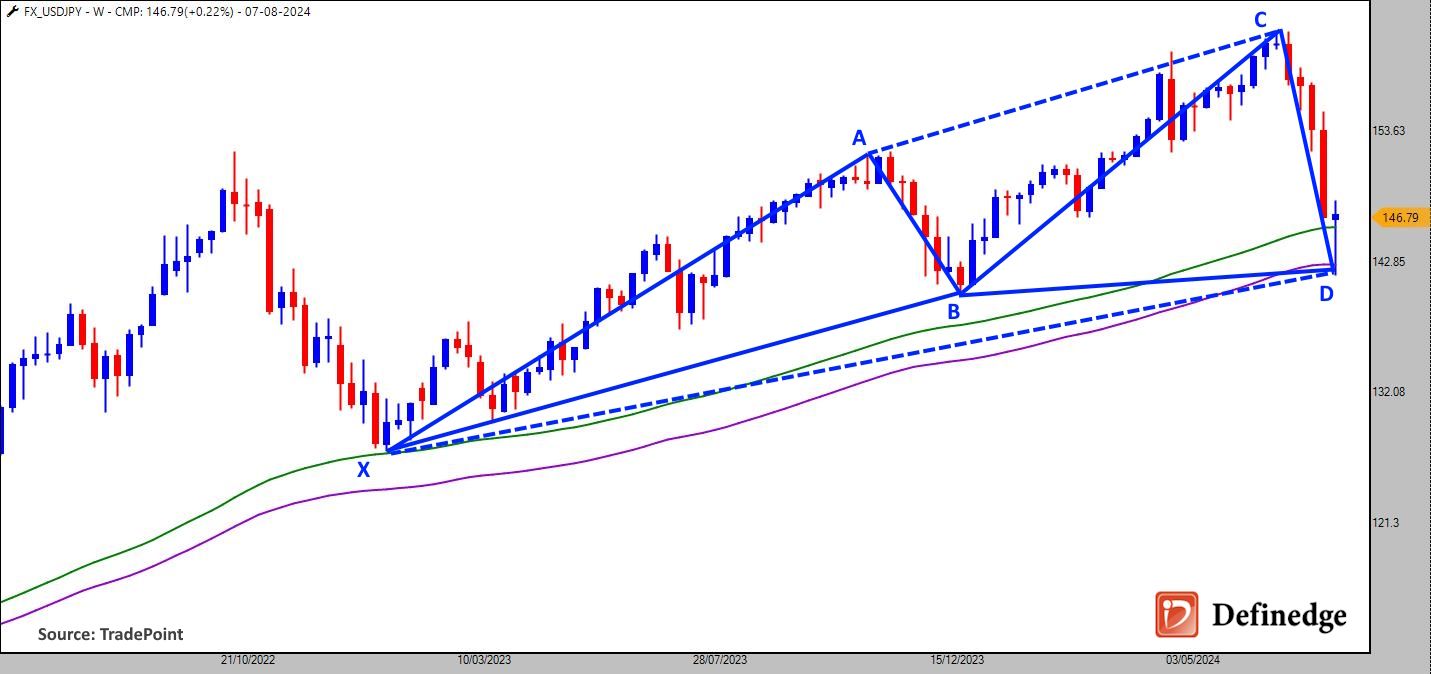
The Bullish Swan Harmonic Pattern is visible at the low of 141.69 in the demand zone of the 100 MA Channel. The reversal from the current levels can test the 151.35 levels in the short-term while the possibility of the new highs cannot be ignored in the medium-to-long term perspective.
Any weekly close below 140 could signal caution for US equities, potentially causing ripple effects across global markets.
-
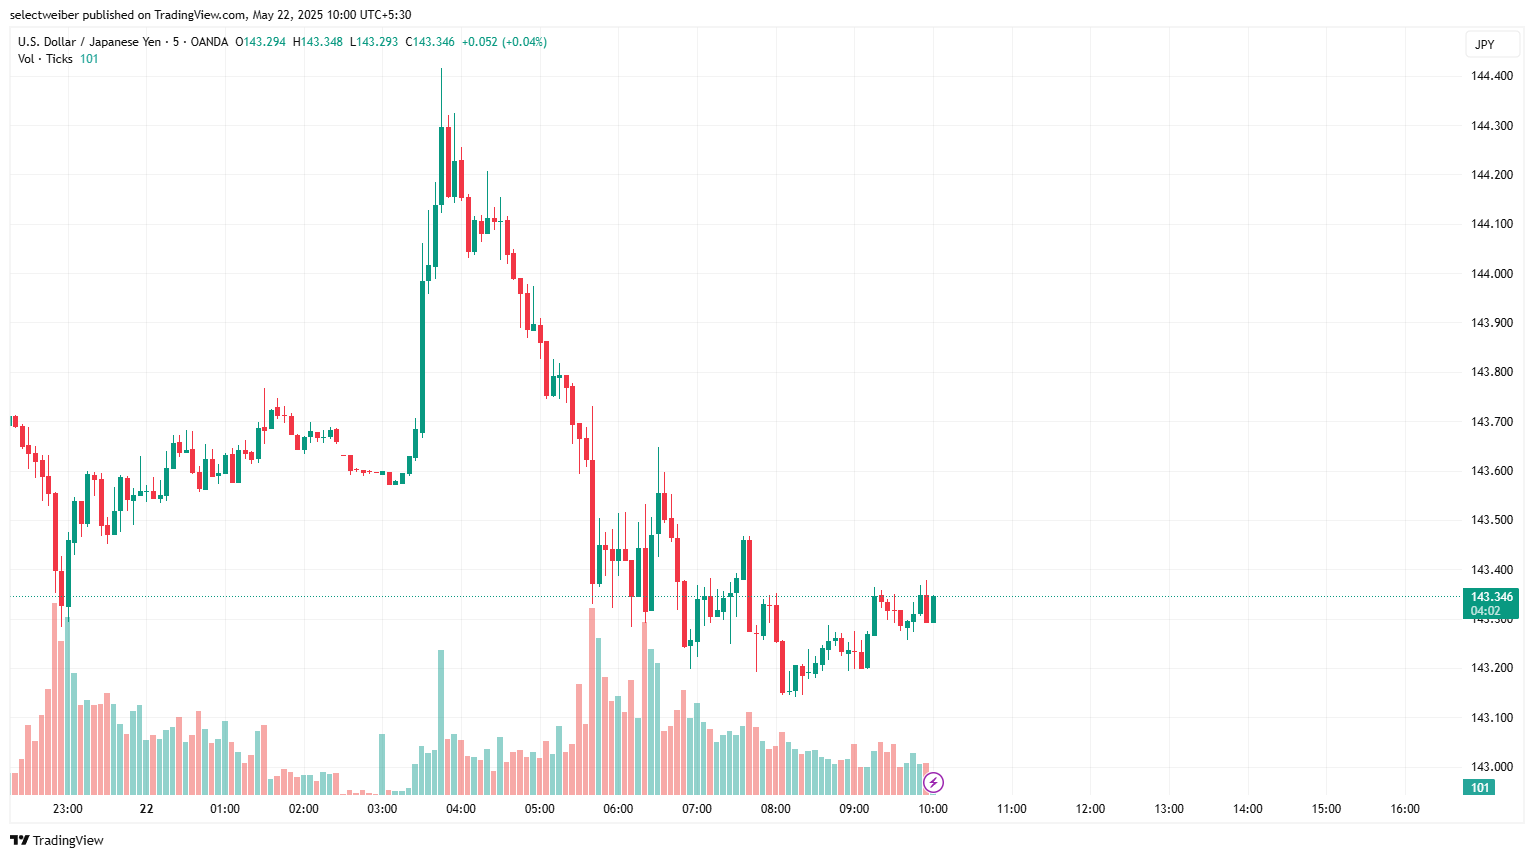
 Trade Setup (Short-Term Intraday - Bullish Bias)
 Entry (Buy Limit):
Entry Price: 143.25
(Buy on a slight pullback, near minor support within the current range) Stop Loss (SL):
SL Price: 143.00
(Below the recent low — if price breaks that, bias may flip bearish) Take Profit (TP):
TP1: 143.55 (recent local high)TP2: 143.80 (strong resistance level from earlier session)
 ️ Risk-Reward Ratio
Risk: 25 pips (SL: 143.25 → 143.00)Reward:
TP1: 30 pips
TP2: 55 pips
R:R = 1.2 to 2.2 depending on exit strategy
 Community Notes
Trend: Short-term consolidation, possible bullish breakout.Caution: High volatility during Tokyo/London overlap — tighten SL if price accelerates.
Alternative Plan: If price breaks below 143.00 with volume, consider flipping short.