Nifty 500 - Bullish Candlestick + RSI Stats
-
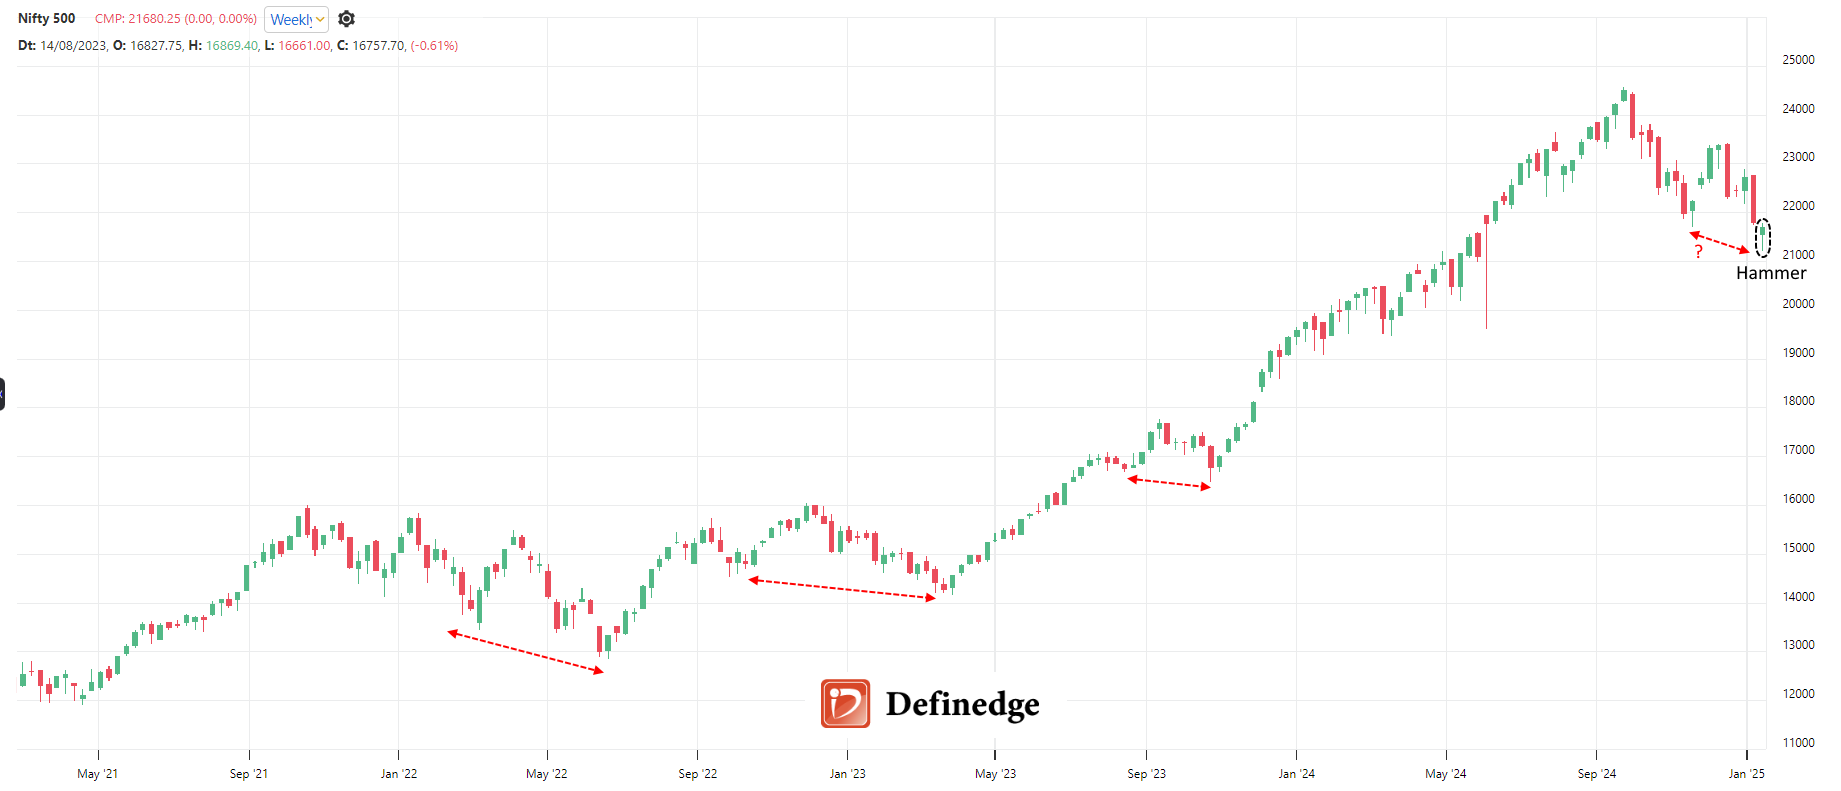
On the weekly chart of Nifty 500, the bears lack the follow-up momentum after breaking the previous swing low, and the current candlestick pattern highlights that exhaustion may be another case of failure for bears.
Some interesting stats on the constituents of Nifty500 on the RSI indicator. Want to read more about RSI, click here
Around 60% of the stocks are currently in the positive zone, which indicates that a majority of the market is seeing bullish momentum. Let's break this down further:
- Positive Fresh Crossover (55 stocks): These stocks have recently seen a positive crossover, signalling fresh bullish momentum. They will likely be in an uptrend or confirm the reversal, suggesting potential strength in the broader market.
- Positive (241 stocks): These stocks are in the positive RSI zone and have a more moderate bullish stance across a significant portion of the market.
- Negative (161 stocks): These stocks are in the negative RSI zone, suggesting they are under selling pressure. However, the number of stocks in this category is not overwhelming, which means the overall market sentiment still leans toward the positive side.
- Negative Fresh Crossover (43 stocks): These stocks have recently seen a negative crossover, signalling a fresh bearish shift. Although this number is relatively small, it cannot be ignored, as it indicates that some stocks in the market are experiencing fresh selling pressure.
What's your take on the markets, write in the comment below.
 Why the Straddle is a Core Weapon in NIFTY Intraday & Swing Trading