Hype, Herds, or Hesitation? - Nifty Chart Setup
-
Following the Pahalgam attack, many traders hesitated to take new positions, bracing for a potential war. This cautious sentiment, driven more by fear than facts, led to a herd mentality that caused many to miss a significant trend in the market.
At Definedge, we believe in staying anchored to an objective, system-based approach—relying on what charts and data reveal, not speculation.
A Look at the Nifty50
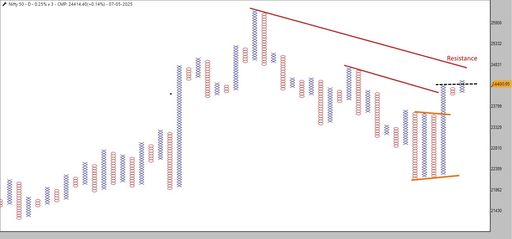
Point & Figure Chart (0.25% x 3 Daily)
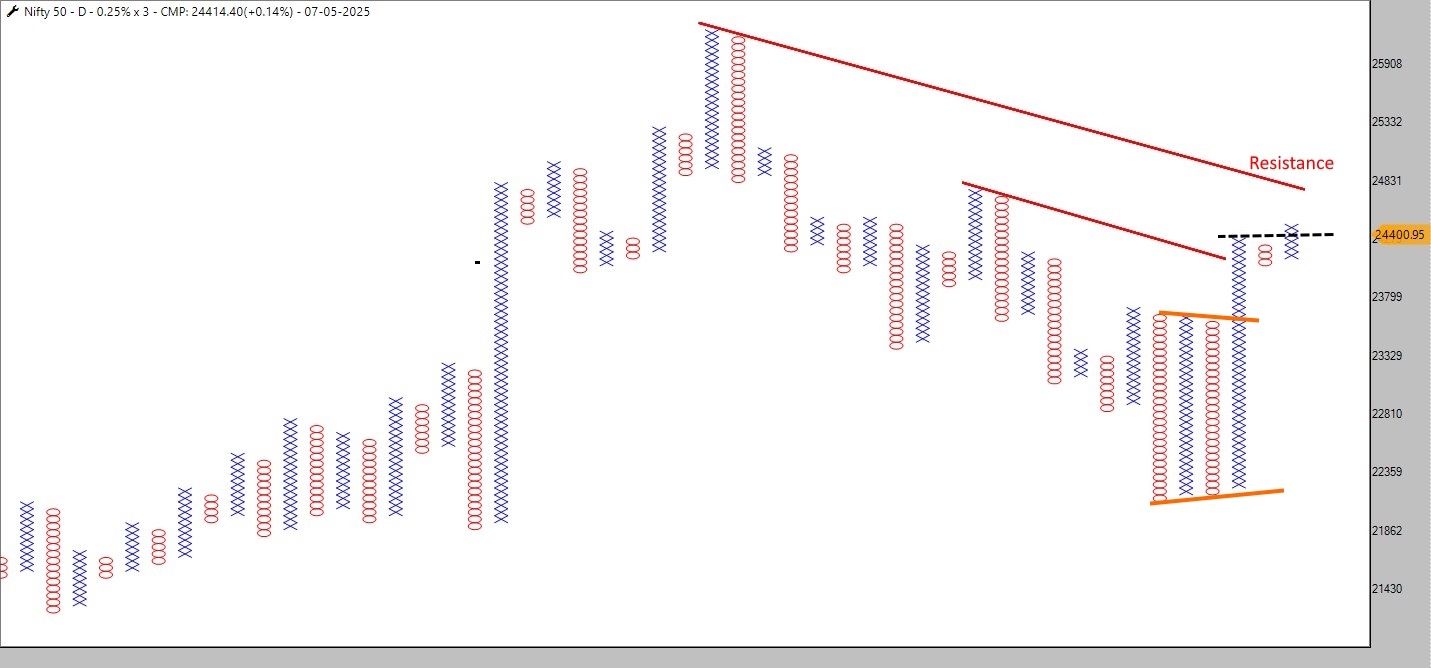
The Nifty50 recently broke out of a four-column triangle pattern on the P&F chart—a classic continuation pattern. This move was confirmed by an Anchor Column Follow Through (AFT), suggesting renewed bullish strength. Minor resistance lies at the 45-degree trendline, but the breakout is technically significant.
Heikin Ashi Weekly Chart
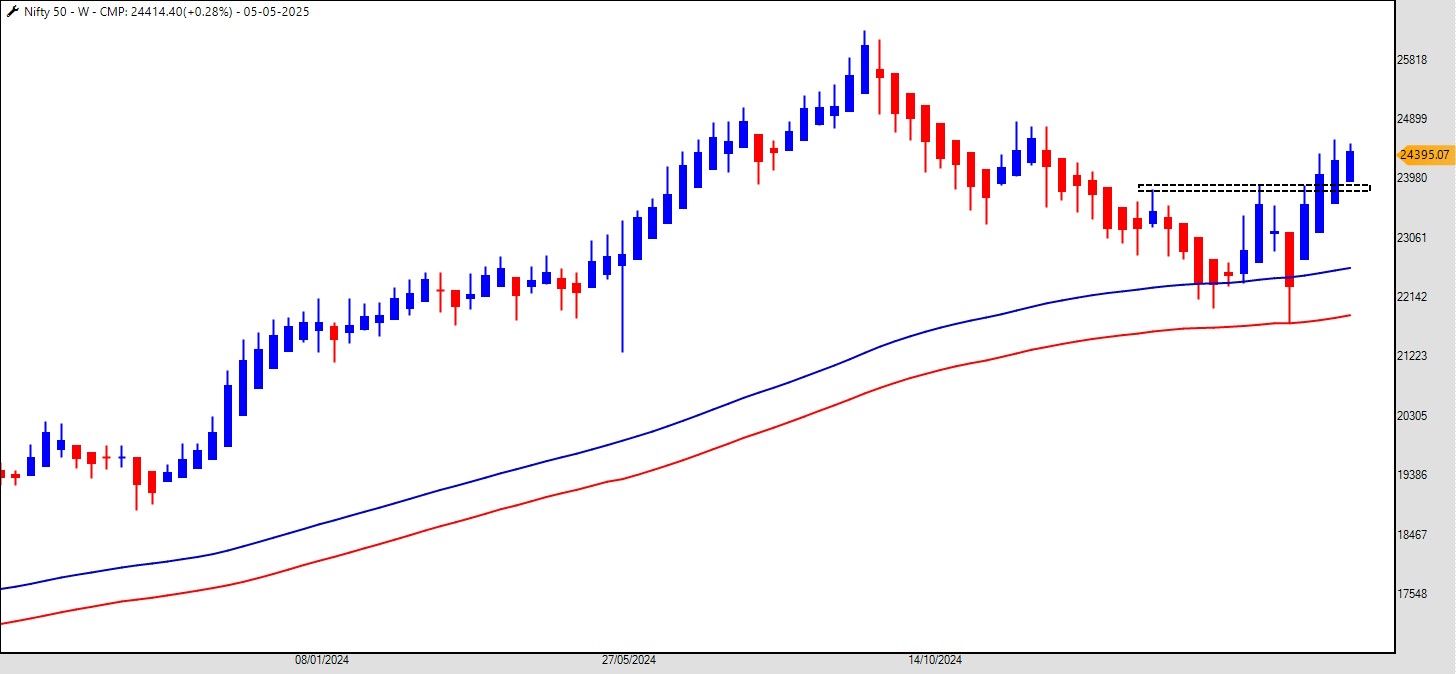
On the Heikin Ashi chart, the Nifty reversed near the 200-week exponential moving average (WEMA) channel. It formed multiple bullish candles and successfully cleared a key resistance zone. This chart setup reinforces the positive outlook.
RSI Indicator: Momentum Still Bullish
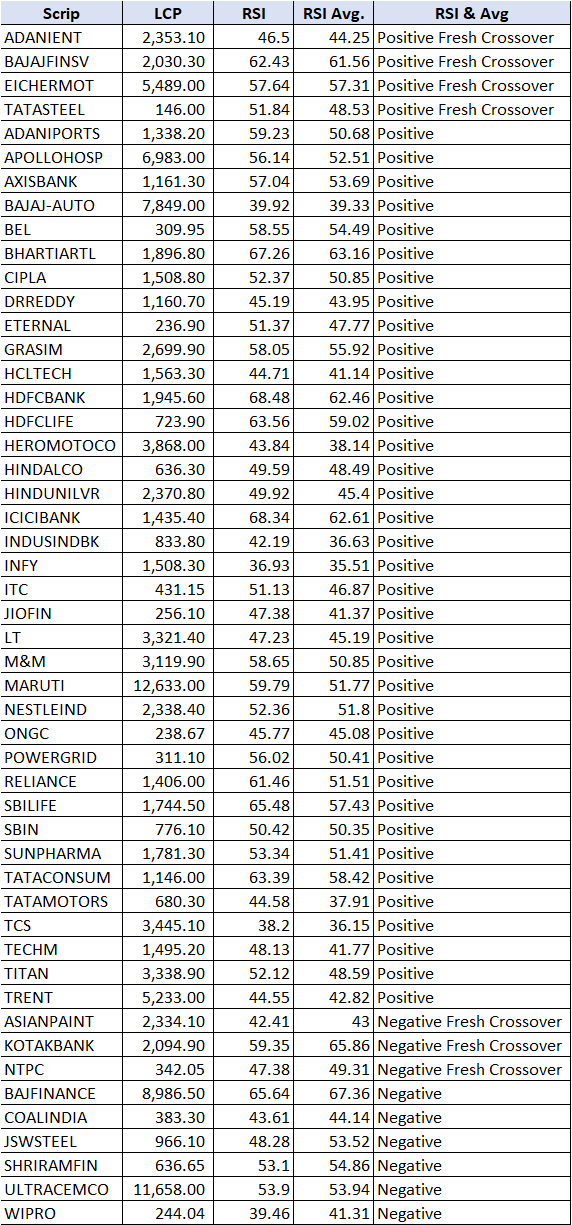
Perhaps the most compelling statistic comes from the RSI Indicator Digger scanner: 41 of the 50 Nifty stocks currently show a positive weekly RSI trend. This signals strong underlying momentum, with bulls clearly maintaining control.Be Objective, Stay Prepared
While equity markets inherently carry risk, letting fear drive decisions often leads to missed opportunities. Traders should stay alert to trend change levels. As per the P&F chart, a close below 24,000 would negate the current bullish setup. A follow-through below this level will help confirm whether it’s a reversal or simply a consolidation.At Definedge, we continue to trust the systems. The charts speak louder than emotions. Are you listening?