Backtesting results varying massively from what's mentioned in the book.
-
Hello,
Since a couple of days I have been testing out the strategies mentioned in the book. However, I was startled to see there are very big differences in what's mentioned in the book V/S when I actually did the backtesting myself on R-Zone. Also, it is not just limited to 1 strategy but multiple strategies have issues. I haven't tested all of them, but the ones which I have (3 strategies as of now), I am mentioning them below.
It is my request to the Definedge team and Prashant Sir to kindly look into this matter and please provide a solution as well as the logic behind this issue for better understanding of the system. Also, I request everyone else who may have faced any similar/same issues. If yes, do write down below so that the team knows if the issue is universal. If not, I would request you to go ahead and backtest the strategies to see if your backtesting matches or varies from the one mentioned in the book.
Few such examples are as below :
Strategies :
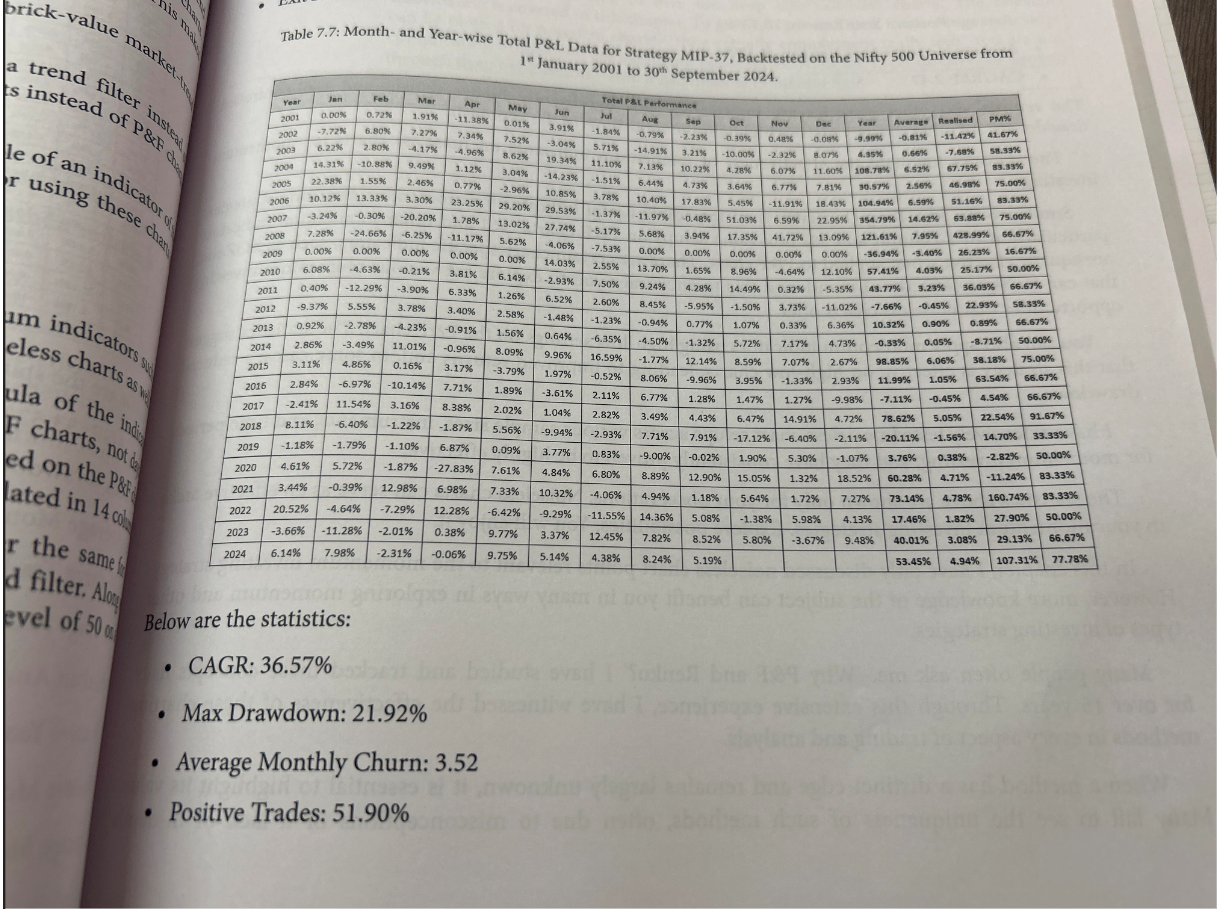
MIP 37 - Book results are : CAGR - 36.57% & Drawdown - 21.92%
Actual Backtesting results : CAGR - 32.72% & Drawdown - 52.92%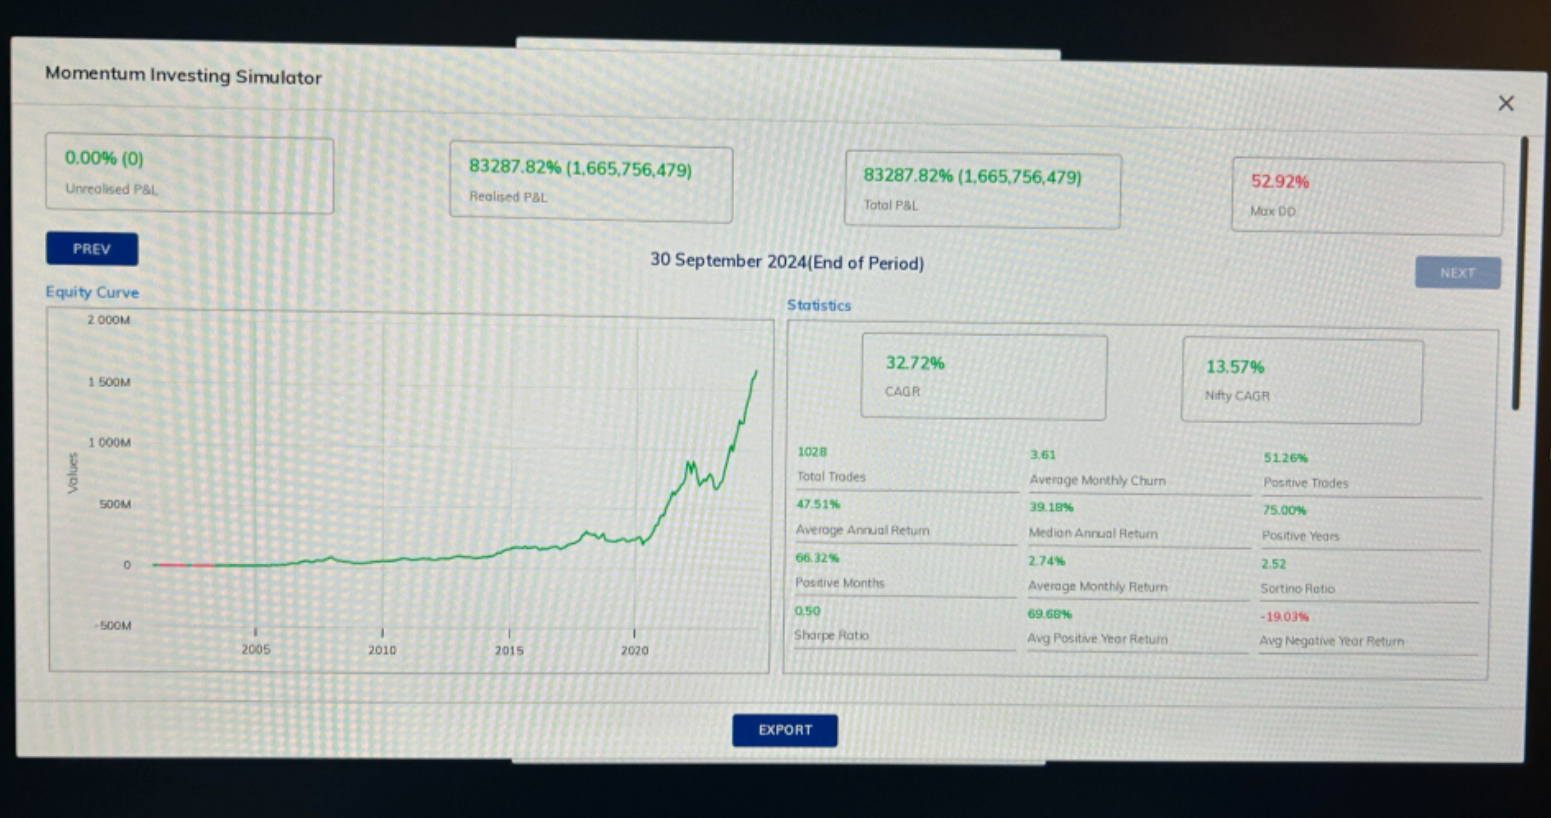
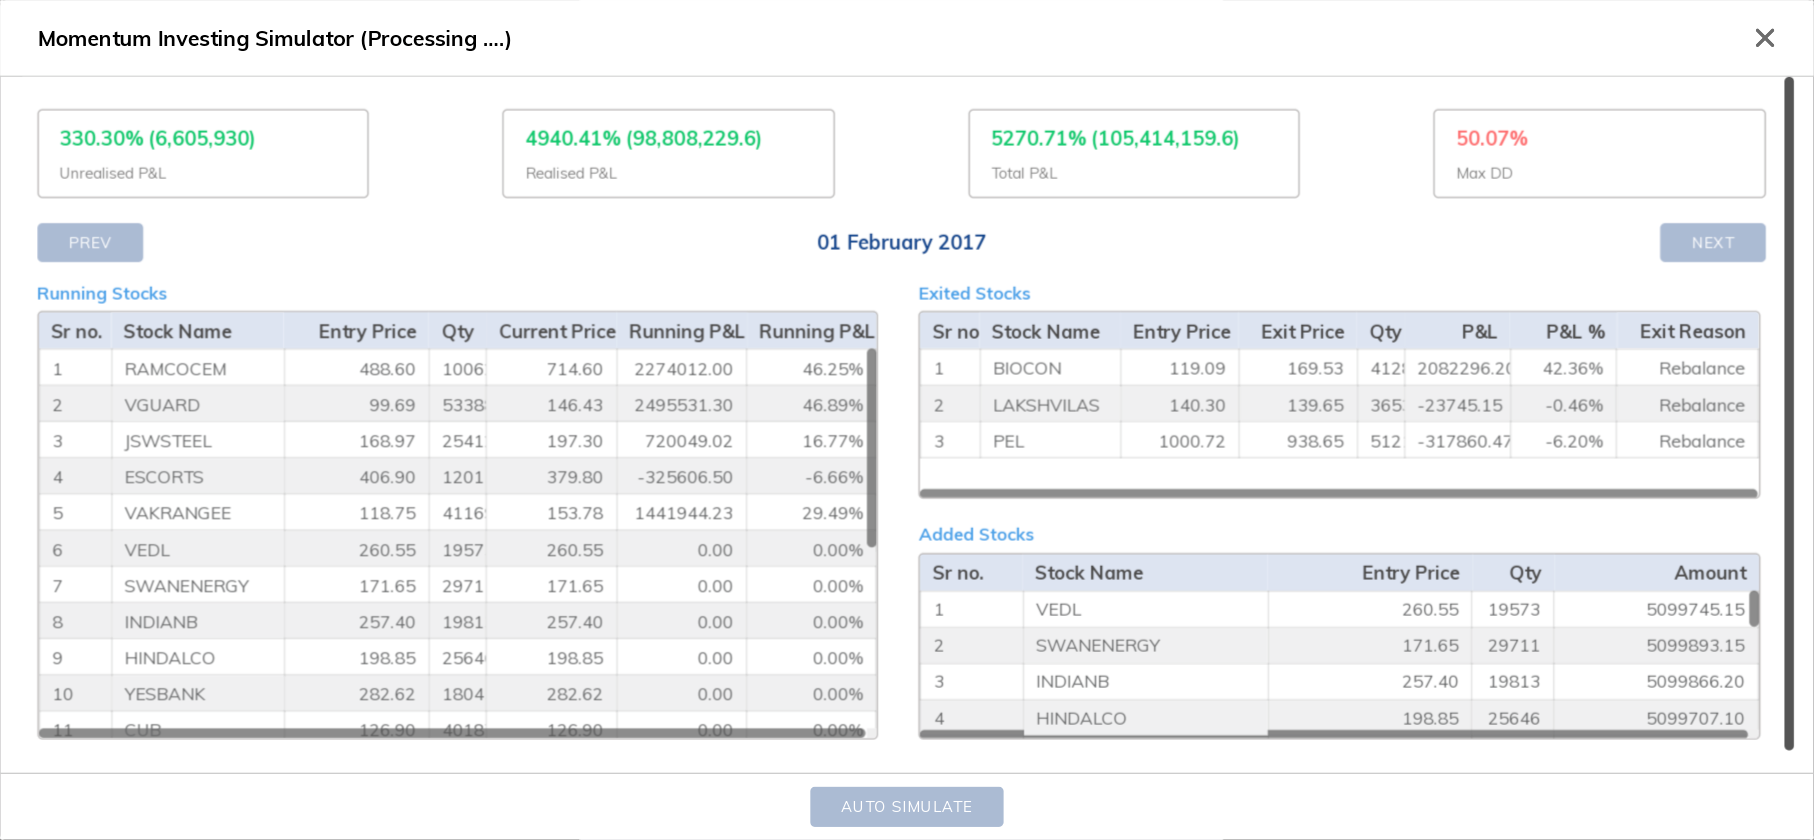
MIP 35 - Book results are : CAGR - 32.45% & Drawdown - 22.29%
Actual Backtesting results : CAGR - & Drawdown - 50.07% (Stopped backtesting as it crossed Max DD in between only)
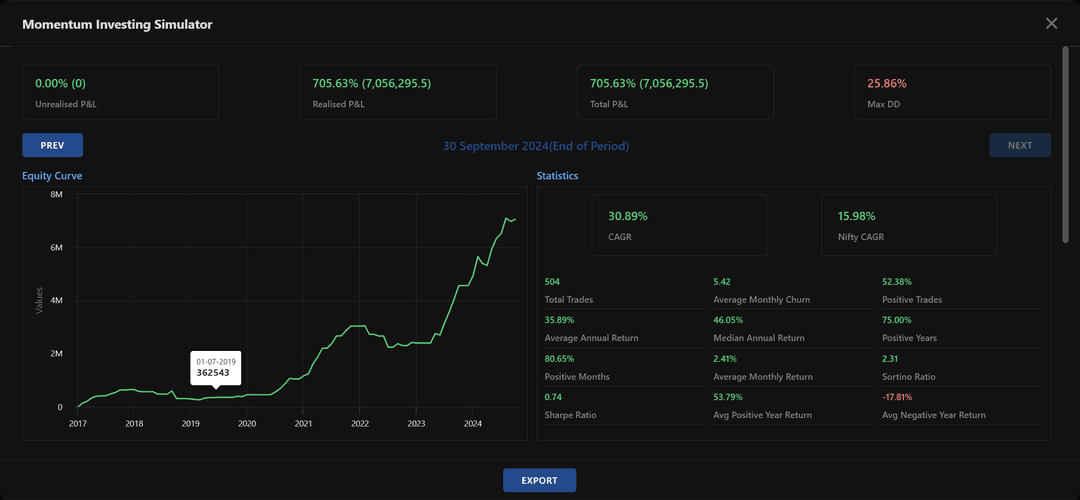
MIP 15 - Book results are : CAGR - 39.22% & Drawdown - 16.75%
Actual Backtesting results : CAGR - 41.4% & Drawdown - **15.98%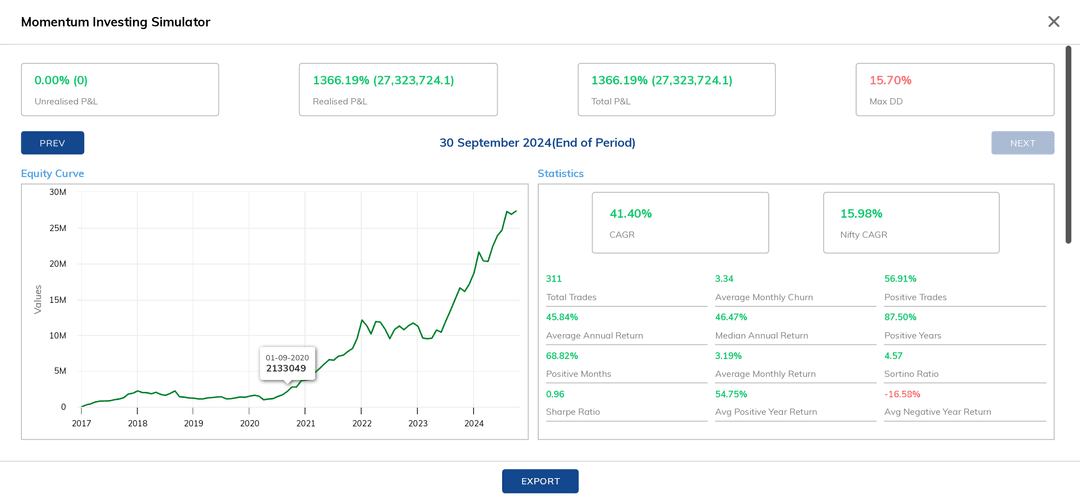
In MIP15, my concern is even though the result maybe good, but how can it be different ? If the same data set is being tested without any variations in parameters ?
I have copied these strategies from "Sample Strategies" from Momentify Page and then backtested it in R-Zone.
Note : I have kept all the parameters unchanged including backtesting date, capital & universe, etc.Hence, it is my humble request to the Definedge team to please look into it and provide a solution as well as logic for this issue in order to avoid any real time issues when we deploy the portfolio for Real Trading.
Thank You
Harshal Chokhawala
19/08/2025 -
Agree even for me especially testing for MIP 37 strategy Universe NIfty 500 backtesting result is varying significantly drawn down coming around 52% against what mentioned in the book 22%, couple od strategies are varying in results ,I request the concern team to take it seriously and remove if any bug ASAP please And upon backtesting couple of times the figures are also changing abruptly ,
-
It might be possible as the platform has been launched recently. Every software is subject to fine tuning and such process is more frequent in earlier days. This could be one of the reasons for such differences.
I am not protecting Definedge. An official statement from the Definedge preferably by Mr Prashant Shah will certainly help in this regard.
-
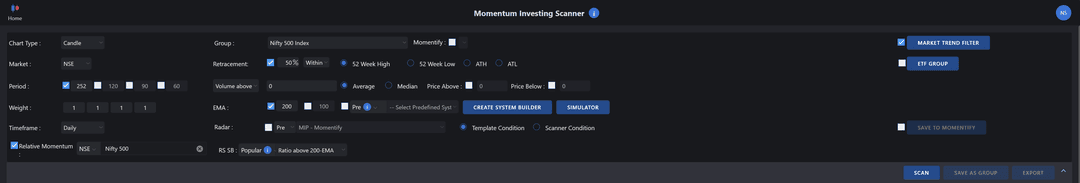
Attached are the settings and results for MIP-15 tried by me on 30 Aug 2025
Scanner conditions
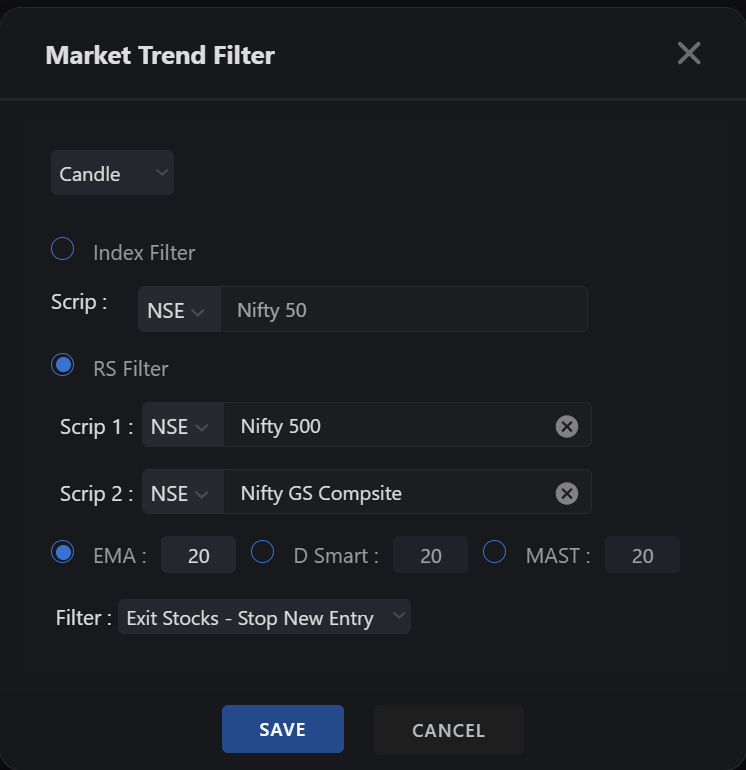
Market trend filter conditions
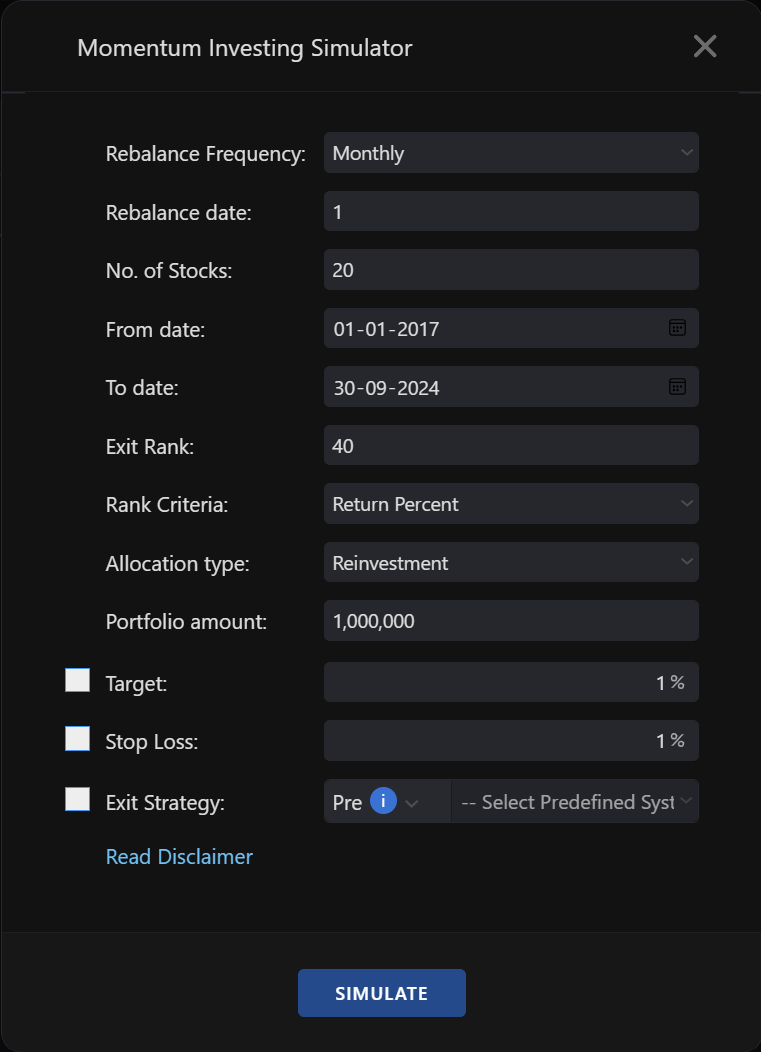
Simulator conditions
Results
-
We are currently replicating the strategies described in Mr Prashant Shah’s book, comparing the outcomes with those presented in the book, and engaging in discussions on the forum.
In my assessment, any difference in results may stem from minor variations in one or more parameters. This observation is not intended to challenge anyone’s understanding. The book was written a few months ago, and since then the system may have undergone multiple refinements, which could also explain the deviations.
That, however, is not the key issue. These strategies should be viewed as guiding frameworks that demonstrate how parameter adjustments can help in achieving optimized outcomes.
While the back tests suggest the possibility of substantial gains—running into crores of rupees—there is no guarantee that markets will behave in exactly the same way in the future. Performance may improve, or it may deteriorate. More crucial than the projected gains is our psychological preparedness: Are we truly ready to remain invested for the duration assumed in these back tests? How will we react when faced with such huge potential profits? At present, many of us may be comfortable investing ₹20,000–25,000 in a single stock. But when the situation demands an allocation of ₹4–5 lakhs in one company, the psychological challenge could be significant.
Therefore, our focus should be on adapting these strategies to minimize drawdowns, as initial losses can easily undermine confidence. By working in this direction and openly sharing our experiences, we can create valuable learning opportunities for all participants.
-
I encountered a similar issue, which I realized after getting the suggestion from prashant sir, was caused by selecting a different trend filter. Please see the details below if it helps.
-
Hi Mr. @Nikhil Sharma, In addition to what Mr. @Saju-Raj said, I noticed your portfolio amount is ₹10 Lakhs. For this amount, Prashanth Sir had suggested a Max Stock Price filter too:
https://forum.definedgesecurities.com/post/7225 -
I have taken MIP 35 strategy as it's from sample strategy given in momentify platform, and kept all setting same as it's
but results are varing massively on what I got on platform vs what shown in book
-
@Rajendra-Manke
Thanks for sharing your inputs on the strategy. However, I partially agree to your views though. I agree that our view should be focusing on the process and improving the psychology.
My only concern is : That if all the parameters are kept same, why is there a differnece in results ? It is like calculating in Excel 2+2 gives "4" as result 92/100 times. Now those 8 times ? Does that mean, it is not 4 ?. If it were the case, we wouldn't be using Excel today based on most times it is right. We use it because there is consistency and repeatability.
My only concern is if the parameters are kept same then why results are different. Because if so, then the results you have mentioned in crores may also be faulty. Remeber, if one thing can go wrong with algo, there can be many. I have studied computers and thus I know miniscule details about it. This only makes me trust the system less. At this point, I must mention, I am least concerned about crores of profit. I am also ok with losses to be frank. What I am not ok with is inconsistency in varying results.
What worries me is if the sytem is not robust, then the credibiity backtesting takes a backseat. Be it max drawdown or profits too. It makes me question how much should I trust the software?!
Anyway, my doubts are logical and worthy to think about from a technical perspectiuve rather than being emotional or subjective about it.
Having said all that, I love what the definedge team has done to create Momentify and I am certain they will keep bringing us with more of such innovatvie ideas and products that we love!
")
-
@Harshal-Chokhawala Did you get any update on deviation in results in MIP-37.
@Definedge @@Definedge-Experts @Definedge Please look into the matter as soon as possible -
For Backtesting MIP 37, what I have realised is that it gives different results if you don't mandatorily select the Market Trend FIlter and save it on the Rzone app vs when you save it. So if you have saved a strategy on Momentify for MIP-37 and simply run it as it is on Rzone without saving the Market Trend Filter on Rzone (even if you have filled it on momentify), it gives different result vs if you select the MIP-37 Test strategy on Rzone, open the Market Trend Filter tab, save it, and then simulate it. I know this sounds weird but I have tested it thrice now and it gives different results. @Abhi-Trader @Harshal-Chokhawala @Alpha-Trader @Rajendra-Manke . Let me know if the same works for you. @@Definedge-Experts Please check the same.
-
No. I haven't received any clarity from the DefineEdge team yet.