Understanding Multi-Chart Confluence
-
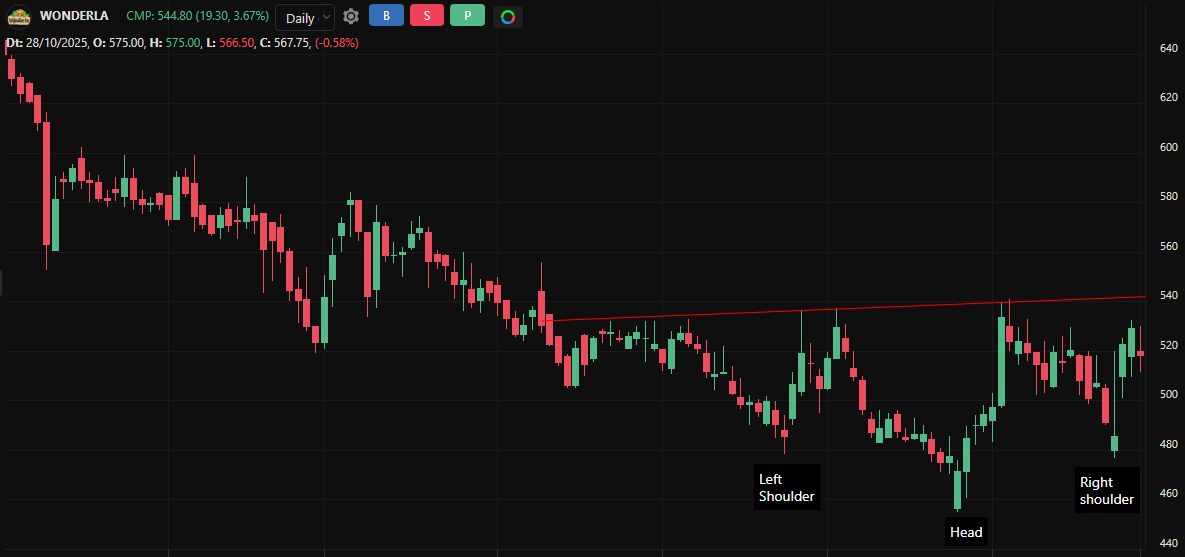
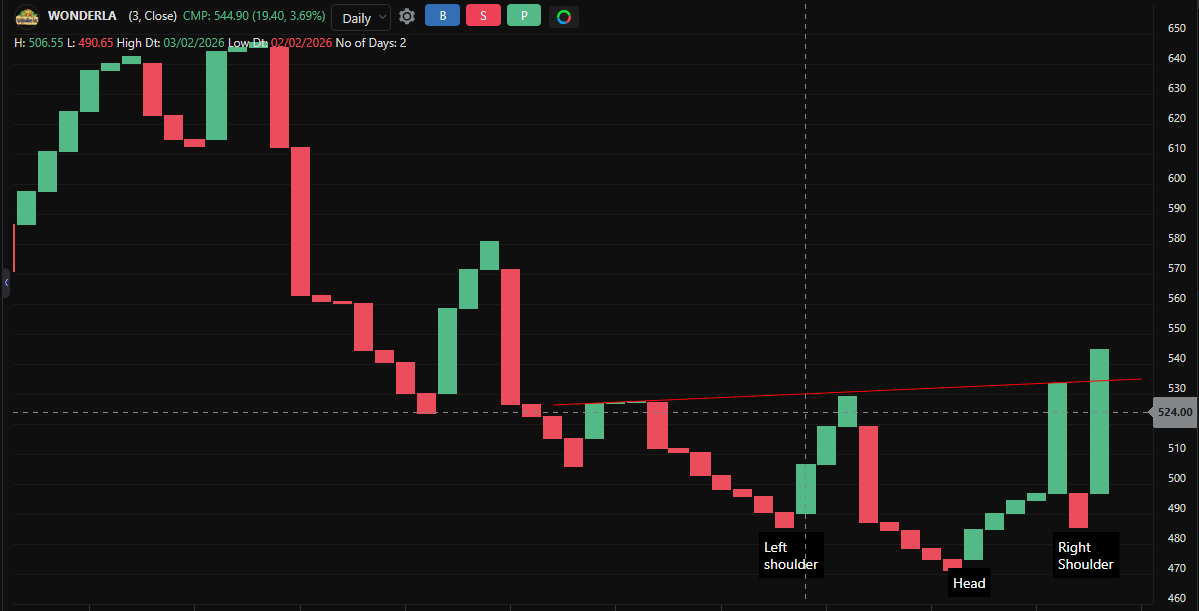
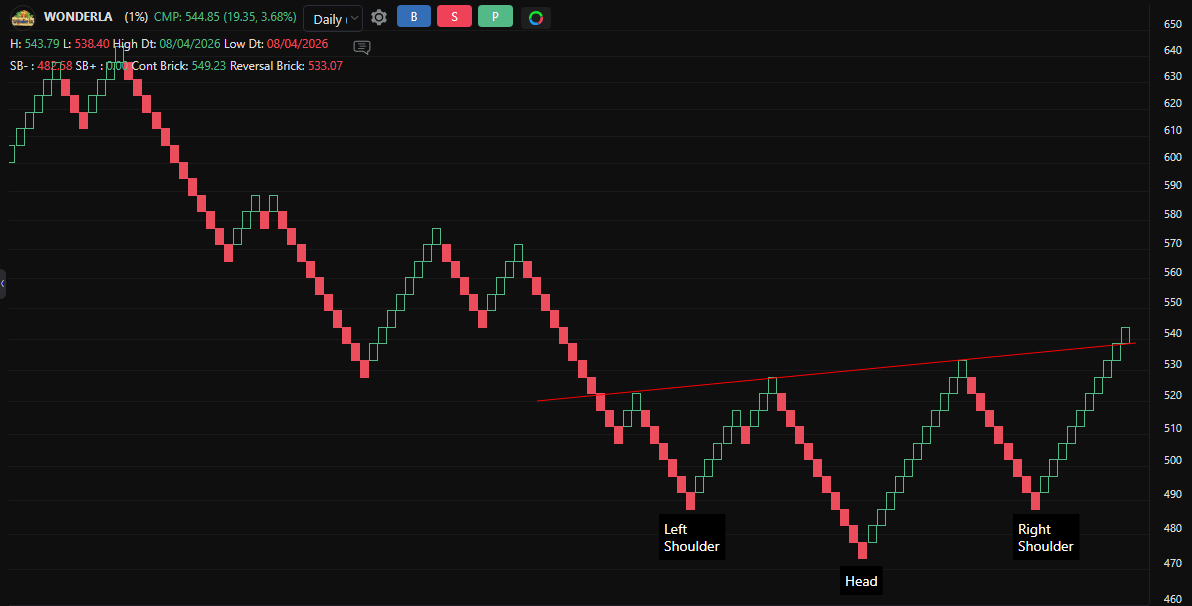
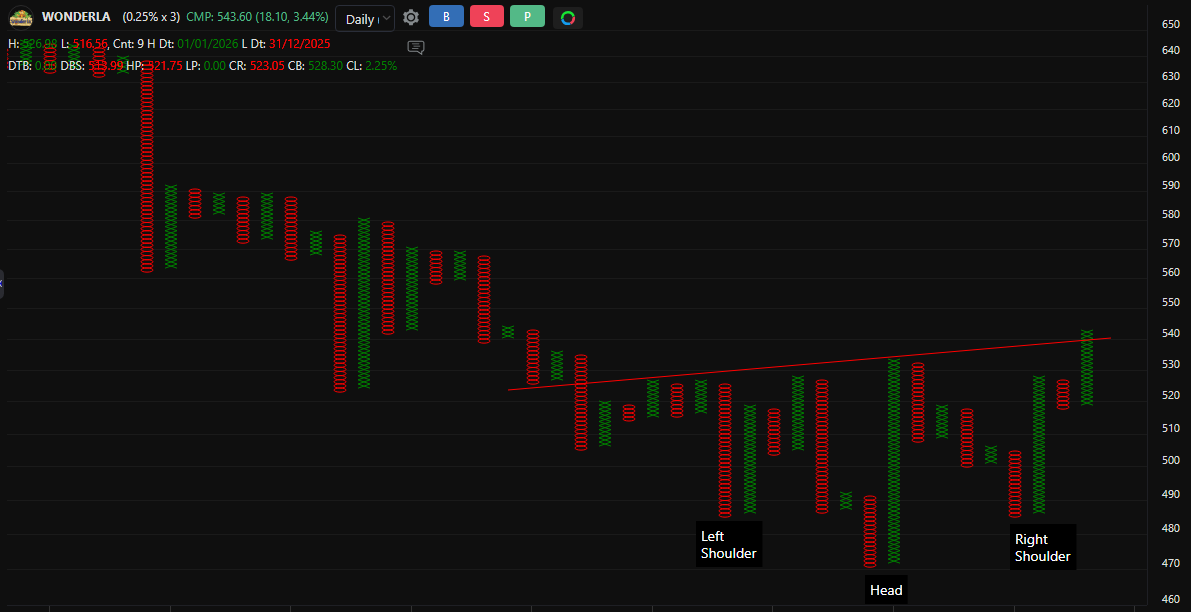
This comparison highlights how different charting methods Line Break, Point & Figure, Candlestick, and Renko can still reveal the same underlying market structure.
In this case, an Inverted Head & Shoulders pattern appears consistently across all four charts at a similar price level.
Despite differences in how price is plotted (time-based vs. price-based), the core price action remains the same.
 Nifty 500 (Broad Market) – Long-Term RSI Perspective