• Recent
  • Categories
  • 0 Unread 0
  • Popular
  • Tags
  • More
    • Guidelines
    • Disclaimer
  • Users
Skins
  • Light
  • Default
  • Cerulean
  • Cosmo
  • Flatly
  • Journal
  • Litera
  • Lumen
  • Lux
  • Materia
  • Minty
  • Morph
  • Pulse
  • Quartz
  • Sandstone
  • Simplex
  • Sketchy
  • Spacelab
  • United
  • Yeti
  • Zephyr
  • Dark
  • Cyborg
  • Darkly
  • Slate
  • Solar
  • Superhero
  • Vapor
Collapse
Definedge Forum Logo

P&F Analysis: Horizontal & Vertical Counts

Scheduled Pinned Locked Moved Charts
1 Posts 1 Posters 134 Views
    • Oldest to Newest
    • Newest to Oldest
    • Most Votes
Reply
  • Reply as topic
Log in to reply
This topic has been deleted. Only users with topic management privileges can see it.
  • N Offline
    N Offline
    Nishant Bhandari

    Pro User

    wrote on last edited by
    #1

    Re: Chart of the Day

    5315df20-9f69-4a6d-9bc7-d08acc8a04ef-image.png

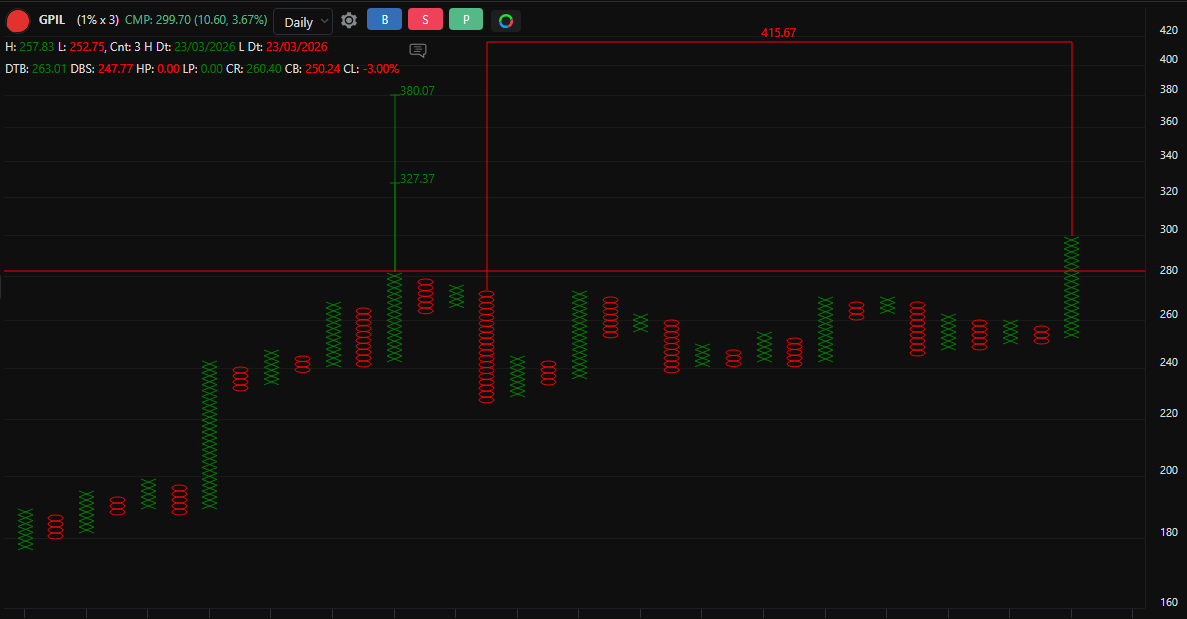
    The structure shows signs of base formation. Using Point & Figure (P&F) counts, the chart is analyzed through both horizontal and vertical methods. The vertical count helps in understanding the strength of the move, while the horizontal count reflects the extent of the base formation — together highlighting important price zones where activity can be observed. Overall, this approach helps in studying price structure in a simple way while staying flexible with how the price evolves.


    1 Reply Last reply
    1


Recent Posts

  • DefinedgeD
    Momentify Autobalance Buy
  • bbrijeshB
    Nifty - Bullish Counter Strike
  • P
    Lets follow the latest Trends
  • D
    Change in Number of Stocks in Portfolio
  • M
    Algostra
  • Login

  • Login or register to search.
  • Blog
  • Youtube Videos
  • Refresh
  • First post
    Last post
0
  • Recent
  • Categories
  • Unread 0
  • Popular
  • Tags
  • More
    • Guidelines
    • Disclaimer
  • Users
  • Login

  • Login or register to search.
  • Blog
  • Youtube Videos
  • Refresh