Shriram Finance: Relative Strength Breakout on Long-Term Charts
-
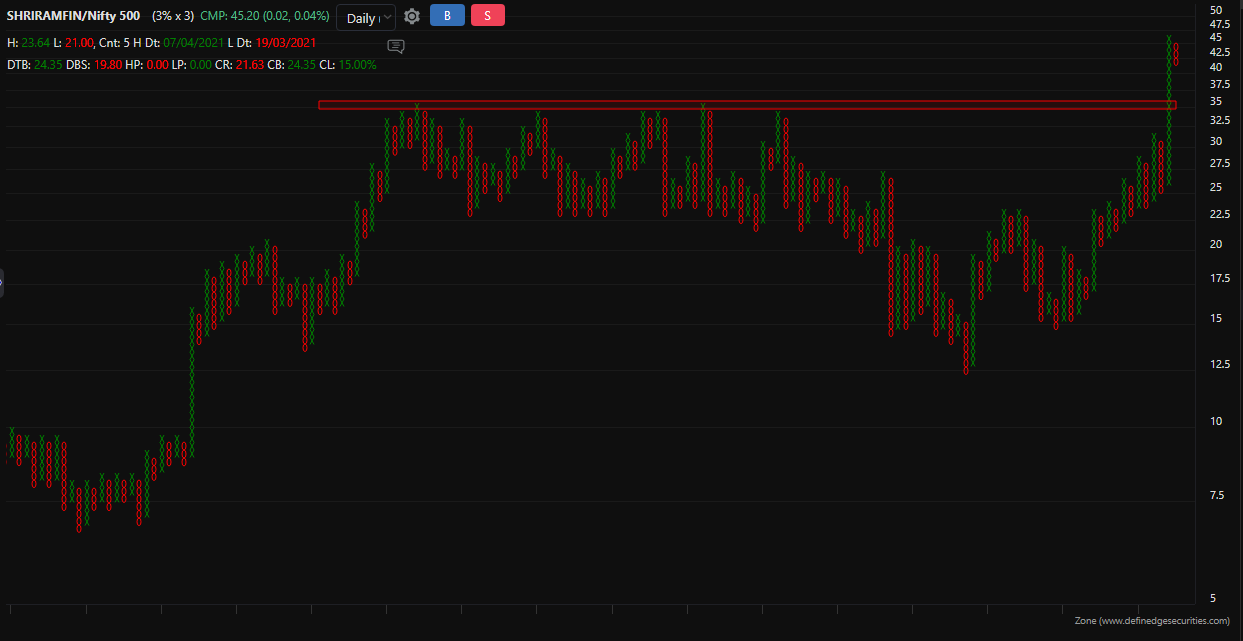
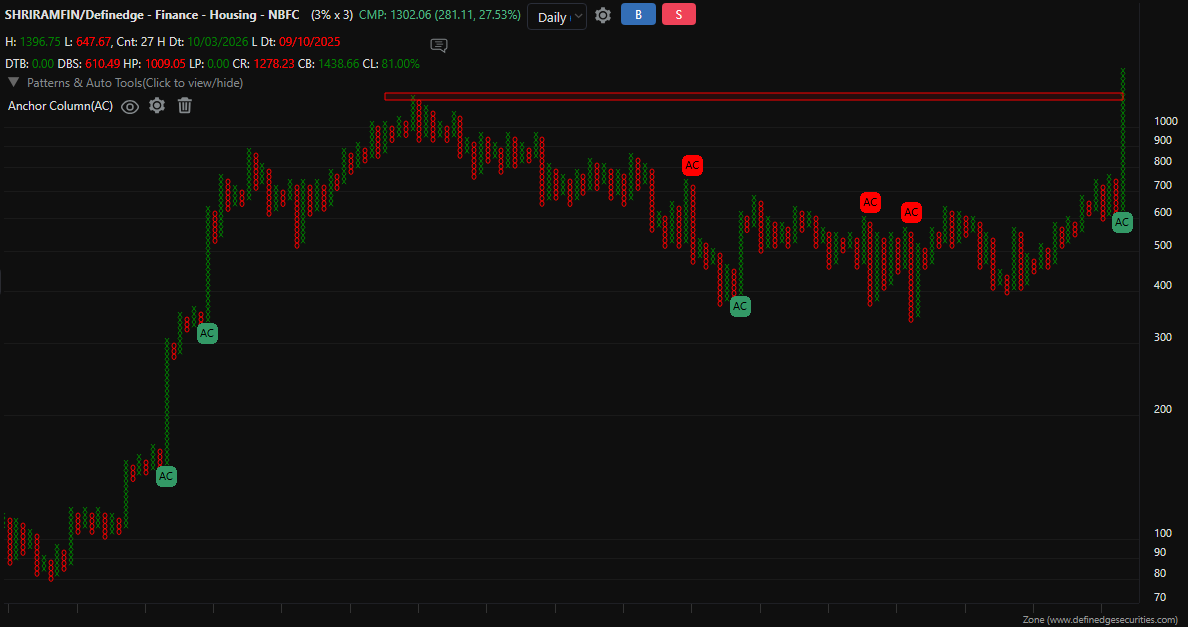
Sharing a view on Shriram Finance through Relative Strength (RS) Point & Figure charts.
Both ratios Shriram Finance vs Nifty 500 and Shriram Finance vs Definedge Finance, Housing, NBFC index are showing a breakout on the 3x3 P&F chart, which is generally considered a long-term structure.This indicates that the stock has been strengthening relative to both the broader market and its sector. At the same time, the current move looks a bit stretched, so some consolidation or retracement in the short term could be possible, while the broader structure remains intact.
If the breakout sustains, it may continue to reflect relative strength. However, if it fails and moves back into the previous zone, the stock could start moving more in line with the indices or may even underperform.
Just sharing an observation from the charts for discussion and learning purposes.