Chart of the Day - Man Industries Ltd
-
Stocks that rebound quickly after a market crash often signal underlying strength and have a higher probability of continuing their upward move.
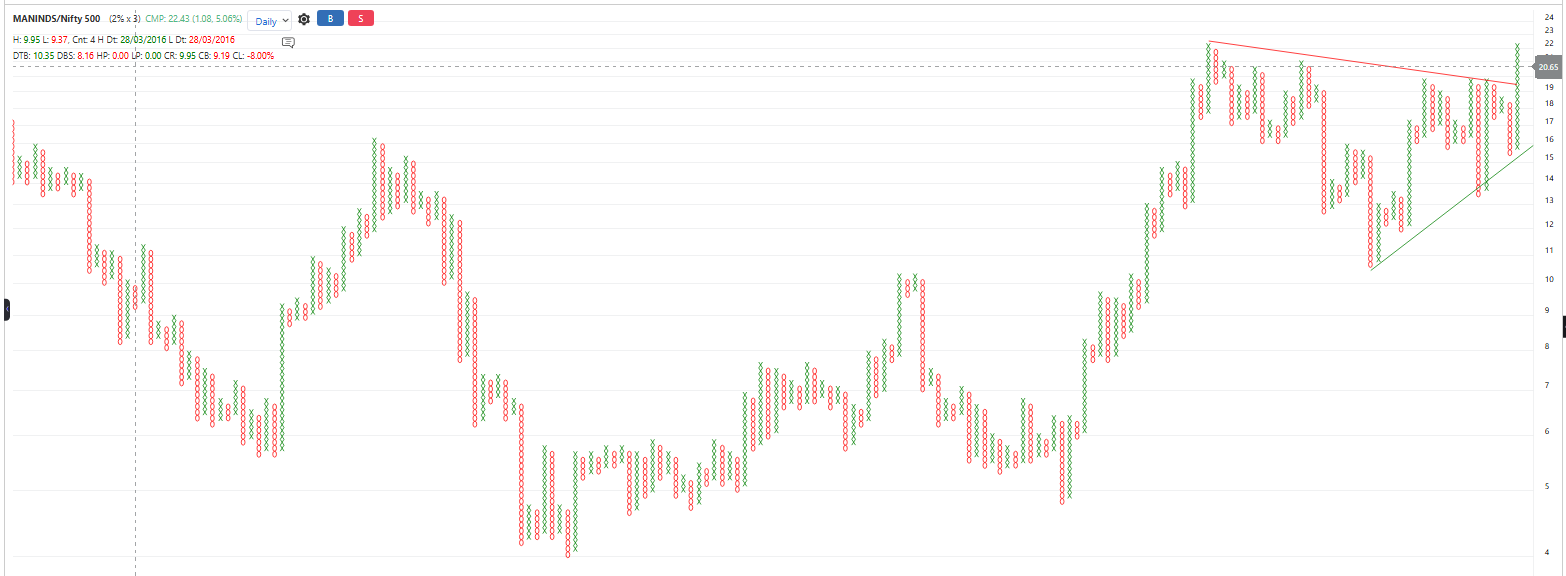
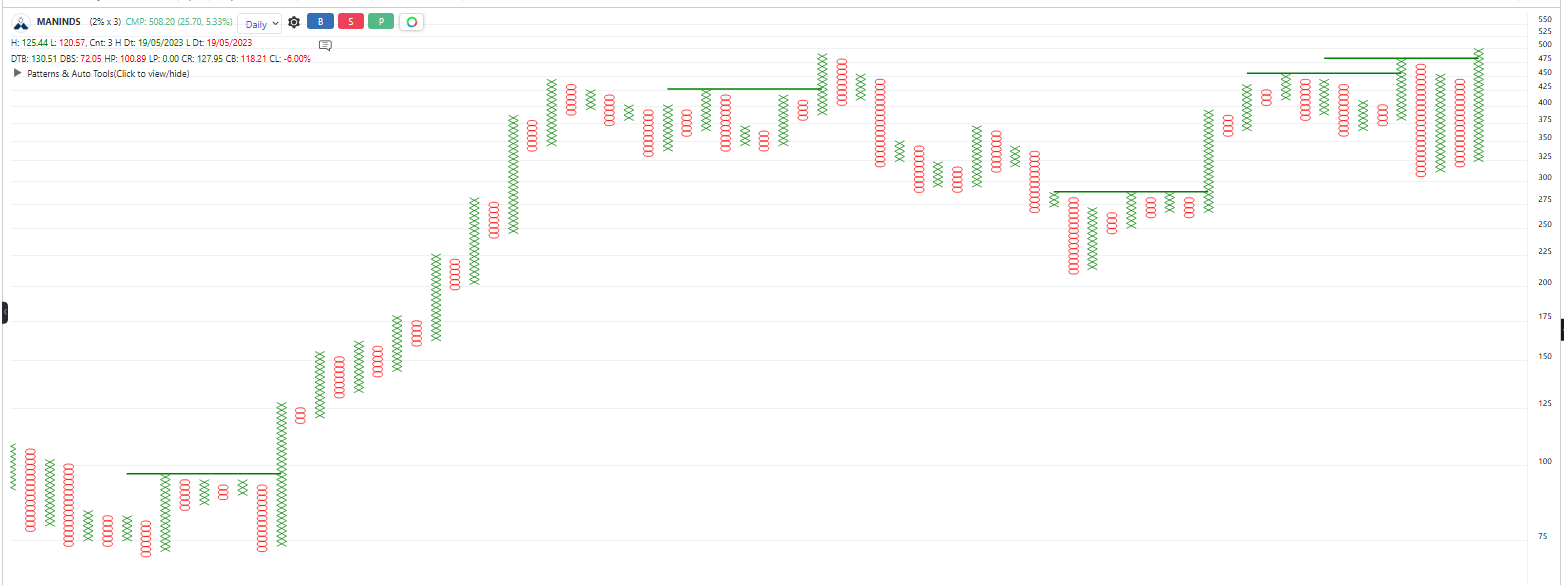
Man Industries, has rallied more than 30% following the recent market correction. Technically, the stock is forming an inverse head and shoulders pattern on the point-and-figure charts, indicating a potential trend reversal. In addition, it has delivered a breakout on its relative strength chart against the Nifty 500, suggesting clear outperformance versus the broader market.
Price Chart
RS Chart