• Recent
  • Categories
  • 0 Unread 0
  • Popular
  • Tags
  • More
    • Guidelines
    • Disclaimer
  • Users
Skins
  • Light
  • Default
  • Cerulean
  • Cosmo
  • Flatly
  • Journal
  • Litera
  • Lumen
  • Lux
  • Materia
  • Minty
  • Morph
  • Pulse
  • Quartz
  • Sandstone
  • Simplex
  • Sketchy
  • Spacelab
  • United
  • Yeti
  • Zephyr
  • Dark
  • Cyborg
  • Darkly
  • Slate
  • Solar
  • Superhero
  • Vapor
Collapse
Definedge Forum Logo

is this a genuine reversal or just a trap?

Scheduled Pinned Locked Moved Charts
1 Posts 1 Posters 22 Views
    • Oldest to Newest
    • Newest to Oldest
    • Most Votes
Reply
  • Reply as topic
Log in to reply
This topic has been deleted. Only users with topic management privileges can see it.
  • B Offline
    B Offline
    Bhaumil Makwana
    wrote on last edited by
    #1

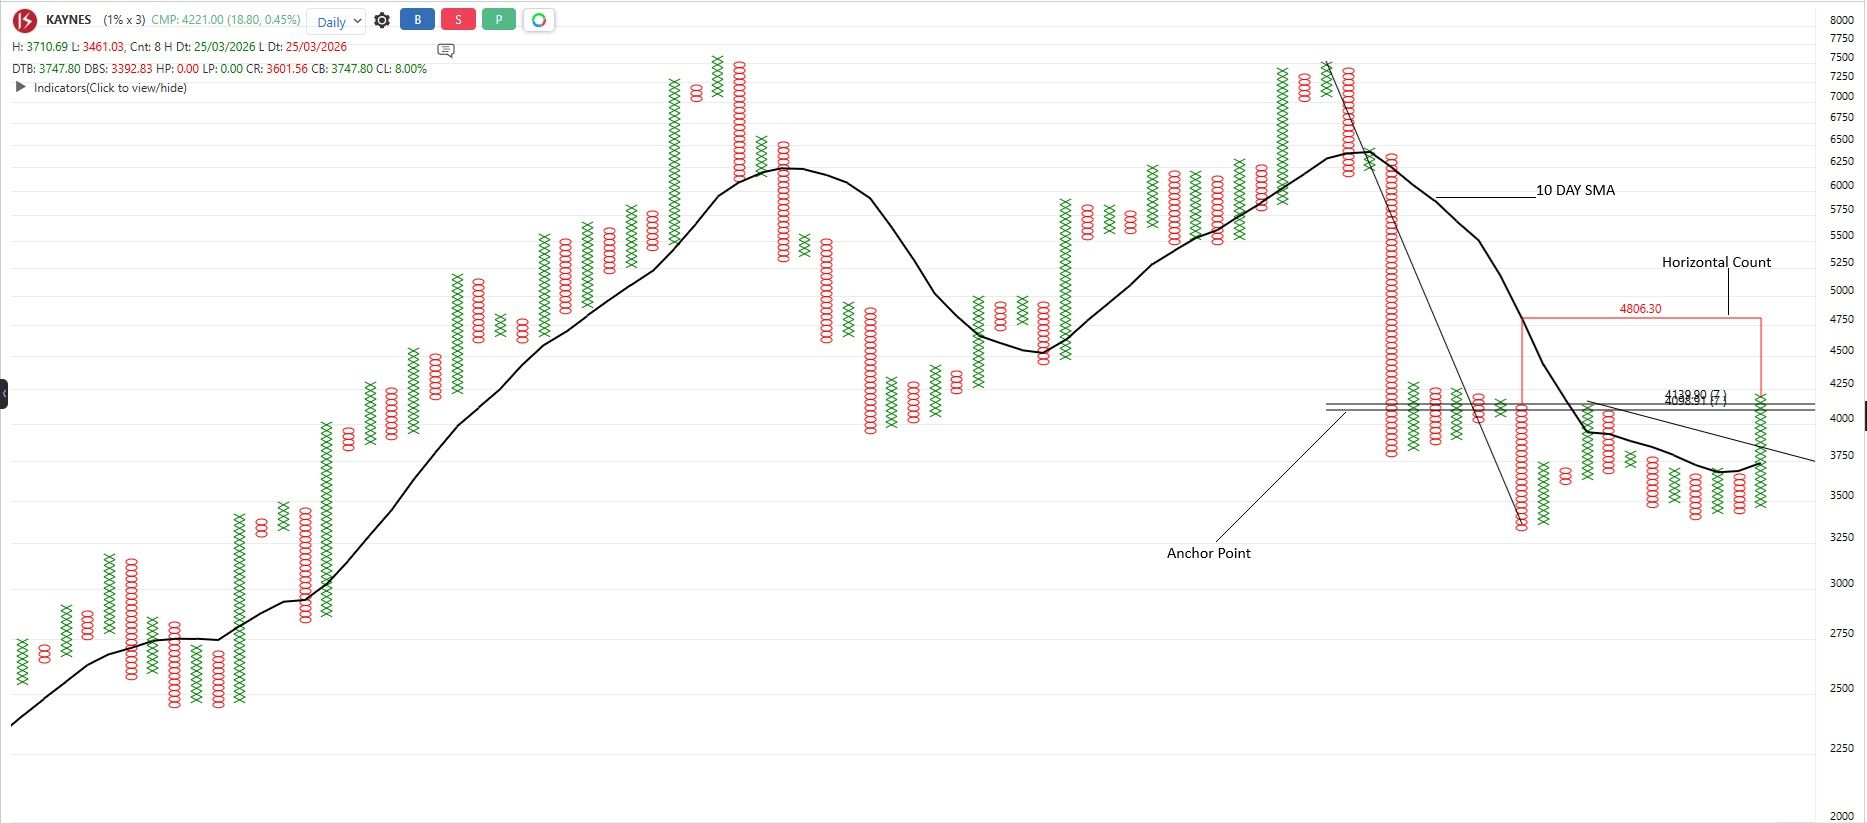
    Anchor point is an area where price has traded the most between a significant top and bottom. It is plotted using major swing high and low to identify where most of the action happened during the move. These zones often act as important reference areas when price revisits.

    Right now, KAYNES is approaching that anchor zone. However, the recent formation of a bullish anchor column suggests buyers are stepping back in, which is a constructive sign for the ongoing trend. At the same time, price is holding above the 10-column simple moving average, keeping the short-term structure positive.

    Also, Horizontal counts come into play when a sideways base forms before a breakout, helping estimate the potential move once the structure resolves.

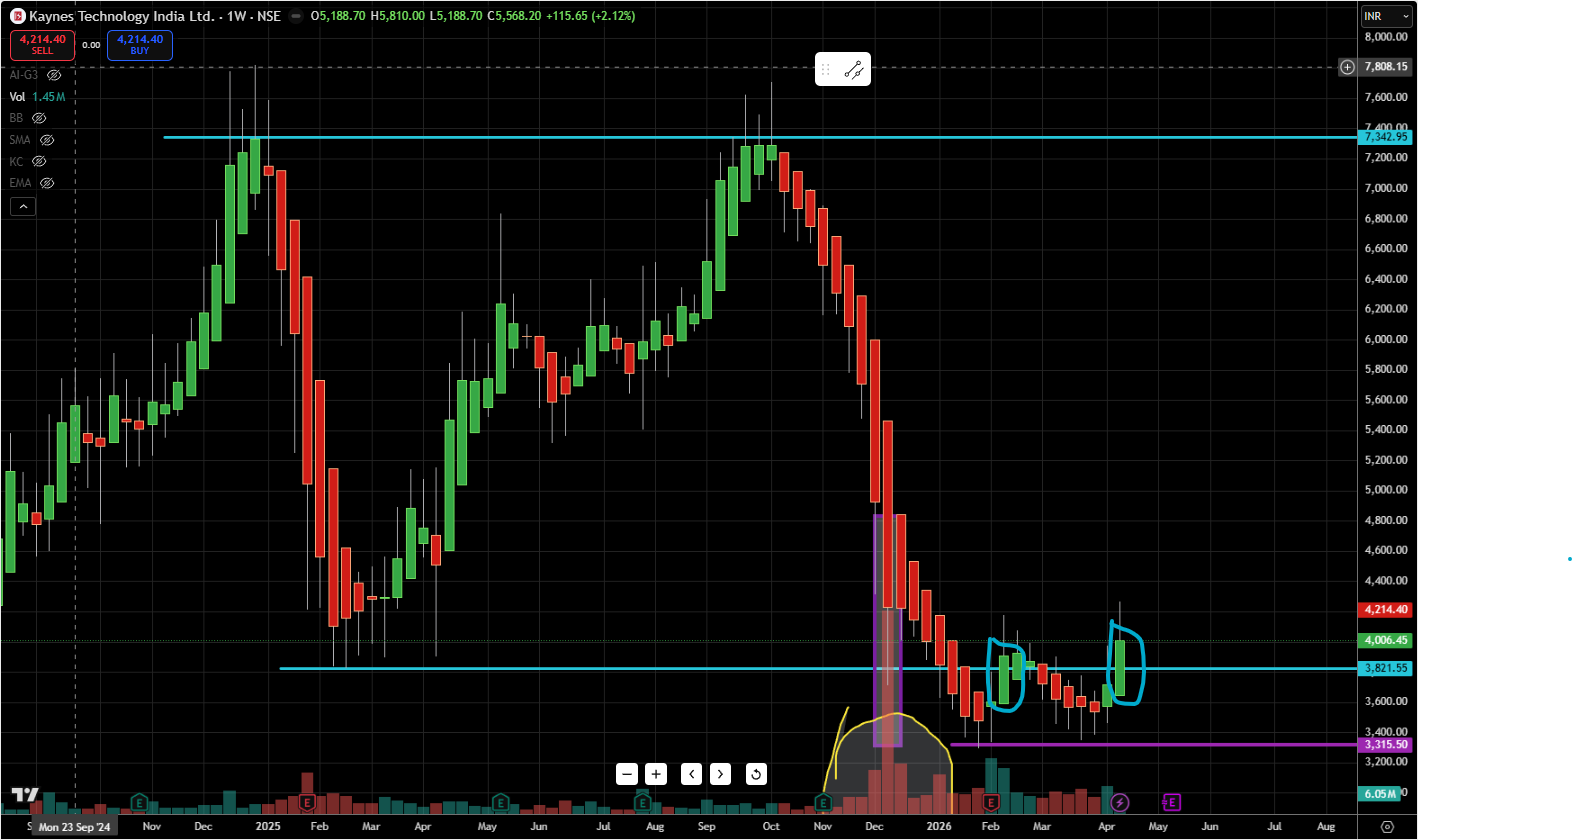
    Failure near anchor - possible bull trap
    Holding + breakout - continuation setup
    We are at a decision point here price could go either way. What’s your take?

    Just sharing an observation from the charts for discussion and learning purposes.
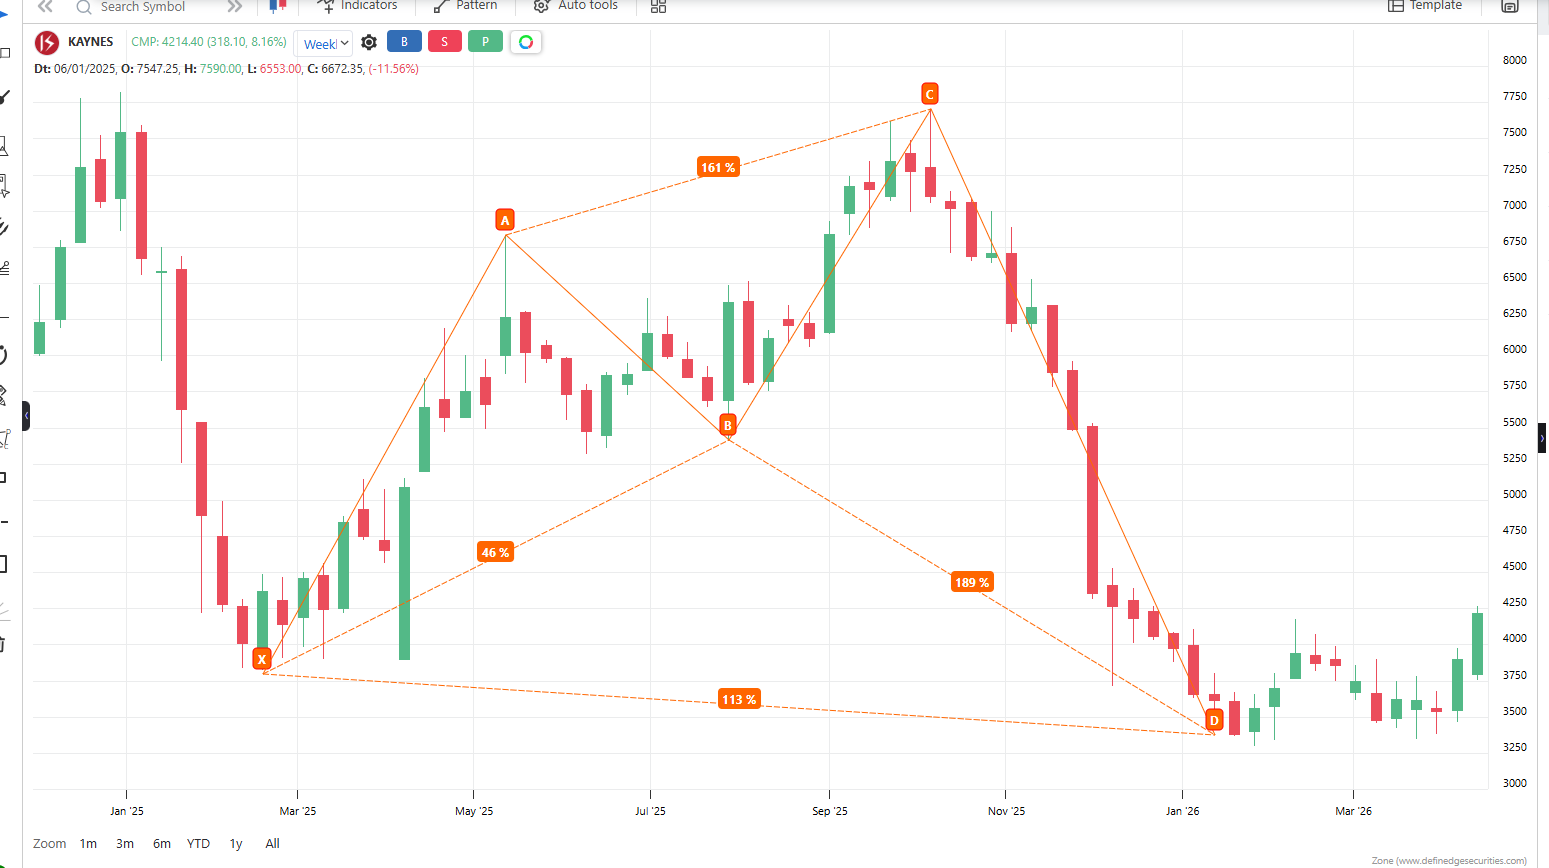
    kaynes.jpg

    1 Reply Last reply
    0


Recent Posts

  • N
    Finding recent High RS IPO Stocks
  • B
    is this a genuine reversal or just a trap?
  • S
    Chart of the Day - Man Industries Ltd
  • N
    Shriram Finance: Relative Strength Breakout on Long-Term Charts
  • M
    MOMENTIFY- NEED CLARITY
  • Login

  • Login or register to search.
  • Blog
  • Youtube Videos
  • Refresh
  • First post
    Last post
0
  • Recent
  • Categories
  • Unread 0
  • Popular
  • Tags
  • More
    • Guidelines
    • Disclaimer
  • Users
  • Login

  • Login or register to search.
  • Blog
  • Youtube Videos
  • Refresh