Retracement or Trend Reversal?
-
MTAR TECH has had an incredible run. After making a low of ₹1,155.60 on 7 April 2025, it rallied all the way to ₹8,449.50, delivering more than 600% returns in a little over a year.
Now, the chart is starting to look interesting.
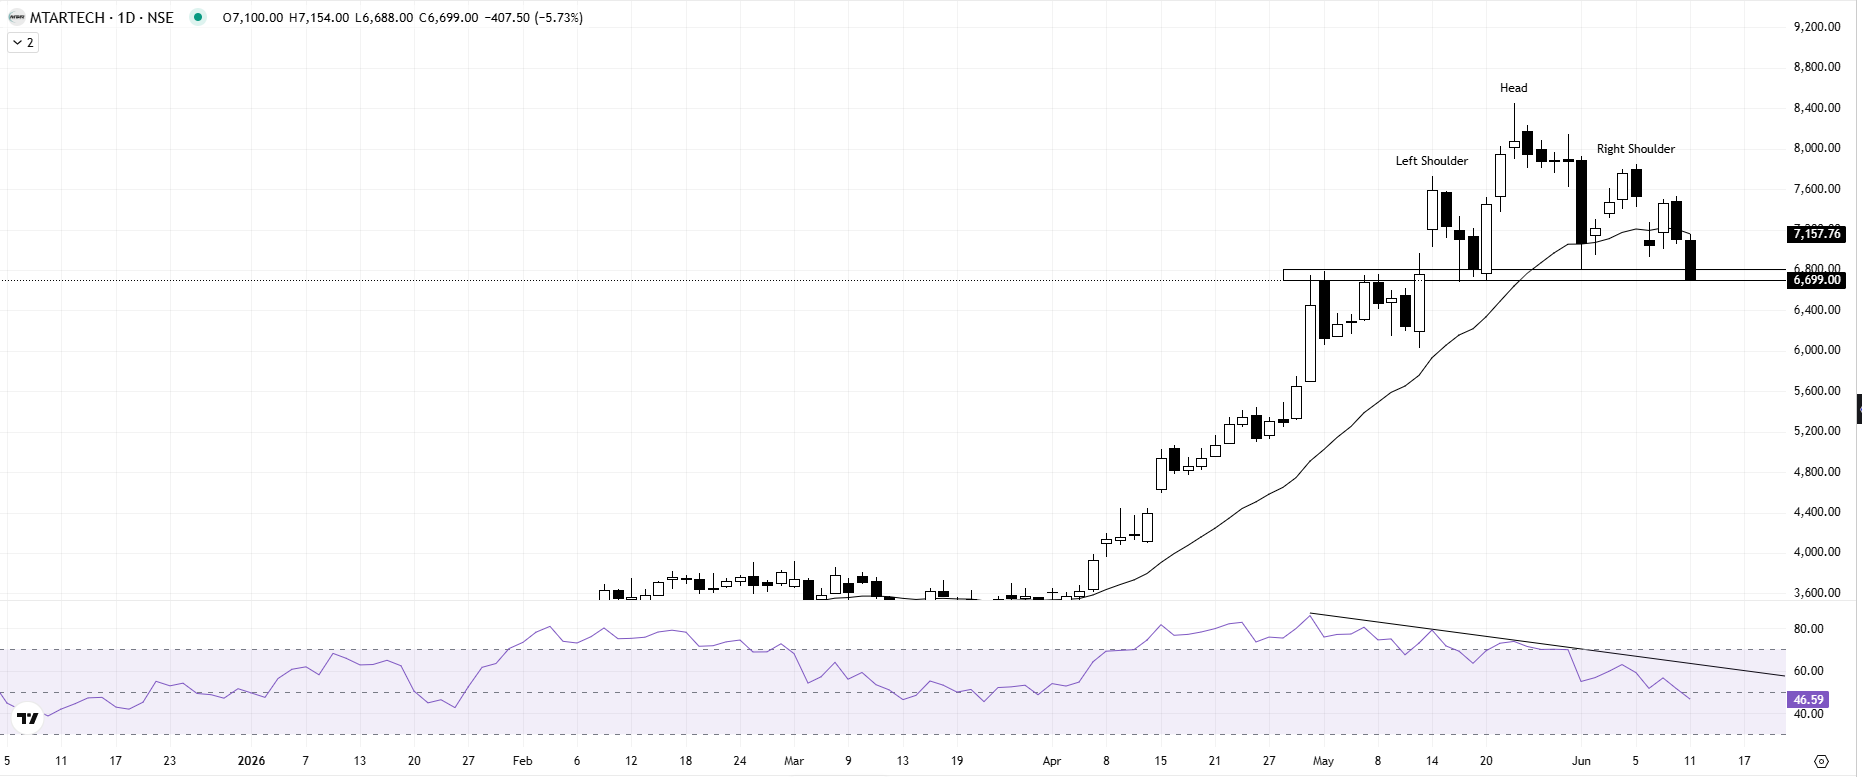
On the daily timeframe, a potential Head & Shoulders pattern is taking shape. The stock is trading below its 20 EMA, and the RSI is showing negative divergence, suggesting that the momentum behind the uptrend has started to cool off.
The neckline is the key level to watch. If the stock manages to sustain below it, the Head & Shoulders pattern could come into play and may indicate a deeper correction.
At the same time, it's worth remembering that after a 600%+ rally, some profit booking and consolidation are completely normal. Strong trends rarely move up in a straight line forever.
So the big question is: Is this just a healthy pullback within a larger uptrend, or the start of a bigger trend reversal?