• Recent
  • Categories
  • 0 Unread 0
  • Popular
  • Tags
  • More
    • Guidelines
    • Disclaimer
  • Users
Skins
  • Light
  • Default
  • Cerulean
  • Cosmo
  • Flatly
  • Journal
  • Litera
  • Lumen
  • Lux
  • Materia
  • Minty
  • Morph
  • Pulse
  • Quartz
  • Sandstone
  • Simplex
  • Sketchy
  • Spacelab
  • United
  • Yeti
  • Zephyr
  • Dark
  • Cyborg
  • Darkly
  • Slate
  • Solar
  • Superhero
  • Vapor
Collapse
Definedge Forum Logo

TCS SHOWING STRENGTH

Scheduled Pinned Locked Moved Charts
1 Posts 1 Posters 55 Views
    • Oldest to Newest
    • Newest to Oldest
    • Most Votes
Reply
  • Reply as topic
Log in to reply
This topic has been deleted. Only users with topic management privileges can see it.
  • G Offline
    G Offline
    ASHISH SHAH
    wrote on last edited by
    #1

    TCS-0.25.png TCS-0.50.png TCS-1.png

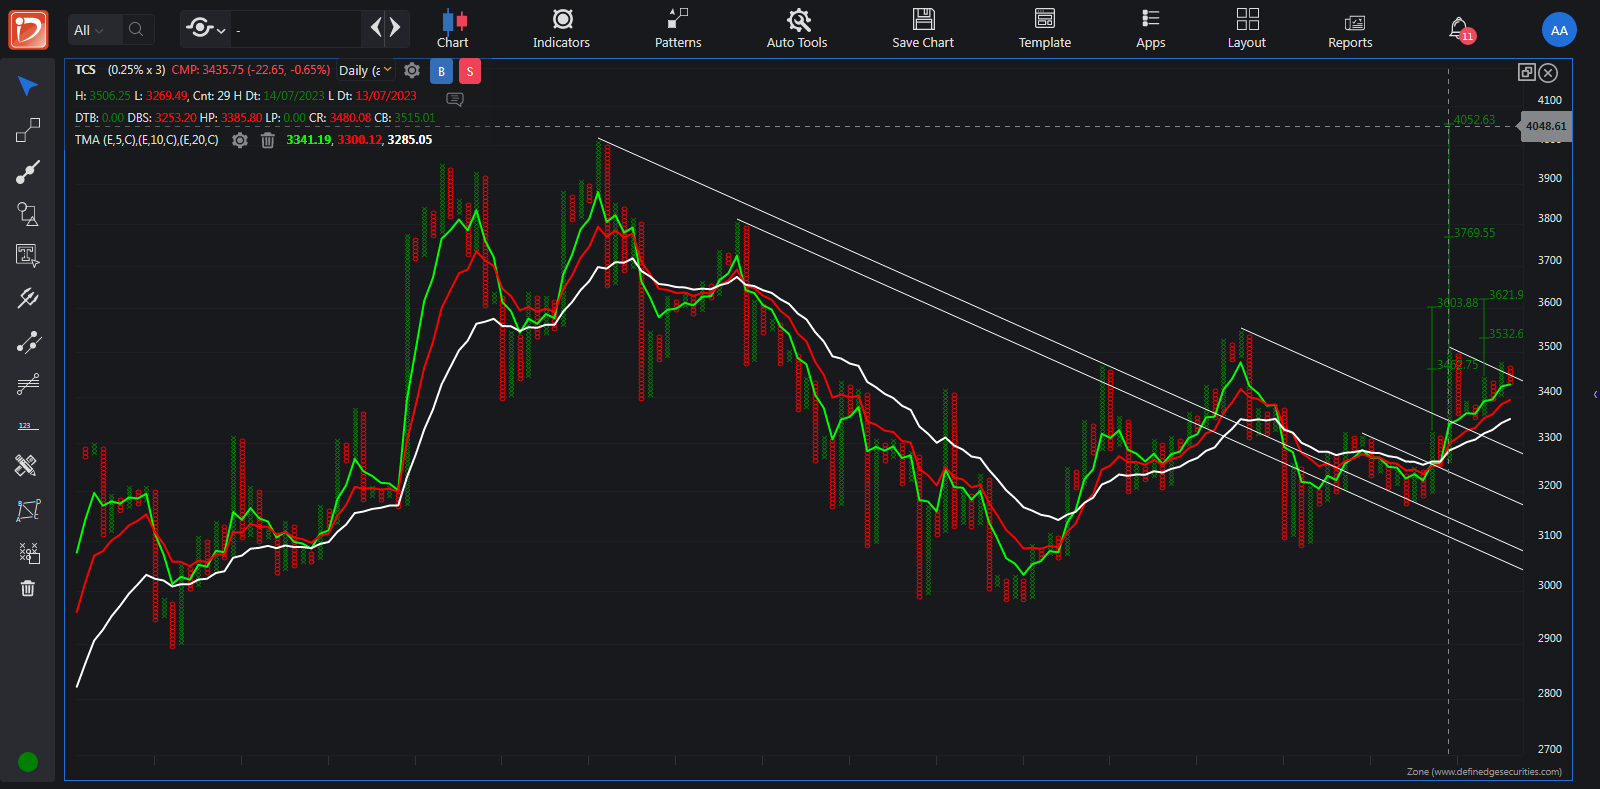
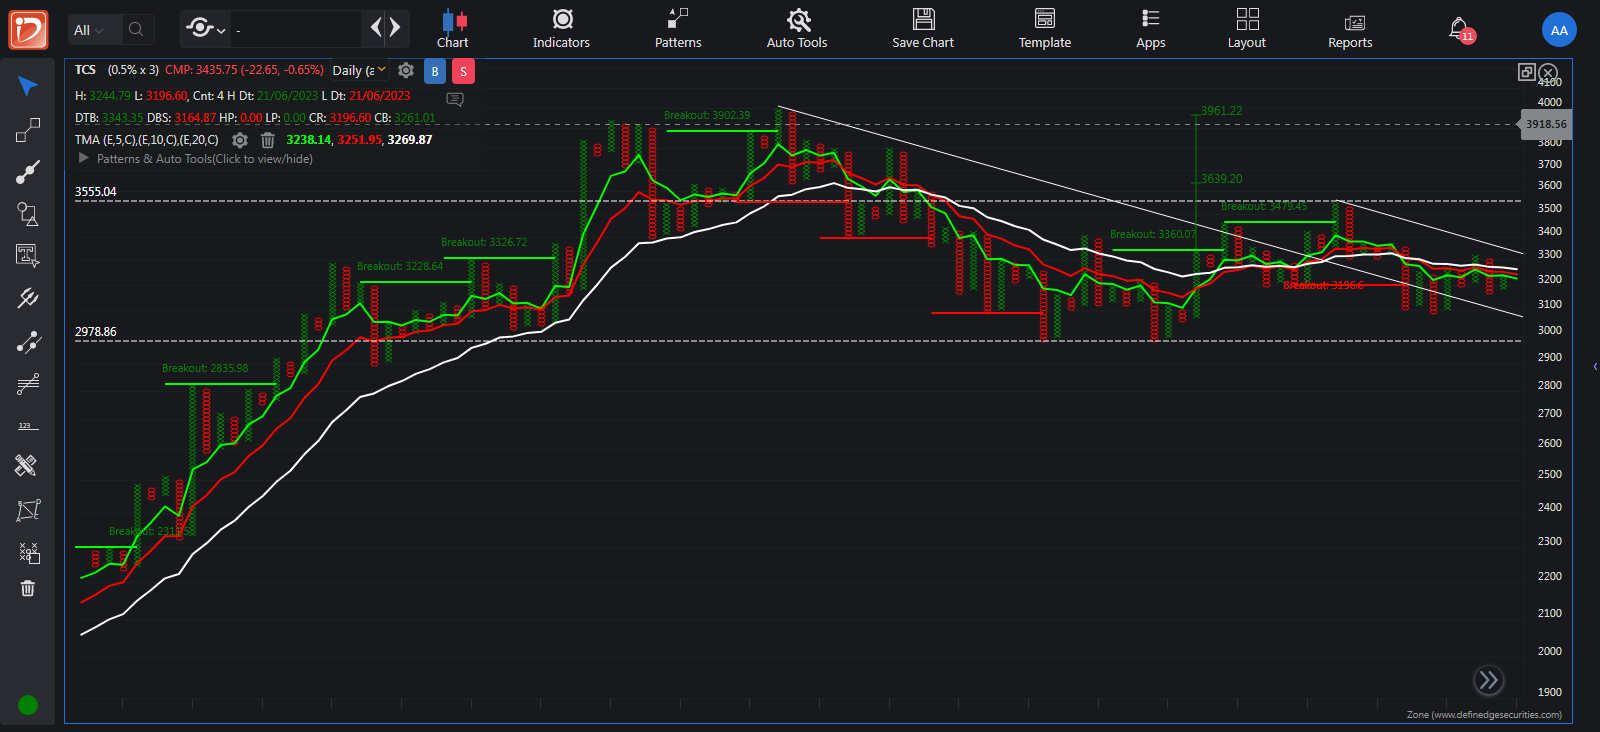
    YOU CAN SEE PRICE IS ABOVE 45 DEGREE TREND LINE.
    PRICE IS ALSO ABOVE TRIPLE MOVING AVERAGE.
    IF YOU CAN NOTICE THEN PREVIOUSLY MOVING AVERAGE WAS BETWEEN THE PRICE.

    1 Reply Last reply
    1


Recent Posts

  • V
    How to set Templet in Chart after scanner done for stocks
  • B
    Swing breakout pattern in candlestick chart.
  • R
    Master Momentum Trading
  • M
    Intraday Momentum Strategy
  • A
    Volar score definition
  • Login

  • Login or register to search.
  • Blog
  • Youtube Videos
  • Refresh
  • First post
    Last post
0
  • Recent
  • Categories
  • Unread 0
  • Popular
  • Tags
  • More
    • Guidelines
    • Disclaimer
  • Users
  • Login

  • Login or register to search.
  • Blog
  • Youtube Videos
  • Refresh