• Recent
  • Categories
  • 0 Unread 0
  • Popular
  • Tags
  • More
    • Guidelines
    • Disclaimer
  • Users
Skins
  • Light
  • Default
  • Cerulean
  • Cosmo
  • Flatly
  • Journal
  • Litera
  • Lumen
  • Lux
  • Materia
  • Minty
  • Morph
  • Pulse
  • Quartz
  • Sandstone
  • Simplex
  • Sketchy
  • Spacelab
  • United
  • Yeti
  • Zephyr
  • Dark
  • Cyborg
  • Darkly
  • Slate
  • Solar
  • Superhero
  • Vapor
Collapse
Definedge Forum Logo
D

Dhrumil Dhameliya

Pro User

About
Topics
10
Replies
14
Groups
1
Followers
0
Following
2

All Replies

Recent Best Controversial

    Today's trading session percentage change of stock along with LTP in holdings tab inside Zone mobile app
  • D Dhrumil Dhameliya

    Hello,

    Please include today's trading session percentage change of stock in the holdings tab along with the Last Traded Price (LTP). Currently, the app only shows the LTP price. If the percentage change is included, it would be easier to identify which stock has performed better in today's session in terms of percentage.
    Thanks

    WhatsApp Image 2023-11-09 at 12.16.33 PM.jpeg


  • Tradepoint Backtesting have not option such as, Pre, My, Public, and Popular to select strategies from already made strategies like Rzone
  • D Dhrumil Dhameliya

    Hello @Prashant-Shah @Definedge @@Definedge-Experts @Kaushik-Akiwatkar

    In RZone backtesting, we have the option to choose an entry (long/short) strategy from Pre, My, Public, and Popular same for the exit criteria. However, on the Tradepoint desktop, when I attempted the same process, I did not find those options.

    Please take a look at the attached screenshot for reference.
    please help
    Screenshot 2023-10-28 at 6.02.20 PM.png Screenshot 2023-10-28 at 6.02.48 PM.png


  • System Builder => PNF => Add Conditions => Different Conditions on RZone web and Tradepoint for PNF Chart listed under pattern section
  • D Dhrumil Dhameliya

    Just like positive column reversal option, "More Than No of Boxes" Option is missing in Tradepoint
    There could be many conditions available in Rzone but not available in Tradepoint and Viceversa
    Screenshot 2023-10-28 at 2.15.20 PM.png Screenshot 2023-10-28 at 2.14.48 PM.png


  • System Builder => PNF => Add Conditions => Different Conditions on RZone web and Tradepoint for PNF Chart listed under pattern section
  • D Dhrumil Dhameliya

    Please have a look at attacehd screenshotScreenshot 2023-10-28 at 12.55.15 PM.png Screenshot 2023-10-28 at 12.54.35 PM.png


  • System Builder => PNF => Add Conditions => Different Conditions on RZone web and Tradepoint for PNF Chart listed under pattern section
  • D Dhrumil Dhameliya

    Hello @Prashant-Shah @Definedge @@Definedge-Experts ,

    I have noticed some discrepancies in the pattern conditions listed for the PNF System builder. When I search for "Positive column reversal," I am able to find this condition on RZone. However, when I tried to find a similar condition on Tradepoint software, I could not locate the "positive column reversal."

    I mentioned "Positive column reversal" just as an example, but I have observed that the conditions to add for PNF Chart, listed under the pattern section, differ from those in Tradepoint software.

    I have observed these differences for conditions on PNF Charts since I practice PNF Charts. This may also be true for conditions listed for other charting methods, though I can't say for certain. However, conditions should ideally be the same for both RZone and Tradepoint to maintain uniformity.


  • System Builder => Relative Strength of a stock against Nifty 50 is not available in Indicator listing
  • D Dhrumil Dhameliya

    System of turtle quants works very well on weekly charts and they have shown backtesting results in the video i provided. @Prashant-Shah Sir you are an expert and you will know efficiency of this system if you watch the video so please watch it if possible. i think this system is very good for people who just wants to do investing since system is based on Relative strength of stock on weekly charts. they even have provided smallcase (https://turtlequants.smallcase.com/) for this system.
    Thank you for the reply @Prashant-Shah Sir


  • How to find stocks that have outperformed the Nifty 50 since a specific date?
  • D Dhrumil Dhameliya

    Hello @Prashant-Shah @Krishna-Kumar @Kaushik-Akiwatkar @Prasiddh-Shroff @Raju-Ranjan @Definedge @Definedge , I hope you are all doing well.

    How to determine which stocks have outperformed the Nifty 50 since a specific date. The reason for this inquiry is my desire to identify stocks that have performed better since the Nifty 50 began its correction on September 15th.

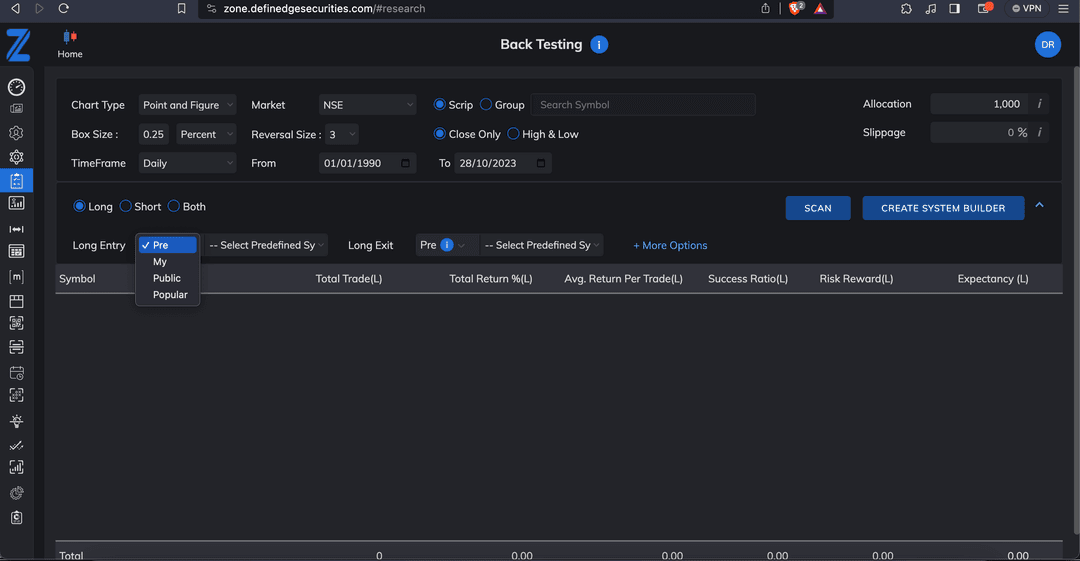
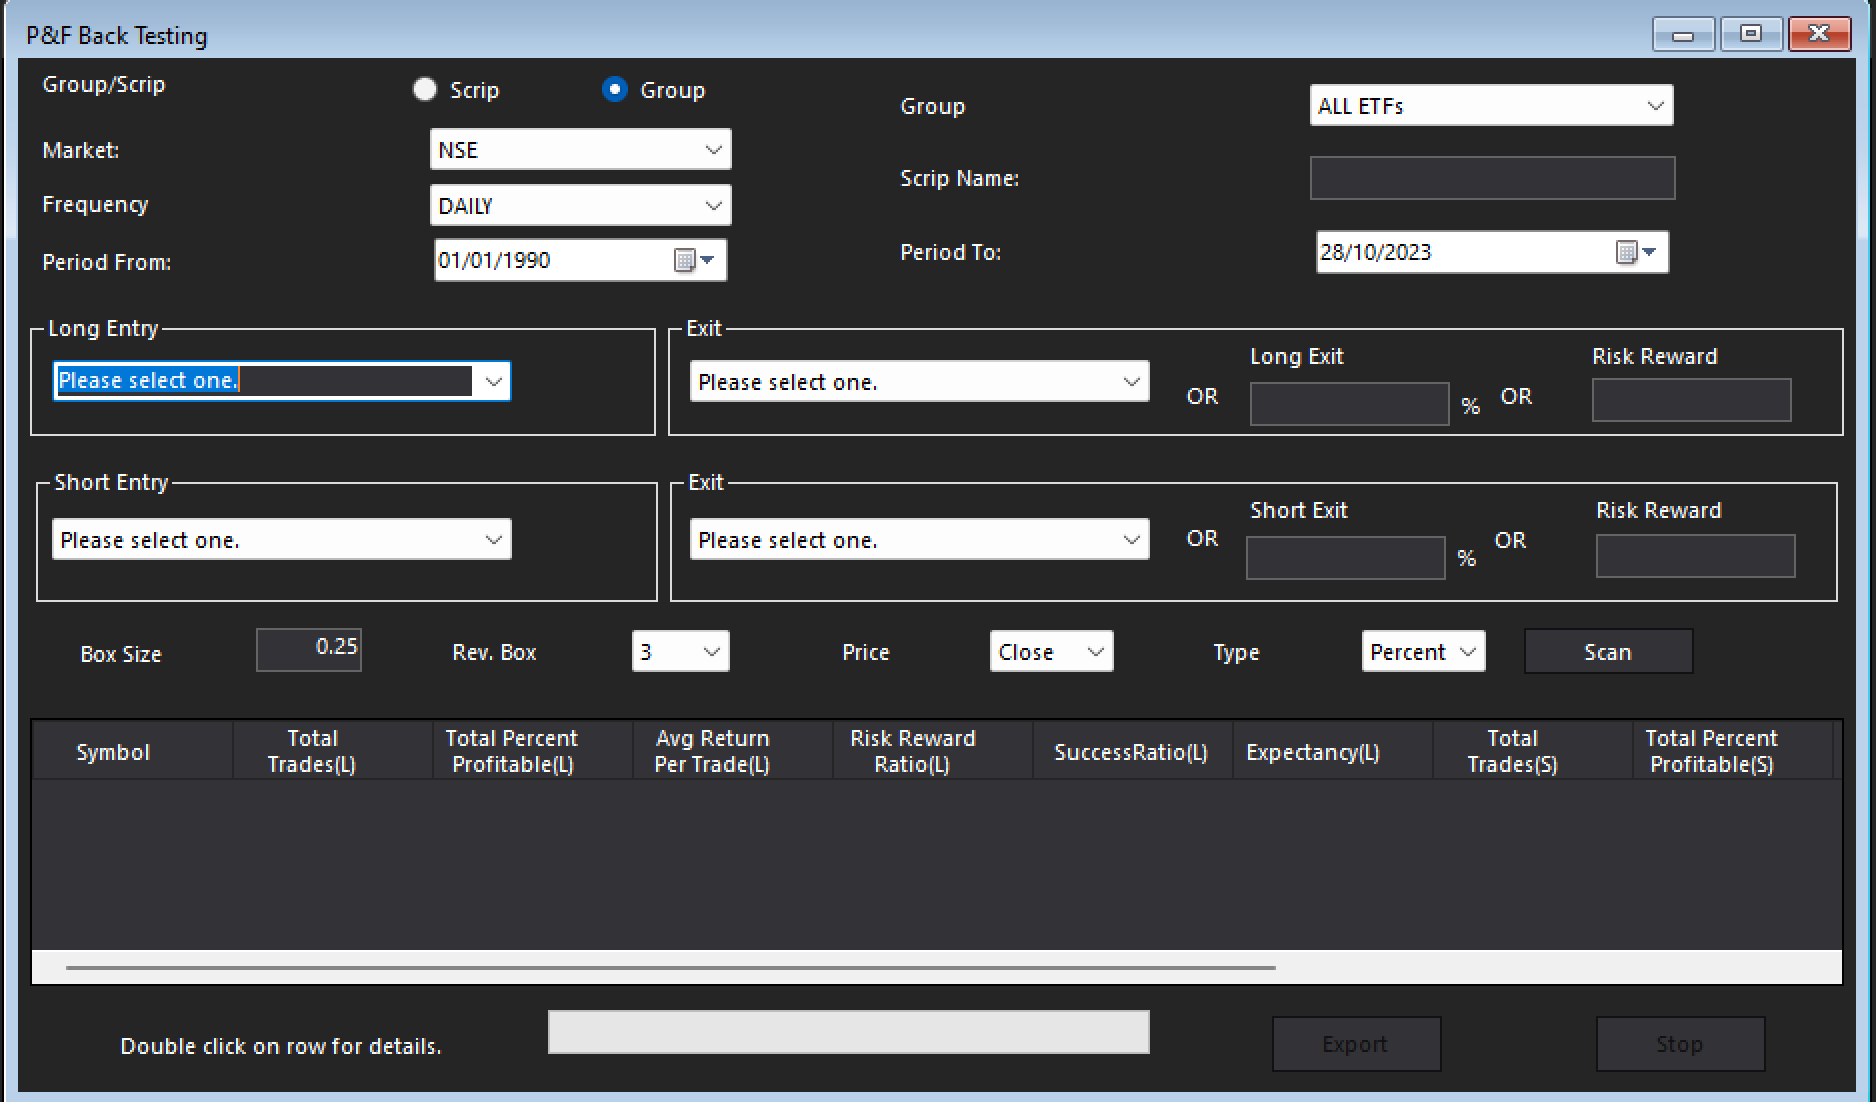
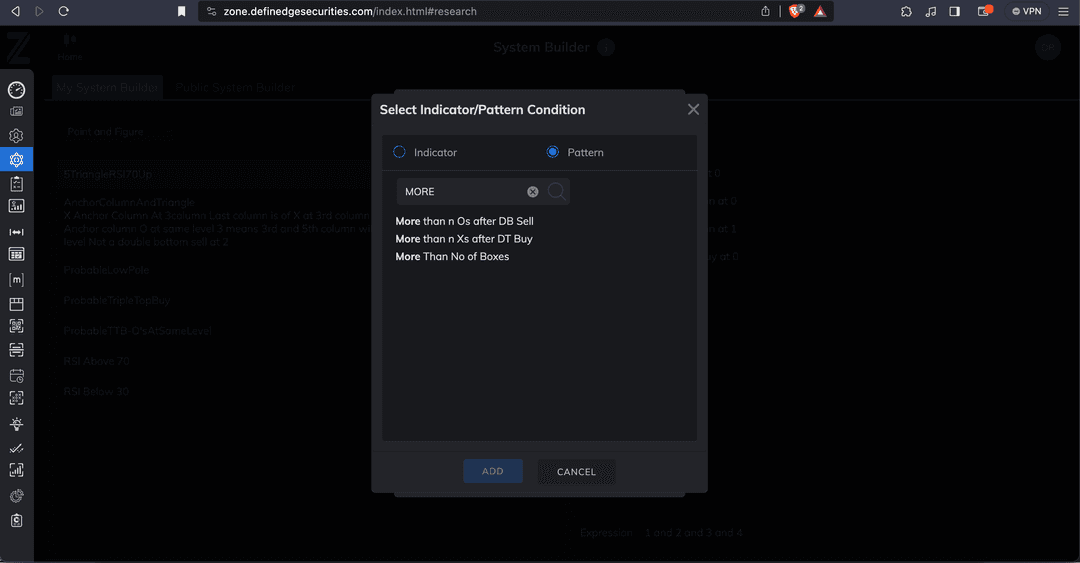
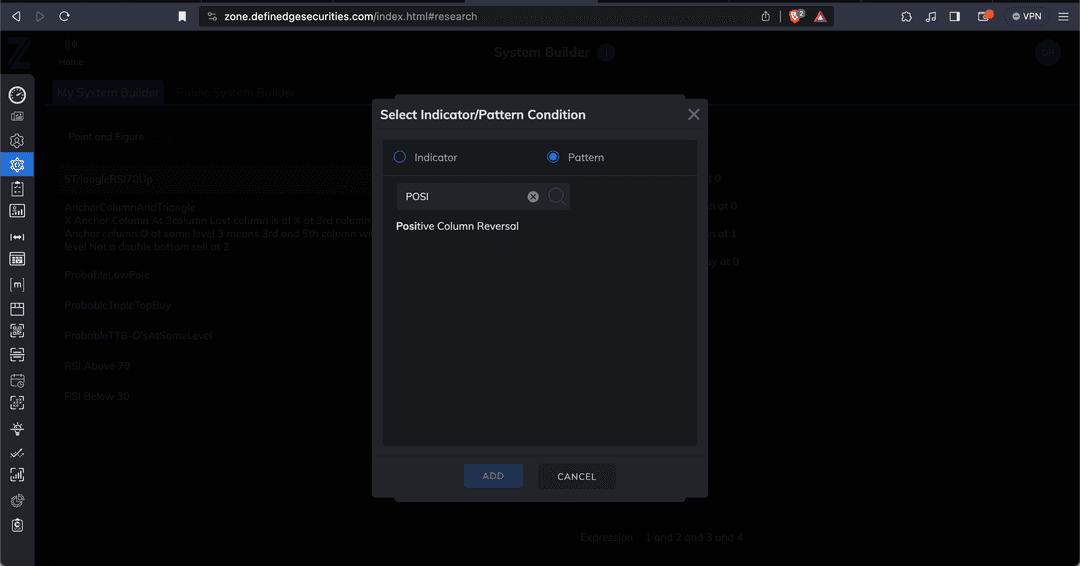
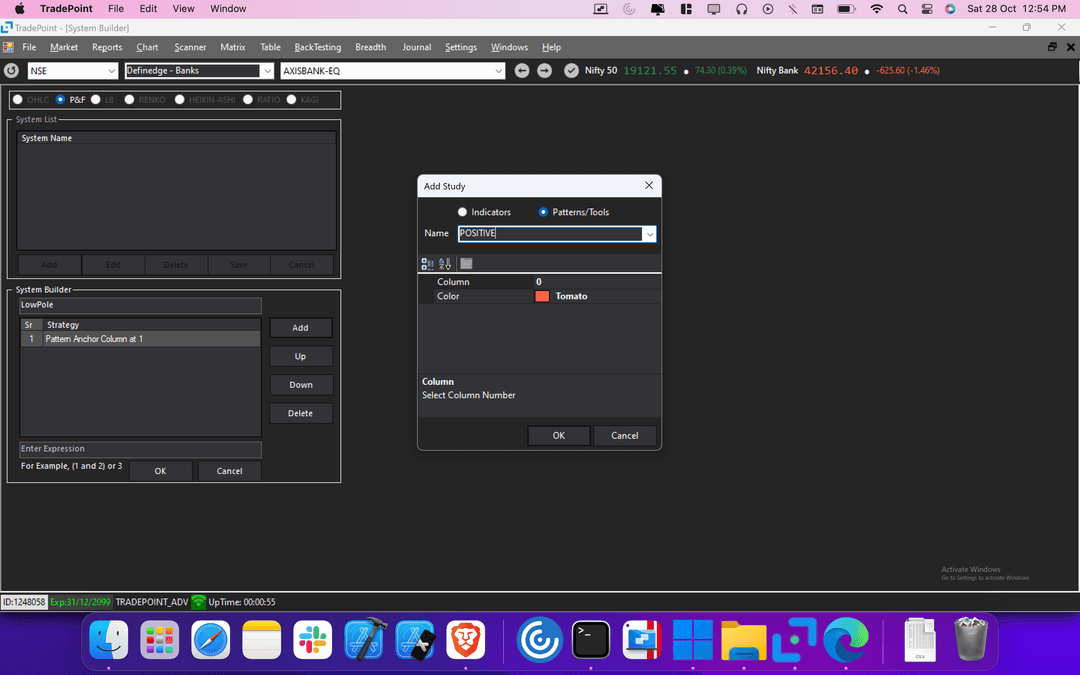
    I attempted to use RS Scanners, but it appears that most of these scanners are designed for PNF charts. For the OHLC RS Scanner in RZone, it requires a look-back period instead of allowing users to input a specific date. It would be highly beneficial for RZone users who are utilizing the OHLC RS Scanner if they could specify a particular date and find potential candidates since the entered date, rather than relying on a look-back period.

    In short, if we are reviewing the Nifty 50 chart at any given time and we conclude that the market is undergoing a correction, and someone wishes to identify stocks that have performed well since the correction began on a particular date, how can one locate these stocks using the OHLC RS Scanner or any other RS Scanners available on RZone? Thank you.


  • System Builder => Relative Strength of a stock against Nifty 50 is not available in Indicator listing
  • D Dhrumil Dhameliya

    @Prashant-Shah @Raju-Ranjan @Krishna-Kumar @AP @Kaushik-Akiwatkar @Prasiddh-Shroff
    Hello, I hope you all are doing well. I want to build a system based on both OHLC or PNF charts, focusing on the relative strength of a stock against Nifty 50. However, when I opened the system builder and tried to find 'Relative Strength' in the indicators list, I could not locate it. I am attempting to replicate the Turtle Quants system discussed in this video [Turtle Quants Investing/Trading] (https://www.youtube.com/watch?v=JD_wSkgcXxs), which incorporates Relative Strength, RSI, ADX, DMI+, Moving Average, and Volume. Relative Strength is the only missing indicator, preventing me from constructing the system for both OHLC and PNF charts. If you want to learn more about this system, please watch the video from the link I shared above.

    The creator of this system has developed an indicator for it, known as 'TurtleQuants: Relative Strength.' I would greatly appreciate it if someone from @Definedge @@Definedge-Experts team could guide me on how to create this system either for OHLC or PNF charts on RZone, or if they can inform me where I can find the Relative Strength of a stock relative to Nifty 50. I would then try to design this system by myself.


  • issues related to point and figure charts with the current Zone Web Terminal
  • D Dhrumil Dhameliya

    Thank you @Prashant-Shah sir


  • issues related to point and figure charts with the current Zone Web Terminal
  • D Dhrumil Dhameliya

    Hello @Prashant-Shah @Raju-Ranjan @Krishna-Kumar @Prasiddh-Shroff @Mangesh-Joglekar Sir
    I hope you all are doing great.
    I got hooked on Point and Figure charts after watching @Prashant-Shah's Noiseless Charts webinar on MoneyControl Pro. Consequently, I opened an account with Definedge and began using the Zone Web Terminal, as it's the only platform with the appropriate tools for thorough PNF chart analysis. The Zone Terminal is a great trading platform; however, I have encountered a couple of issues which I am listing below for your reference::
    1 > I am unable to squeeze or expand the chart of any stock while placing and scrolling the cursor on the Y Axis, like TradingView allows.
    2 > When I am on a point and figure chart and open any stock chart, if I scroll left from the current price, the X and O columns either get bigger or smaller. Could you please fix this? It's challenging to analyze charts if the columns keep getting bigger or smaller size while scrolling. The scrolling behavior is also noticeable in indicators such as RSI, OBV, ADX, PMOX where the indicator lines increases or decreases while scrolling left or right.
    3 > When I zoom out on a point and figure chart and then try to zoom in a little, the entire chart shrinks. This is annoying because I have to go back and look for the X or O column I was focusing on in the zoomed-in state.
    4 > Every time I open the Zone website, I am shown a candlestick chart. Could you please add a feature that allows me to open the chart of any stock with a point and figure chart?
    It would be greatly appreciated if Definedge could address these issues, as it would significantly enhance the chart analysis experience.
    Thank you.


  • Issues with current Zone web terminal
  • D Dhrumil Dhameliya

    Hello,

    I hope you all are doing great.

    I recently opened an account with Definedge and started using the Zone Web Terminal. While using the Zone Terminal, I found a couple of issues which I am listing below:

    I am unable to squeeze or expand the chart of any stock while placing and scrolling the cursor on the Y Axis, like TradingView allows.

    When I am on a point and figure chart and open any stock chart, if I scroll left from the current price, the X and O columns either get bigger or smaller. Could you please fix this? It's challenging to analyze charts if the columns keep getting bigger or smaller size while scrolling.

    Every time I open the Zone website, I am shown a candlestick chart. Could you please add a feature that allows me to open the chart of any stock with a point and figure chart?

    Thank you.

  • 1 / 1
  • Login

  • Login or register to search.
  • Blog
  • Youtube Videos
  • Refresh
  • First post
    Last post
0
  • Recent
  • Categories
  • Unread 0
  • Popular
  • Tags
  • More
    • Guidelines
    • Disclaimer
  • Users
  • Login

  • Login or register to search.
  • Blog
  • Youtube Videos
  • Refresh