Hello,
Since a couple of days I have been testing out the strategies mentioned in the book. However, I was startled to see there are very big differences in what's mentioned in the book V/S when I actually did the backtesting myself on R-Zone. Also, it is not just limited to 1 strategy but multiple strategies have issues. I haven't tested all of them, but the ones which I have (3 strategies as of now), I am mentioning them below.
It is my request to the Definedge team and Prashant Sir to kindly look into this matter and please provide a solution as well as the logic behind this issue for better understanding of the system. Also, I request everyone else who may have faced any similar/same issues. If yes, do write down below so that the team knows if the issue is universal. If not, I would request you to go ahead and backtest the strategies to see if your backtesting matches or varies from the one mentioned in the book.
Few such examples are as below :
Strategies :
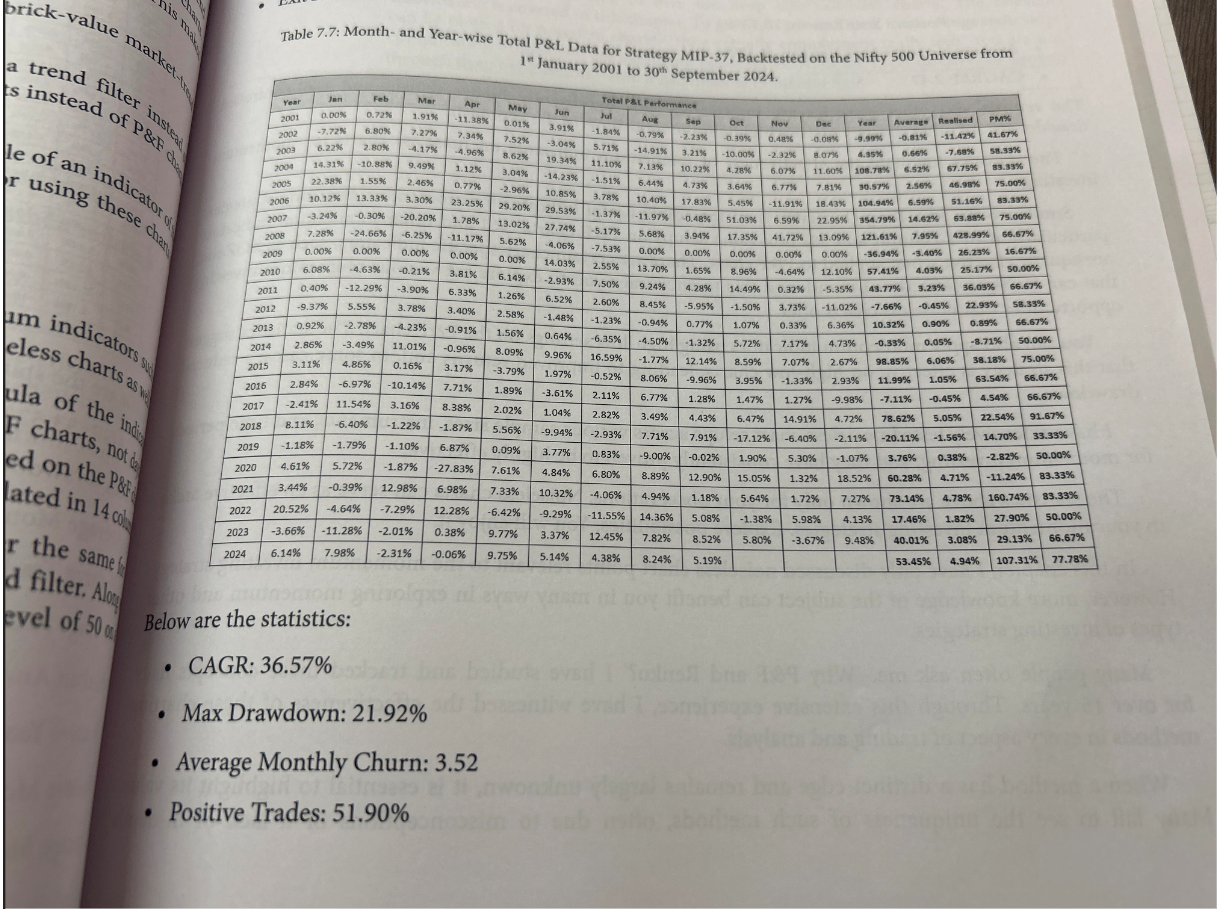
MIP 37 - Book results are : CAGR - 36.57% & Drawdown - 21.92%
Actual Backtesting results : CAGR - 32.72% & Drawdown - 52.92%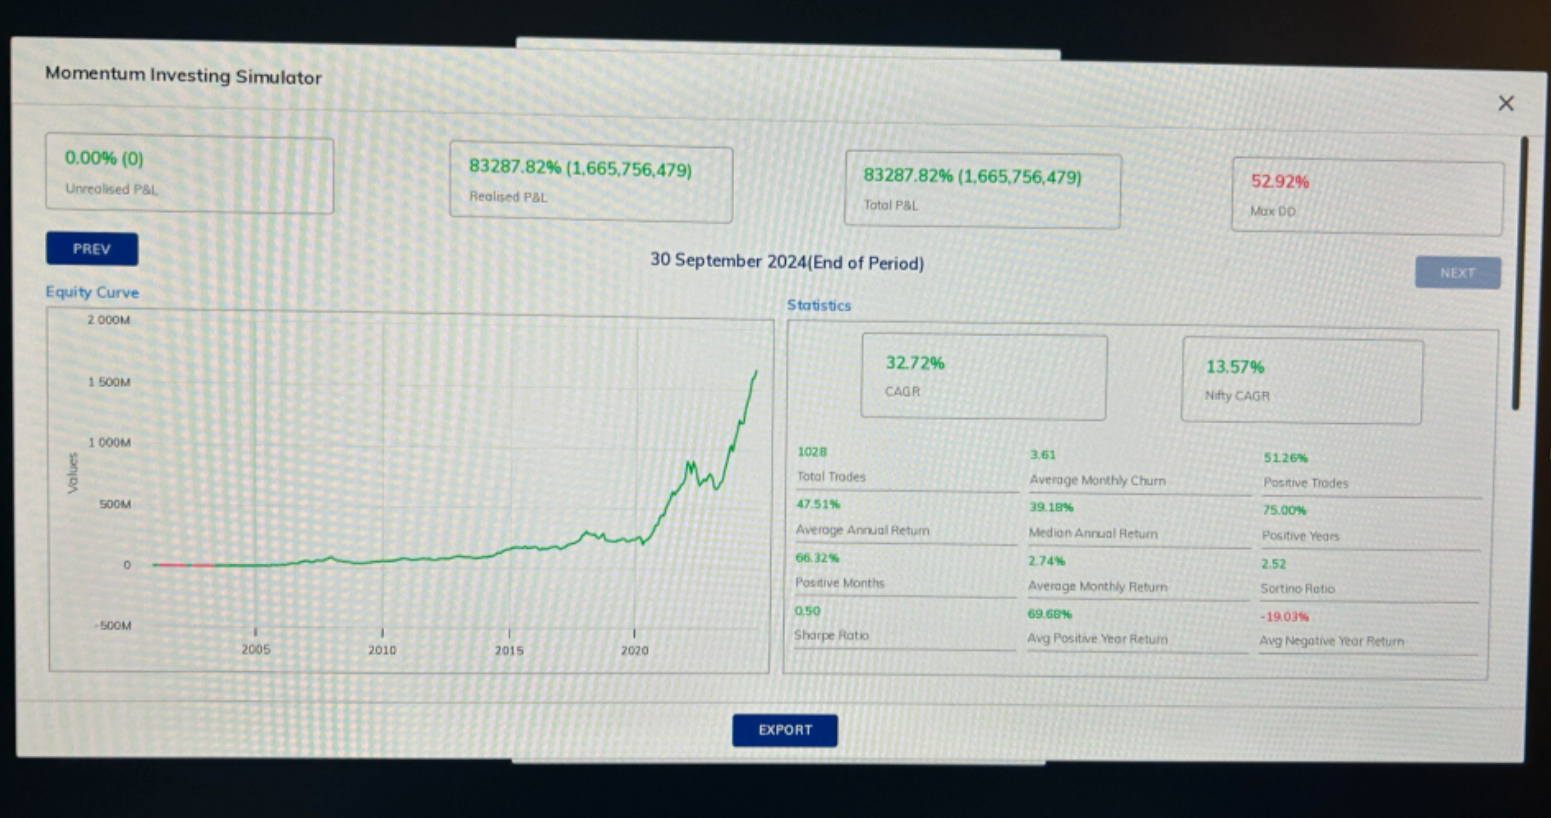
MIP 35 - Book results are : CAGR - 32.45% & Drawdown - 22.29%
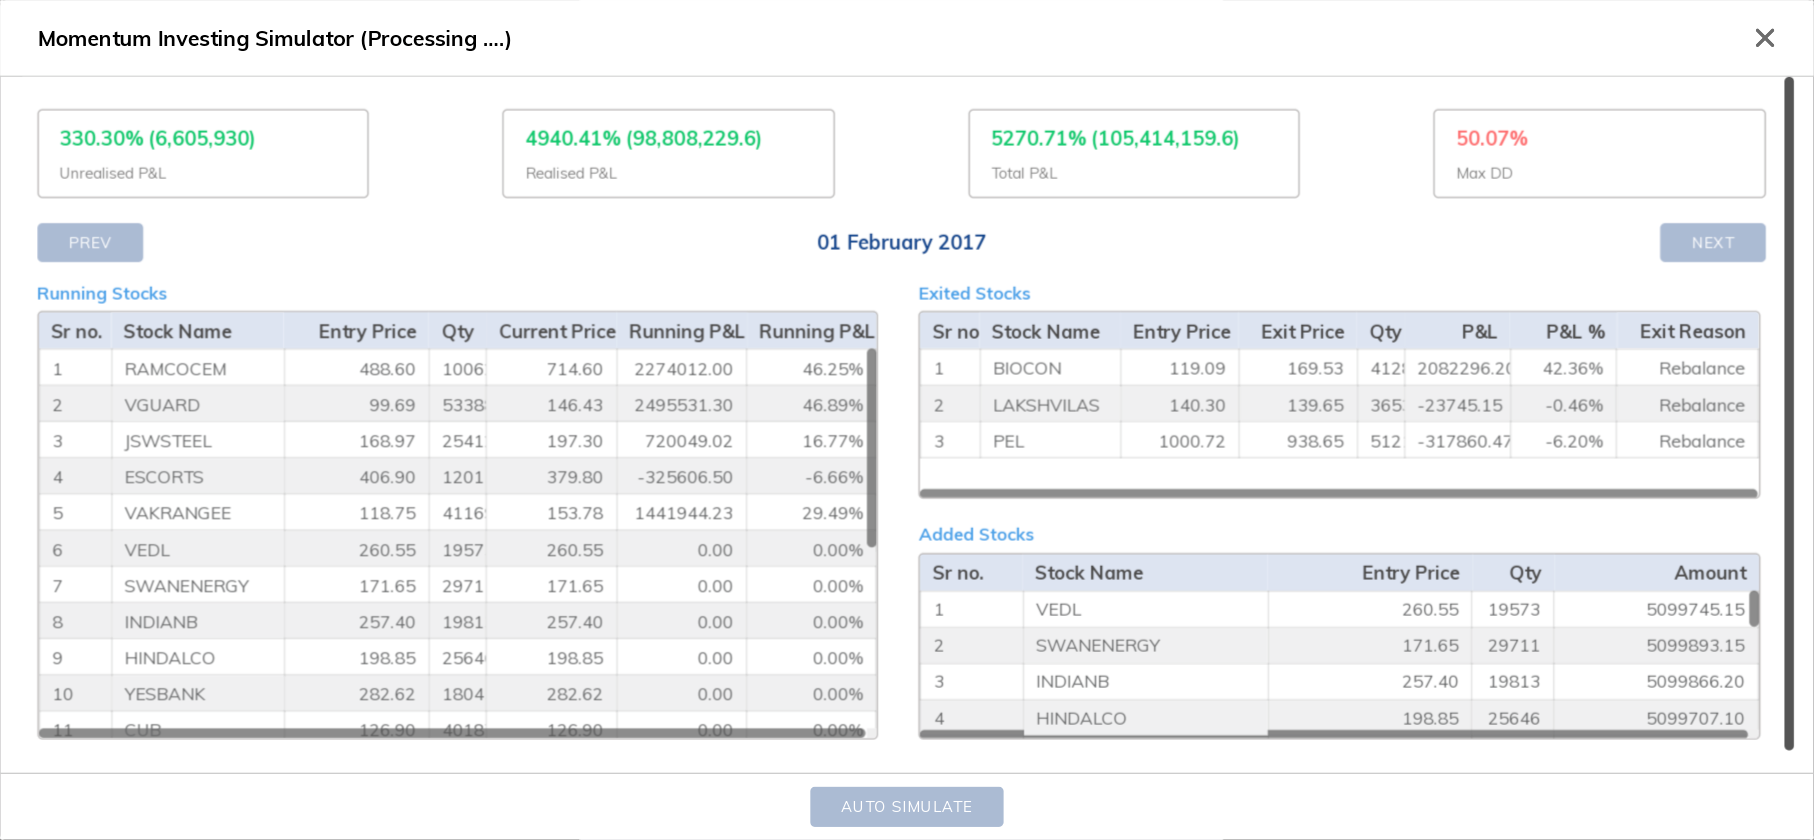
Actual Backtesting results : CAGR - & Drawdown - 50.07% (Stopped backtesting as it crossed Max DD in between only)
MIP 15 - Book results are : CAGR - 39.22% & Drawdown - 16.75%
Actual Backtesting results : CAGR - 41.4% & Drawdown - **15.98% 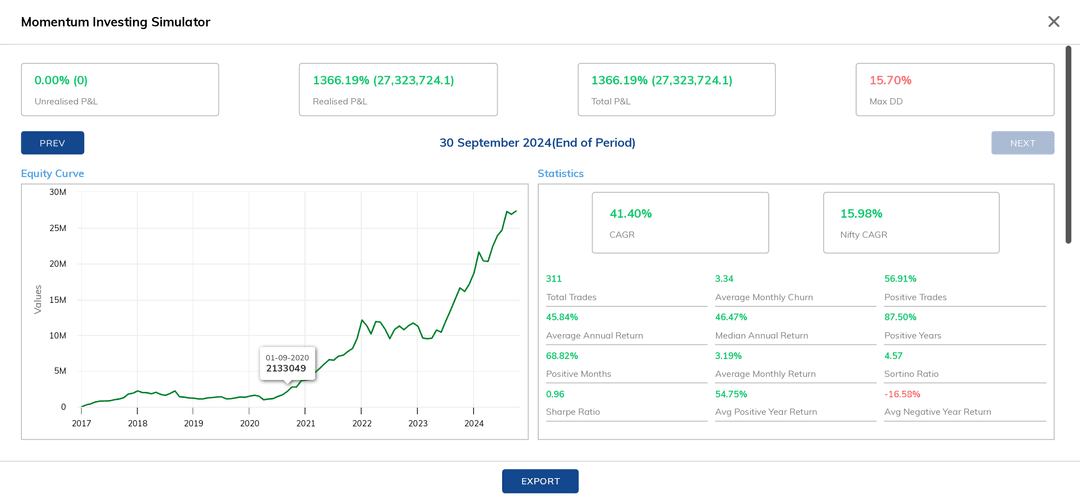
In MIP15, my concern is even though the result maybe good, but how can it be different ? If the same data set is being tested without any variations in parameters ?
I have copied these strategies from "Sample Strategies" from Momentify Page and then backtested it in R-Zone.
Note : I have kept all the parameters unchanged including backtesting date, capital & universe, etc.
Hence, it is my humble request to the Definedge team to please look into it and provide a solution as well as logic for this issue in order to avoid any real time issues when we deploy the portfolio for Real Trading.
Thank You
Harshal Chokhawala
19/08/2025
")