
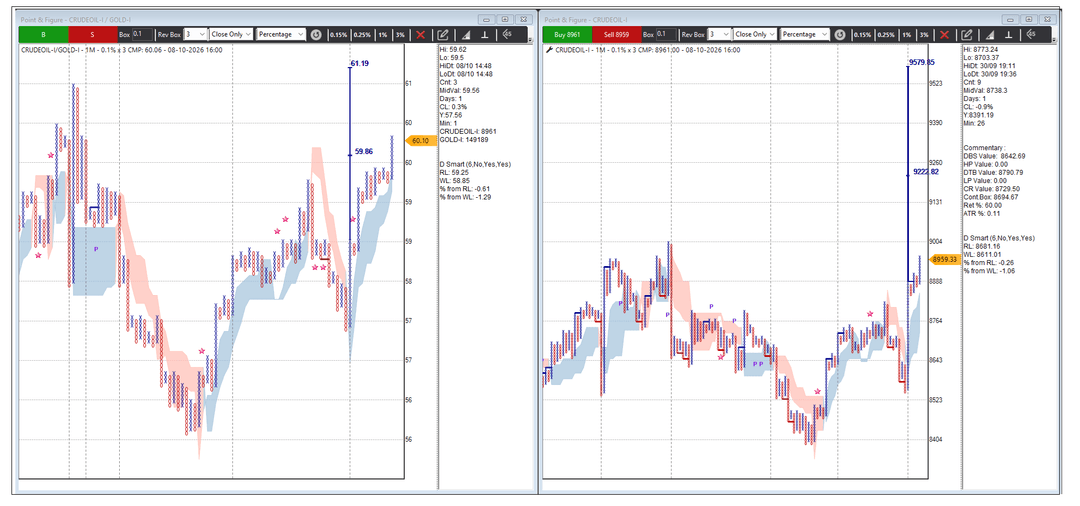
Crude Oil looks interesting. Nice breakout on both the price chart as well as the RS chart. Pattern failure below 8725.
 M
Mangesh Joglekar
All Replies
-
-
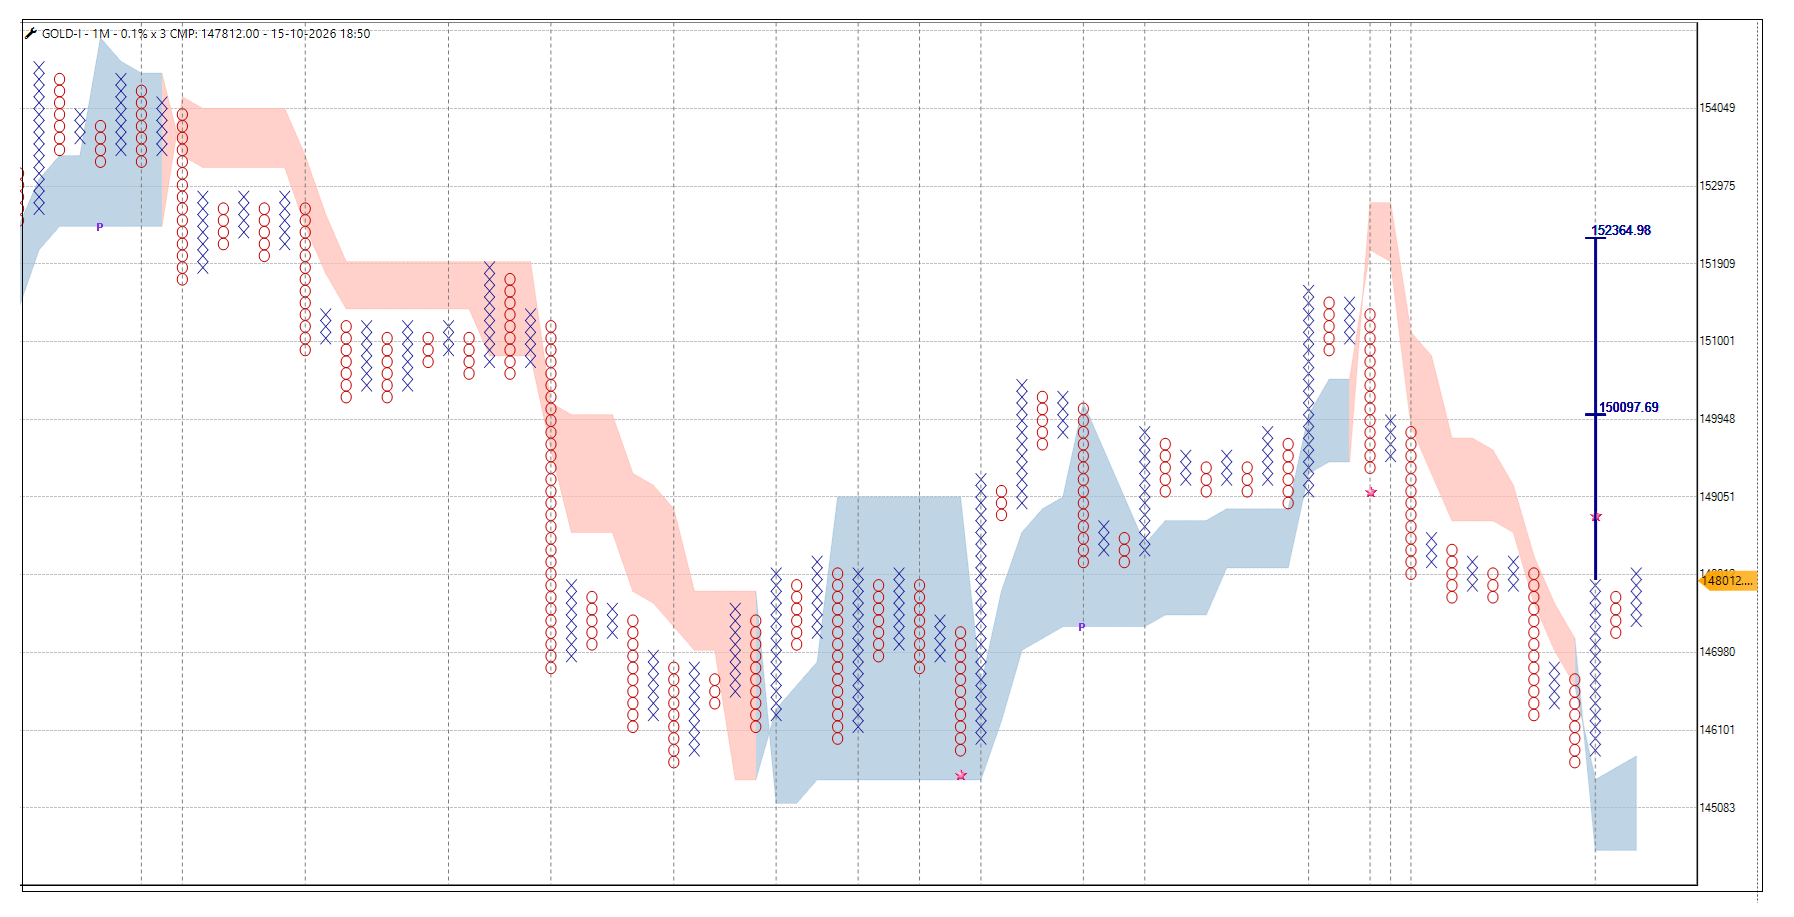
Gold Chart Looks Interesting above 148100 Pattern Failure Level is 147100
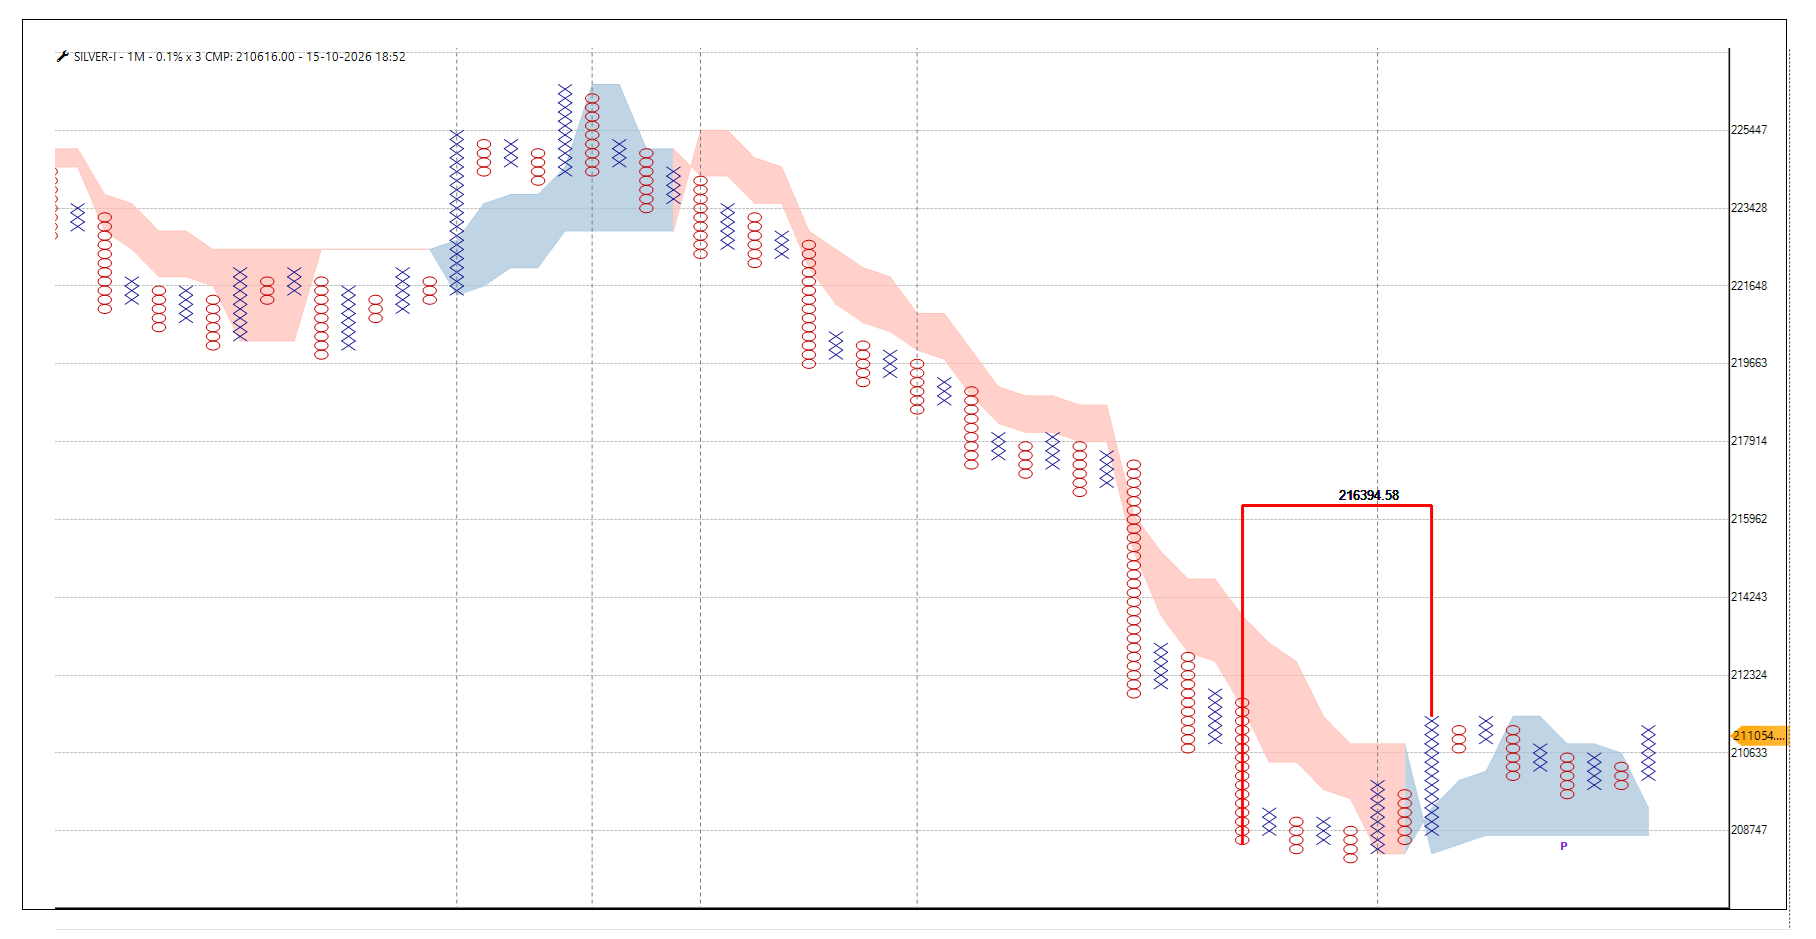
Silver Chart Looks Interesting above 211500 Pattern Failure Level is 209500
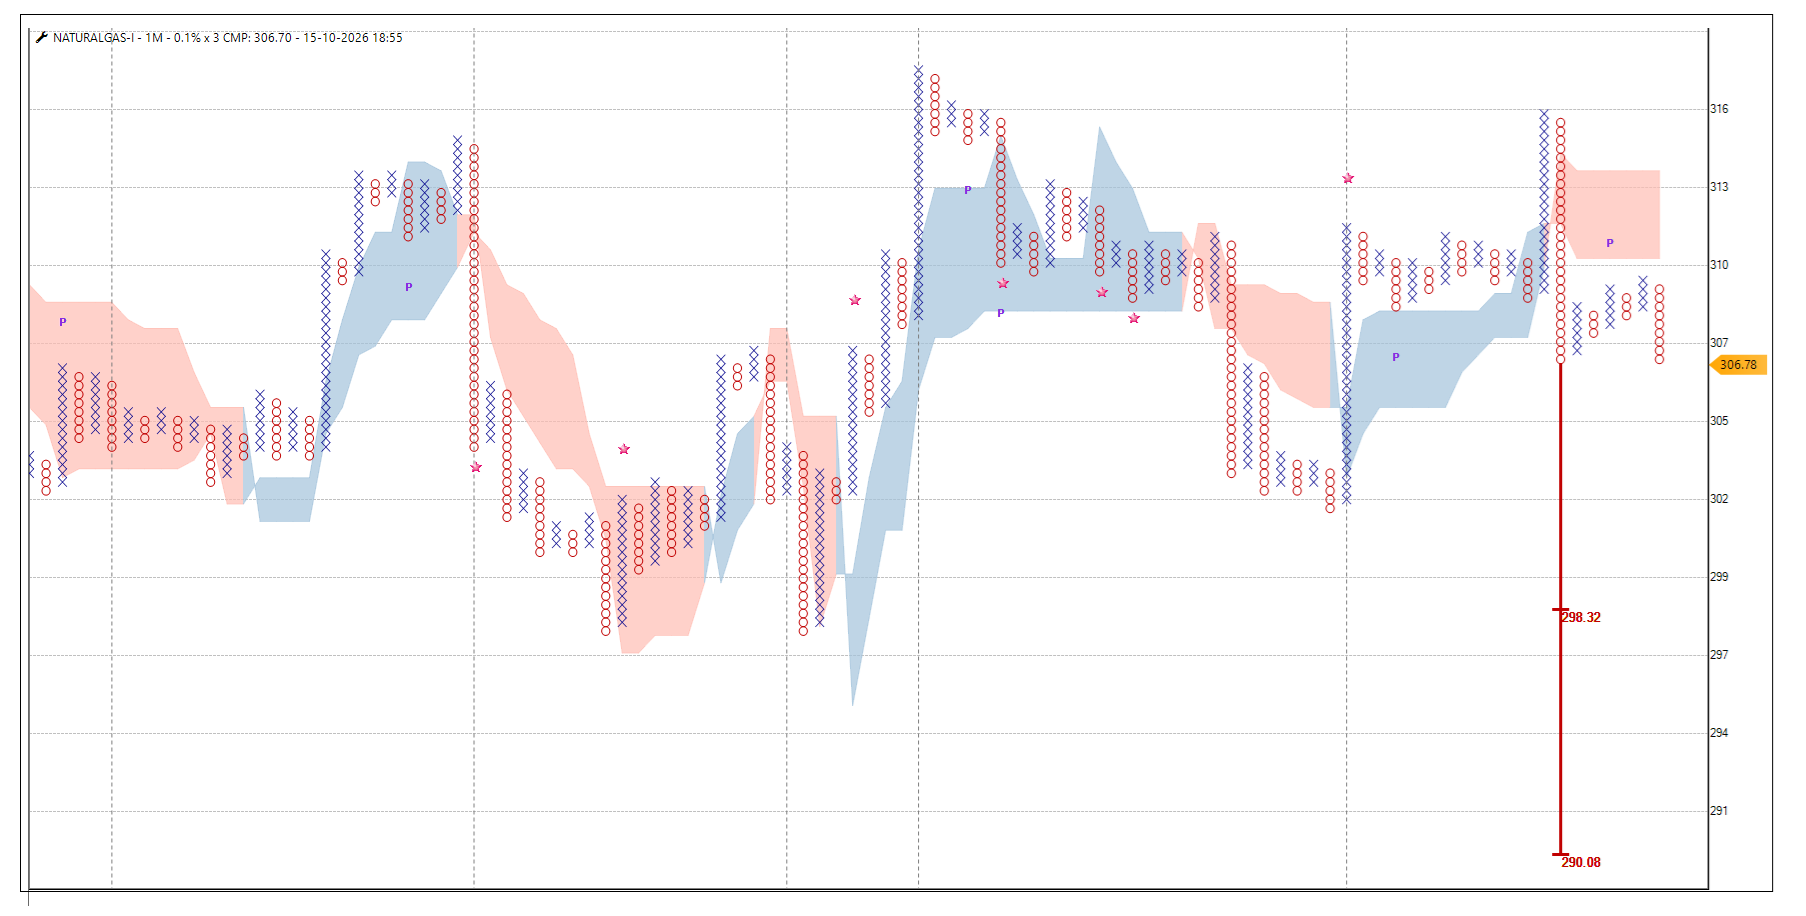
Natural gas Chart looks weak below 306 Pattern Failure level is above 313 -
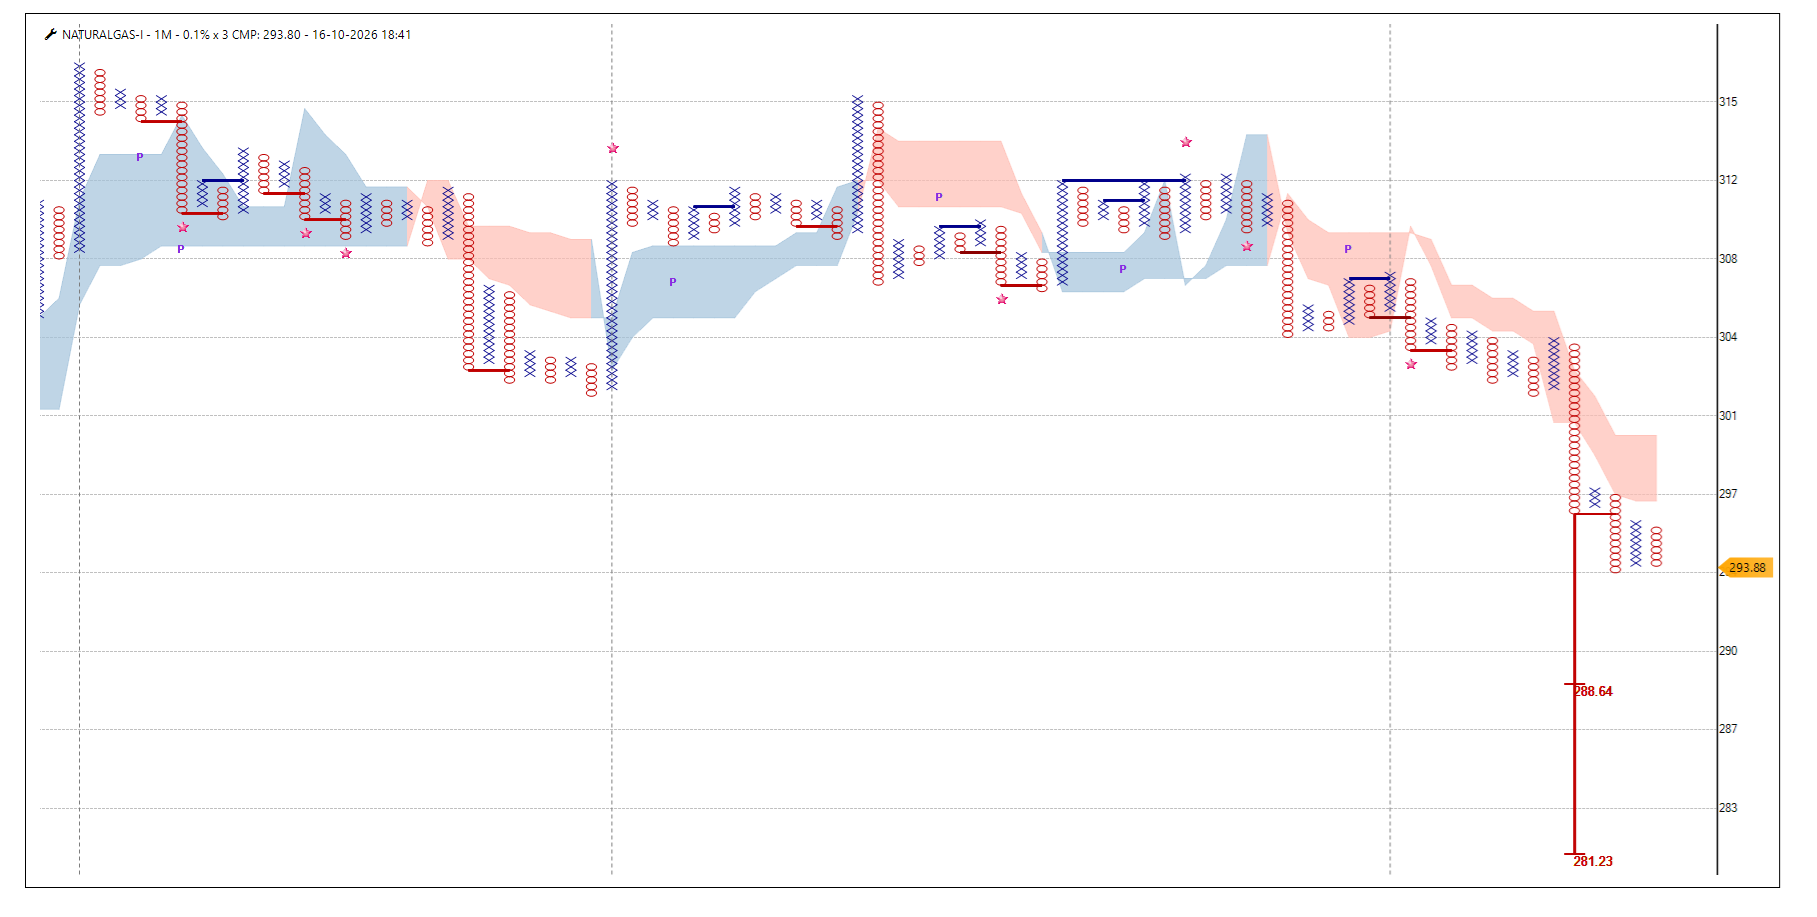
Natural Gas Chart looks Weak below 292 Pattern Failure Level is above 300 -
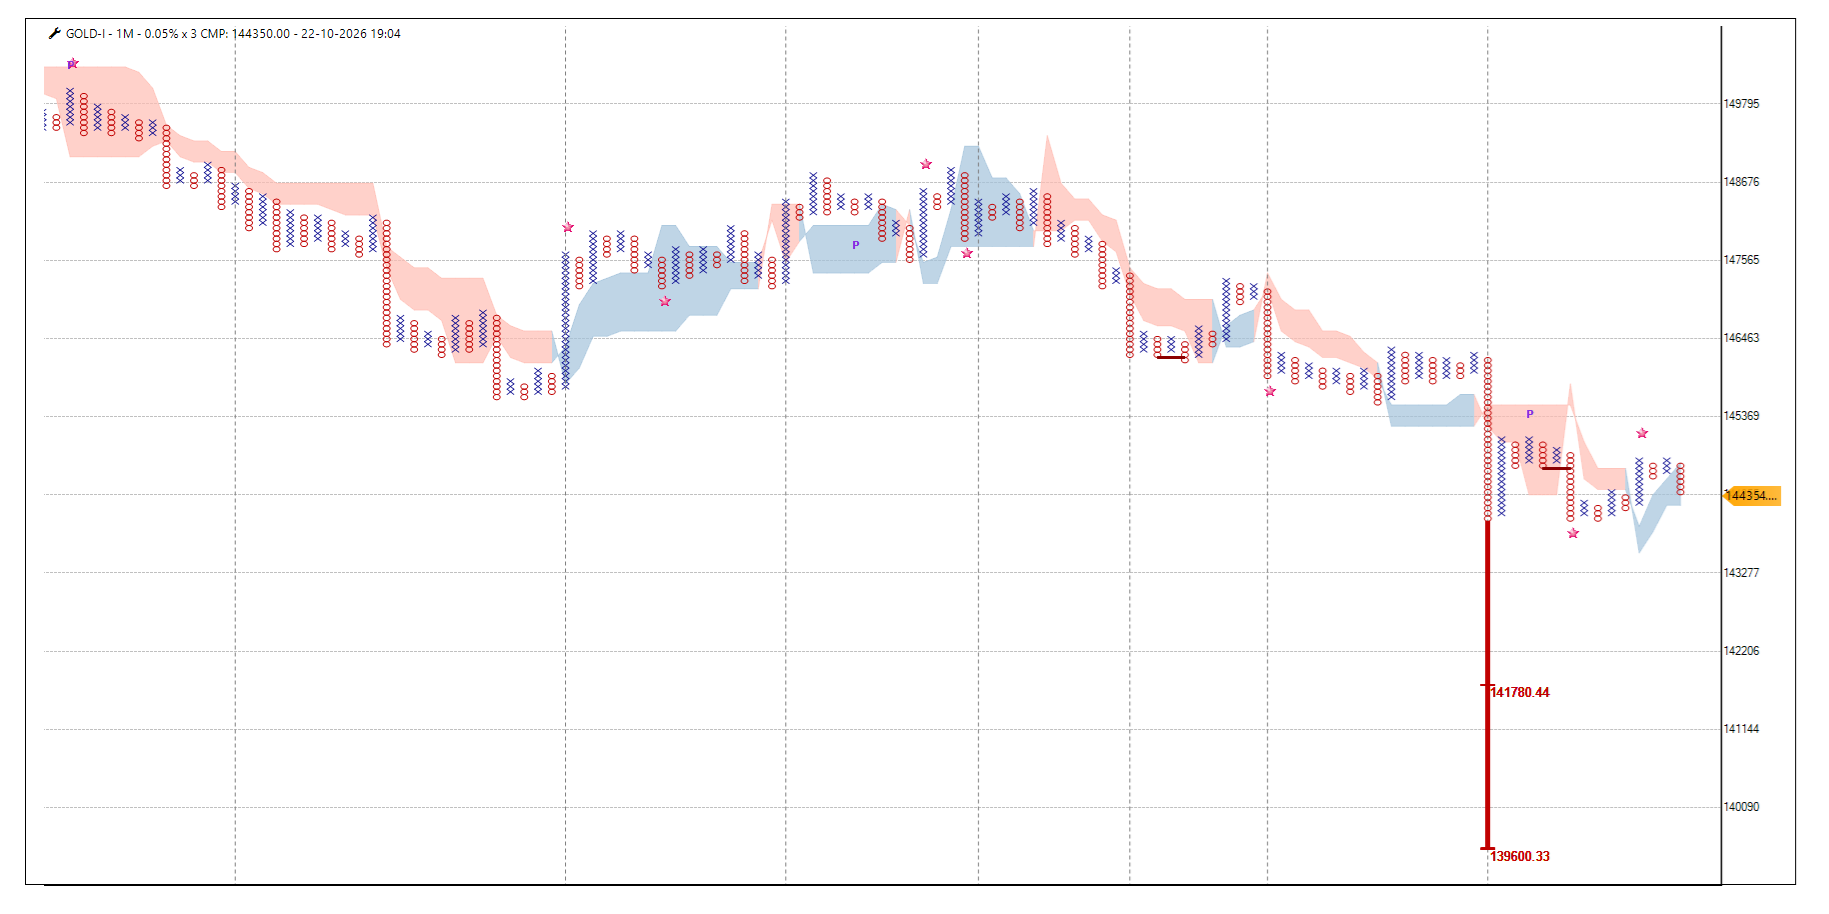
Gold chart looks weak below 143900 Pattern Failure level is above 144900
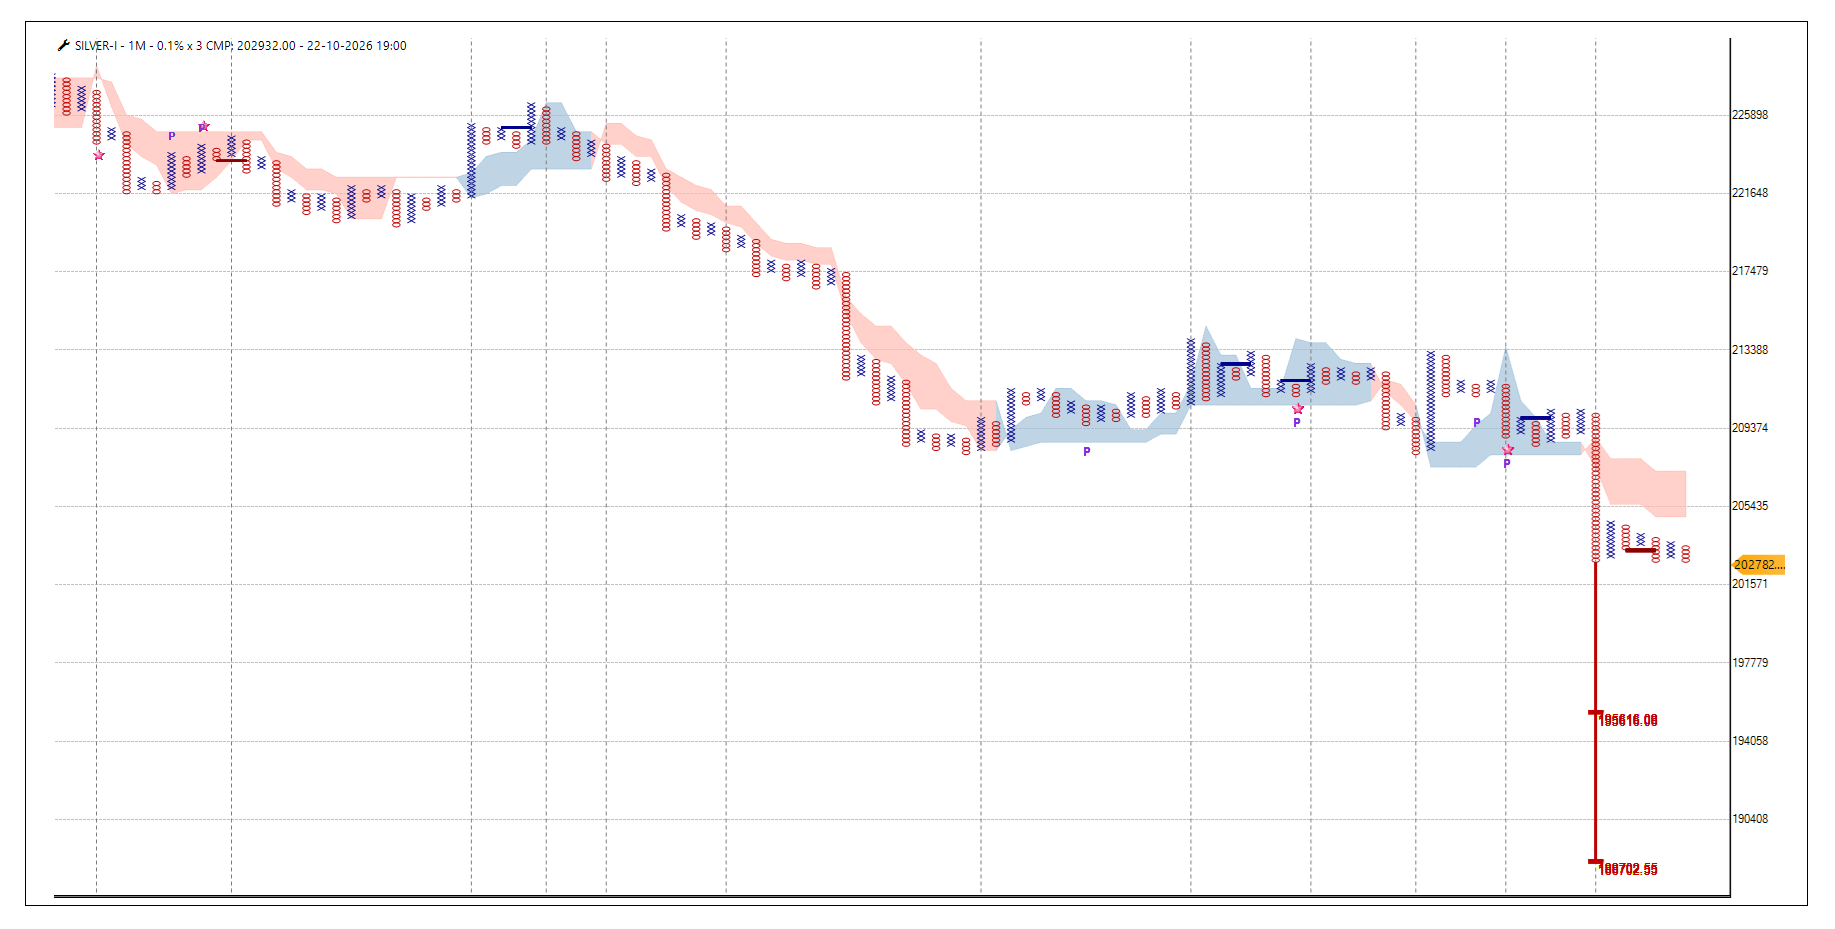
Silver Chart looks Weak below 201300 pattern Failure level is above 203800 -
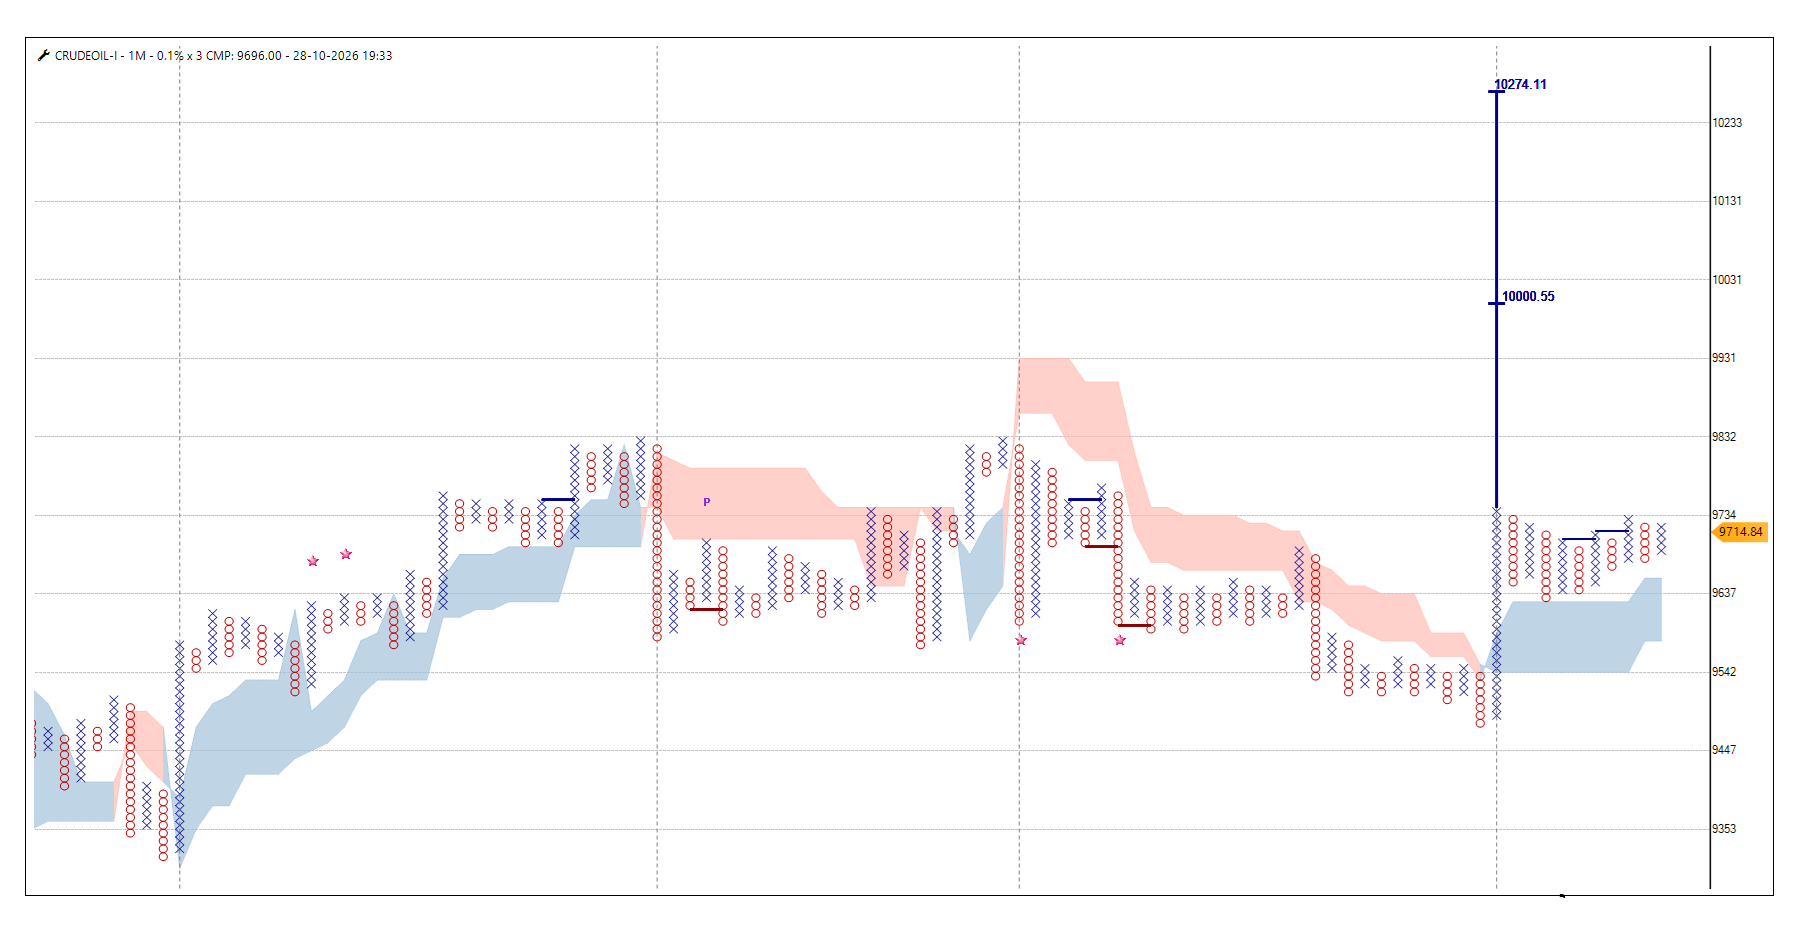
Crudeoil chart looks interesting above 9750 Pattern Failure level is below 9580
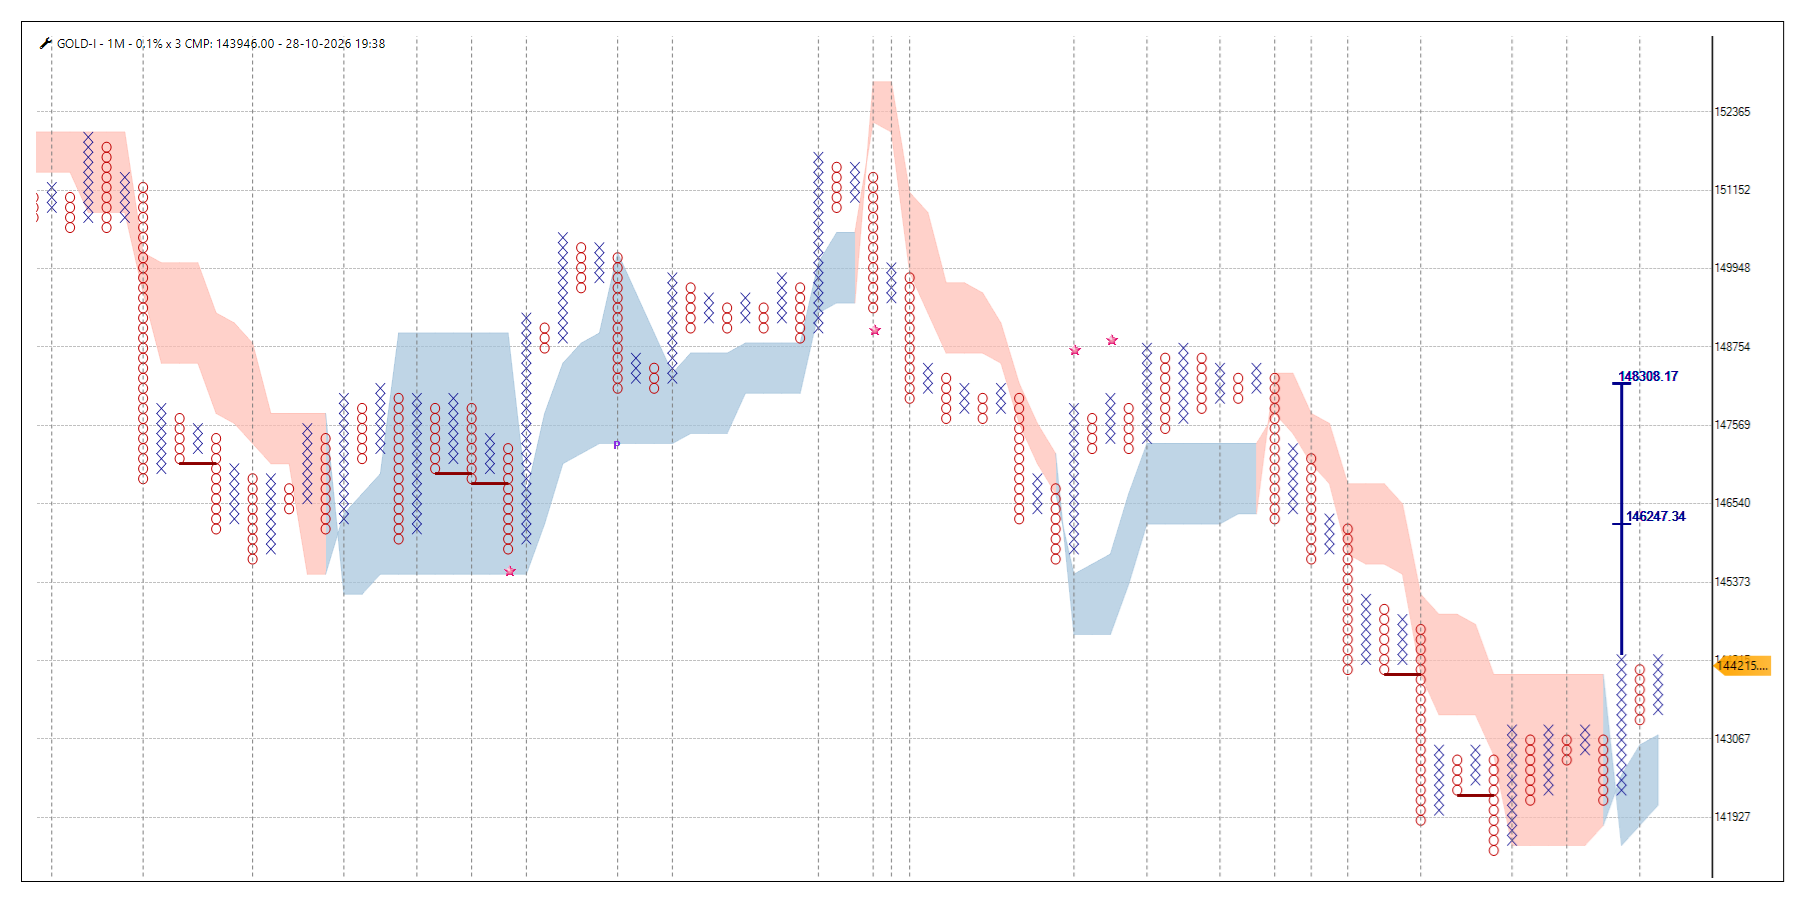
Gold Chart looks interesting above 144400 pattern failure level is below 143200
Commodity View : Crude oil
Commodity View: Gold Silver and Natural Gas
Commodity View : Natural Gas
Commodity View : Gold and Silver
Commodity View : Crude Oil and Gold