• Recent
  • Categories
  • 0 Unread 0
  • Popular
  • Tags
  • More
    • Guidelines
    • Disclaimer
  • Users
Skins
  • Light
  • Default
  • Cerulean
  • Cosmo
  • Flatly
  • Journal
  • Litera
  • Lumen
  • Lux
  • Materia
  • Minty
  • Morph
  • Pulse
  • Quartz
  • Sandstone
  • Simplex
  • Sketchy
  • Spacelab
  • United
  • Yeti
  • Zephyr
  • Dark
  • Cyborg
  • Darkly
  • Slate
  • Solar
  • Superhero
  • Vapor
Collapse
Definedge Forum Logo
N

Naresh Kanani

Pro User

About
Topics
8
Replies
15
Groups
1
Followers
0
Following
5

All Replies

Recent Best Controversial

    Market Breadth - technical alerts/ condition
  • N Naresh Kanani

    Hi Team,

    I am looking for technical alert/ condition for breadth related charts like X Percent Breadth

    1. Entering and leaving Yellow zones (25 and 75)
    2. When it crosses the moving average (both above and below)?

    Do we have any such kind of alert/ system?


  • Denominator choice in RS?
  • N Naresh Kanani

    Thank you @Karan-Dattani for your inputs.

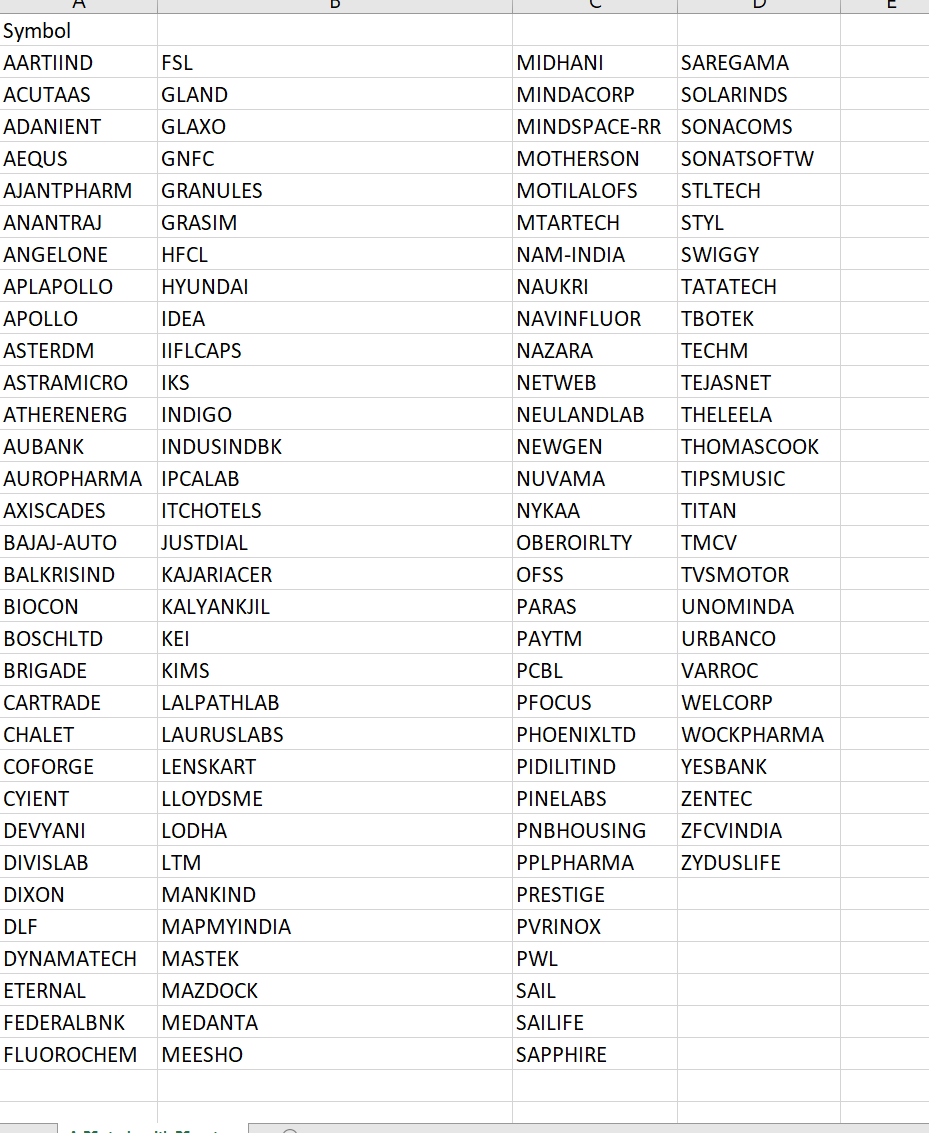
    I made this for Nifty 500 universe
    I realised that market regime will change and at any point between Nifty 50, Next 50, Midcap 150, Smallcap 250, one index will be better than other. (for e.g. right now Smallcap 250 outperforms other segment)
    Hence, I wanted to create a mechanism that it gives me stocks universe which outperform in all market regime (kind of create it, set and forget it)

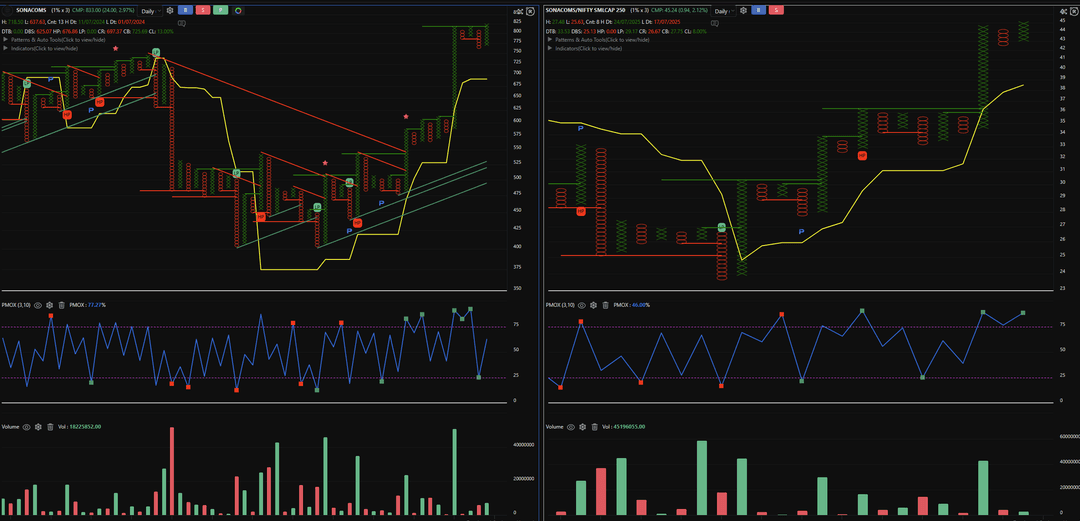
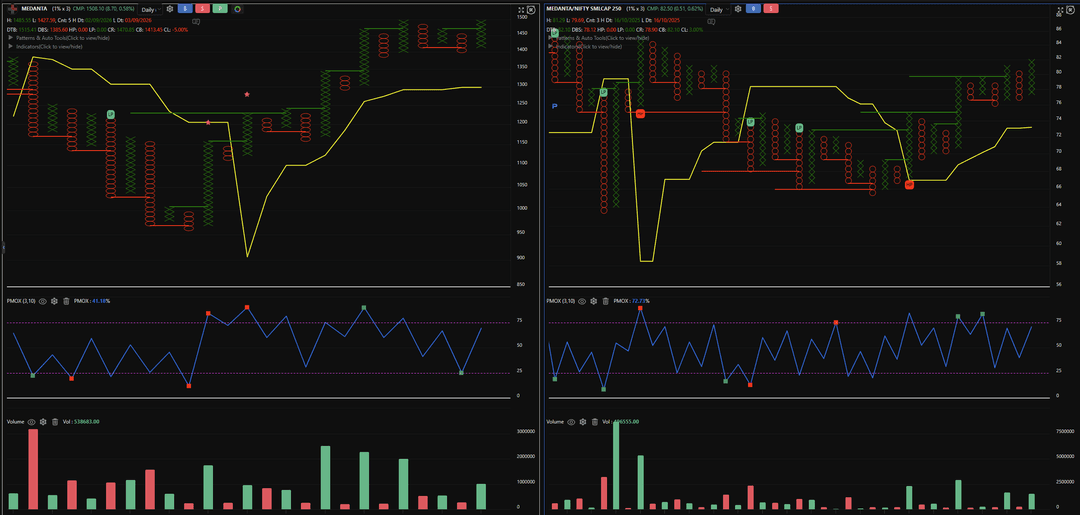
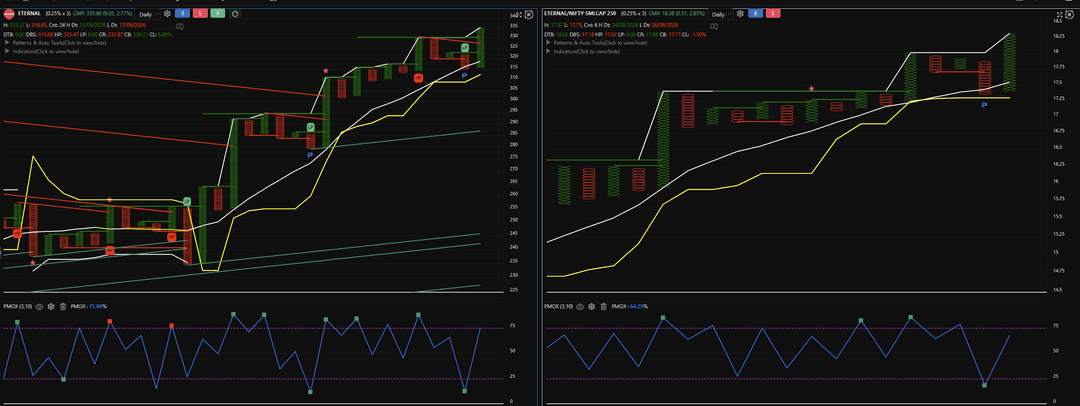
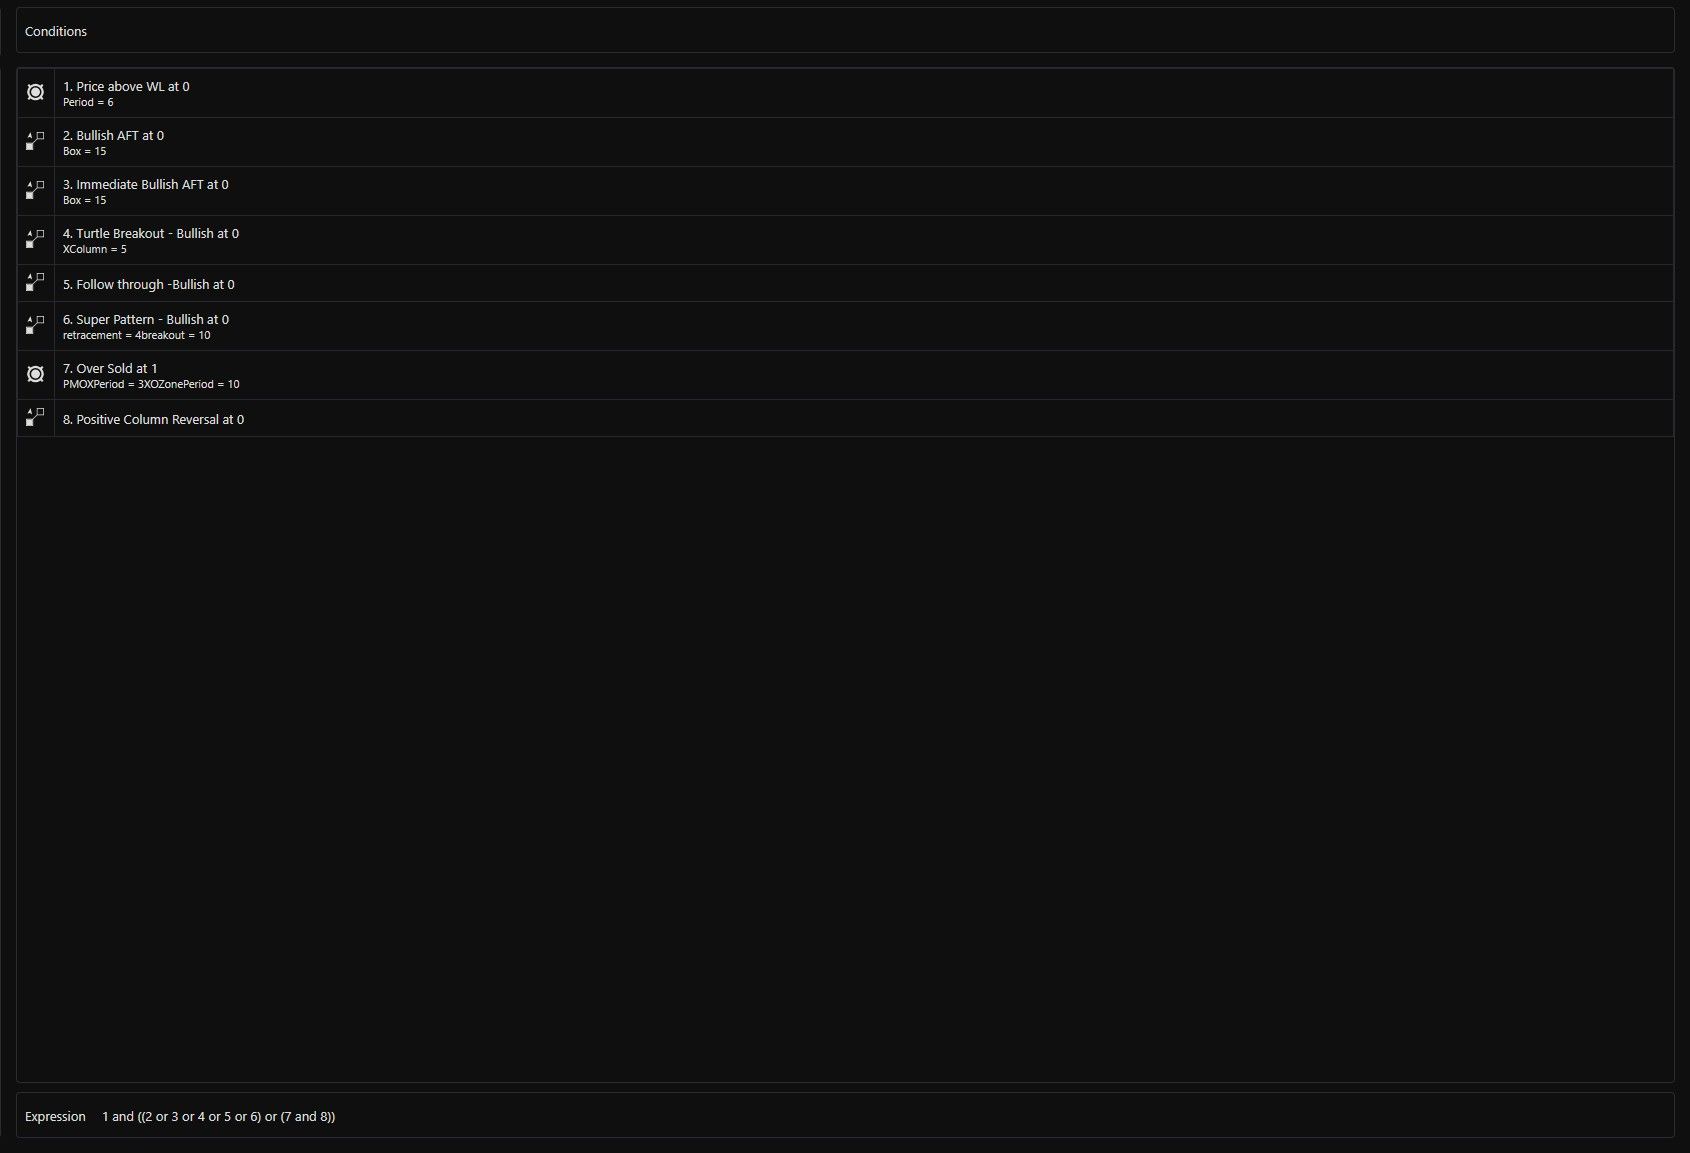
    First i created a condition where in RS chart, it is in column of X and above Dsmart cloud at 1% boxsize
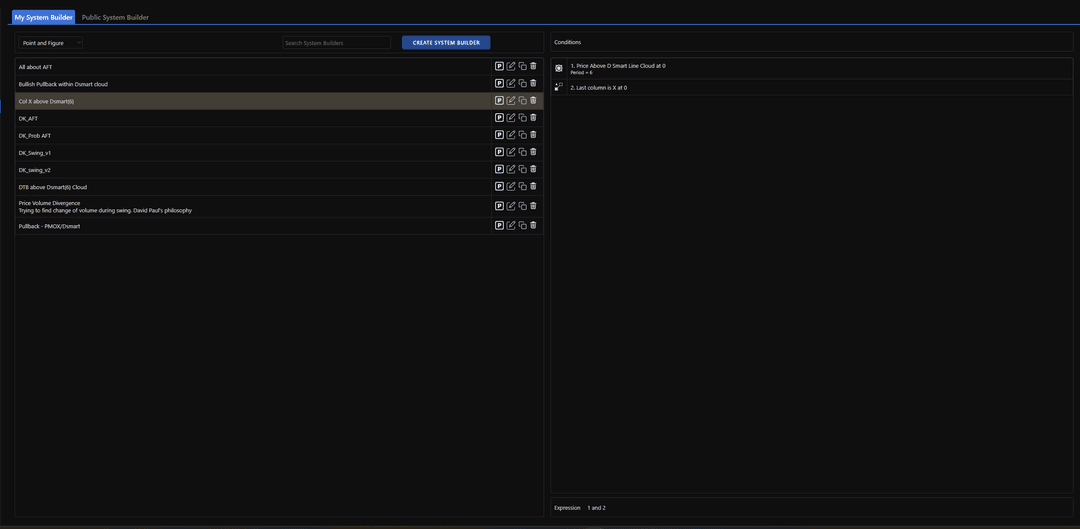
    image.png

    PS: I like the RS above Dsmart cloud, for someone it could be above Dsmart line. I leave it to them

    Then i used this P&F RS scanner to develop an RS of each segment

    image.png

    4c489aff-dbe8-4300-9a96-aeda0747e81b-image.png

    53c3f248-671b-4f2a-835e-d6180eb08ea9-image.png

    53dbe3f4-170c-468a-ba61-fa074e0d6062-image.png

    Once i created all this, then i went into master scanner to look for stocks who outperforms all segments.

    6518cb91-b8a9-40ab-8d43-3bddd325dc94-image.png

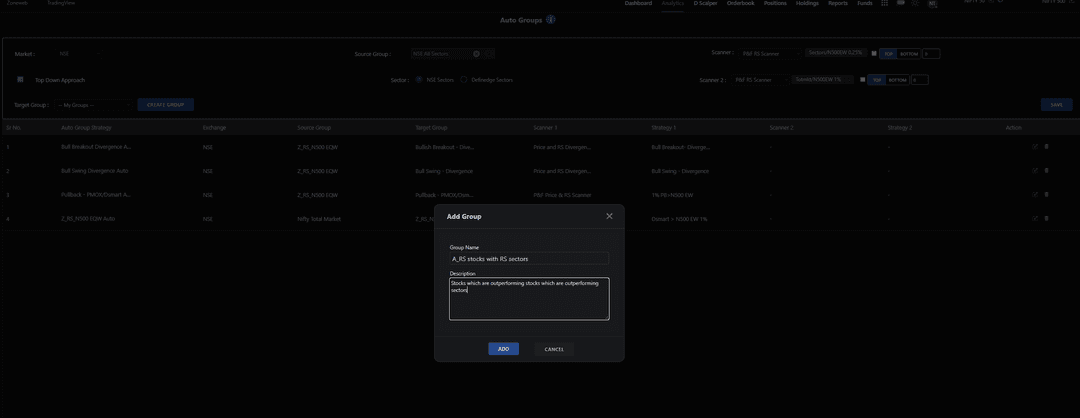
    and to ensure that i don't have to repeat this process again and again, i added to auto groups

    0d1a9ec9-549a-4e97-b693-bc7f528df43d-image.png

    I created this methodology as a robust mechanism (so the segments can play between themselves to find a winner and we would still have those stocks who beat all segments) to filter out stocks who are not strong. This forms the Watchlist to search for AFT/ Turtle breakouts.

    This pretty much solves the RS conundrum (hoping that it will 🙂 )

    I am posting this so that it may help the overall community and i am open for feedback/ suggestions as a part of learning.

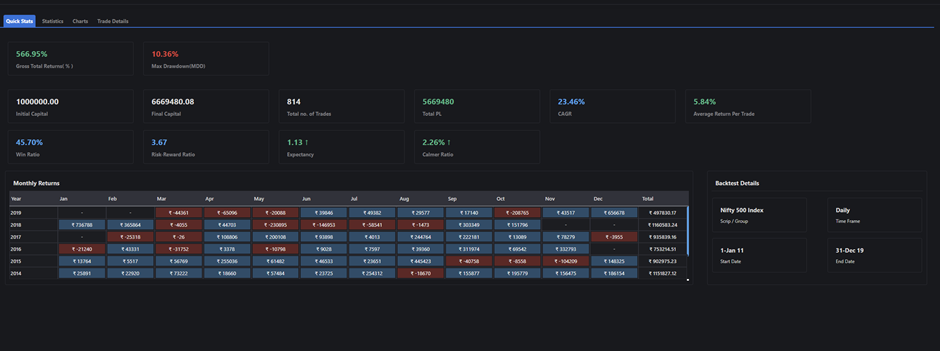
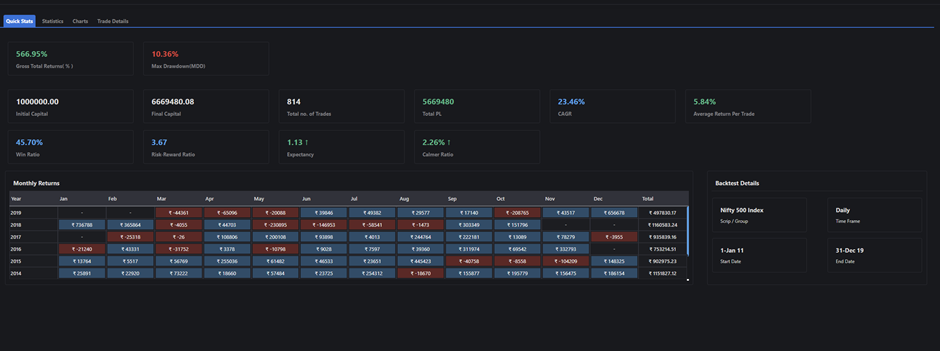
  • Denominator choice in RS?
  • N Naresh Kanani

    Hi Fellow traders, PnF expert, Definedge experts,

    I am relatively new to Definedge & PnF and I am intending to draw to PnF mainly from Relative Strength pov.
    While it is great to have lot of indices to choose from, i want to establish a more process oriented approach.
    I need some guidance in choosing the right denominator in RS which i can compare stocks and index to.

    Initially i thought about Nifty 500 Equal weight but on some contemplation i realised its more of indicator of breadth rather than Relative Strength.

    Then i switched to Segments - MicroCap 250, Small cap 250, Midcap 150, Nifty 50, Nifty Next 50.
    Counter question are individual segments too tight (may not cover all sectors) to compare to? What about market capitalization effect on indices?

    Do i choose which is best performing one at 0.25%/0.5%? (RS Matrix chart - RS Performance score) and keep on rotating?

    I would be really grateful if someone can experienced help me understand which one to use and more importantly why.


  • P&F Price Scanner - 45 Degree Trendline Breakout
  • N Naresh Kanani

    @Vishal-Shah did you have any luck with that? i am also looking for a bigger TF 45 degree trendline breakout. like a breakout from previous swing high/year breakout.


  • Typo in Breadth book in Shelf - BRS principle page
  • N Naresh Kanani

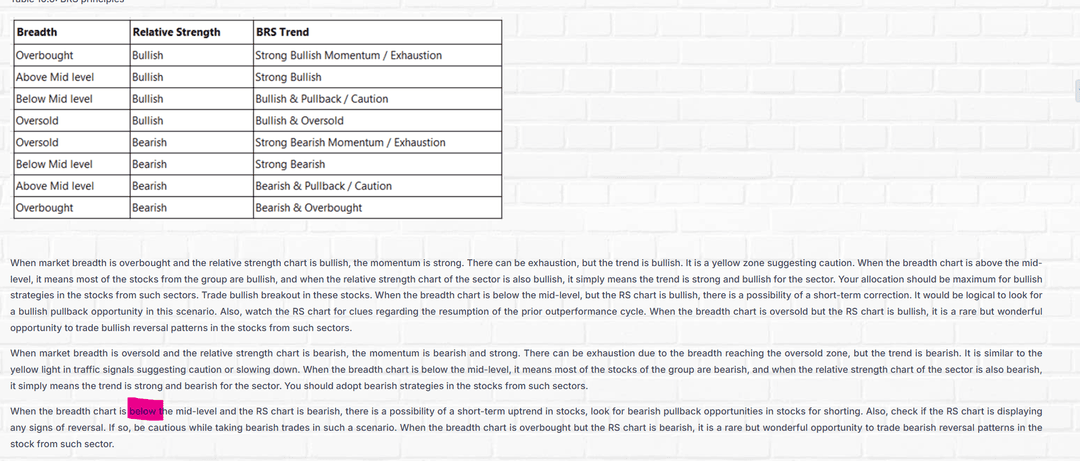
    Hello Prashant Sir/ Definedge team, there is a mistake/ typo in the third paragraph below the table in BRS principle. When the breadth chart is "above" mid-level and RS chart is bearish, there is a possibility of up-trend in stocks, look for bearish pullback in stocks for shorting

    Also, please correct me if i am making a mistake in understanding it.

    Also, thanking you to make this books available in shelf. It is to the point and not beating around the bush at all which makes a great read for a beginner in PnF charts

    958d6a0e-a873-4f78-93e8-39cbac736897-image.png


  • Auto group and multi layer RS knowledge
  • N Naresh Kanani

    @Definedge @Karan-Dattani @@Definedge-Experts just checking on this thread. Thank you


  • Link the ticker/ script across layouts
  • N Naresh Kanani

    Thank you @Yogesh-Kumar , this solves it. Really appreciate your help on this. Thanks


  • Link the ticker/ script across layouts
  • N Naresh Kanani

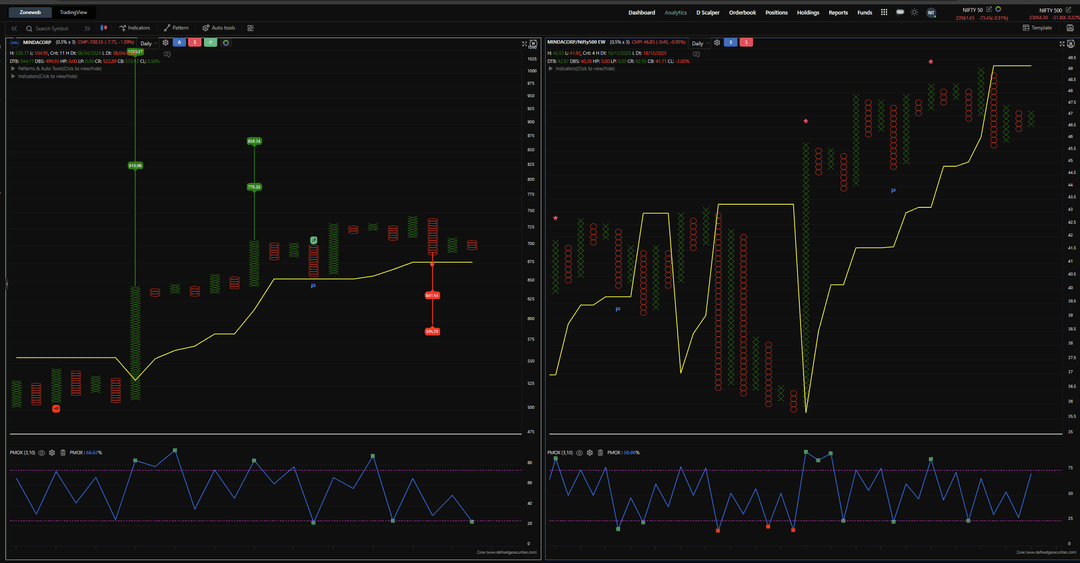
    Hi Team, I am using dual layout in zoneweb.

    one is regular PnF chart and other is RS chart.
    I want to link the ticker in both cases.
    But when i change ticker on left chart, i have to manually do it for the RS chart
    So i have to go back and again to do the changes while seeing all stocks in a group.

    Is there a button i am missing or any functionality?

    fde96189-8173-4fa3-bfb1-0b00ea5f08ed-image.png


  • Auto group and multi layer RS knowledge
  • N Naresh Kanani

    @Karan-Dattani

    I got 122 sector list f

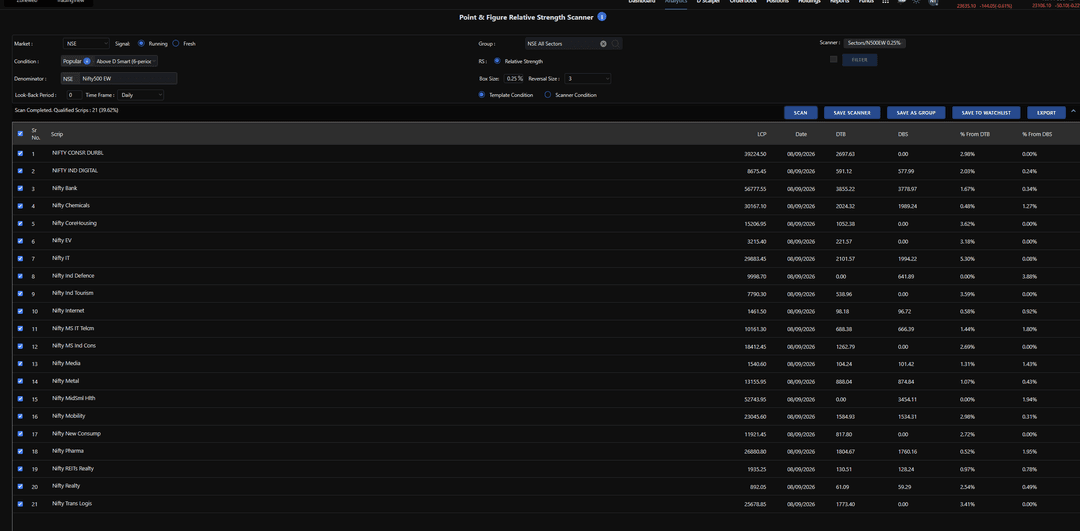
    Please see attached the first scanner for sectors
    image.png

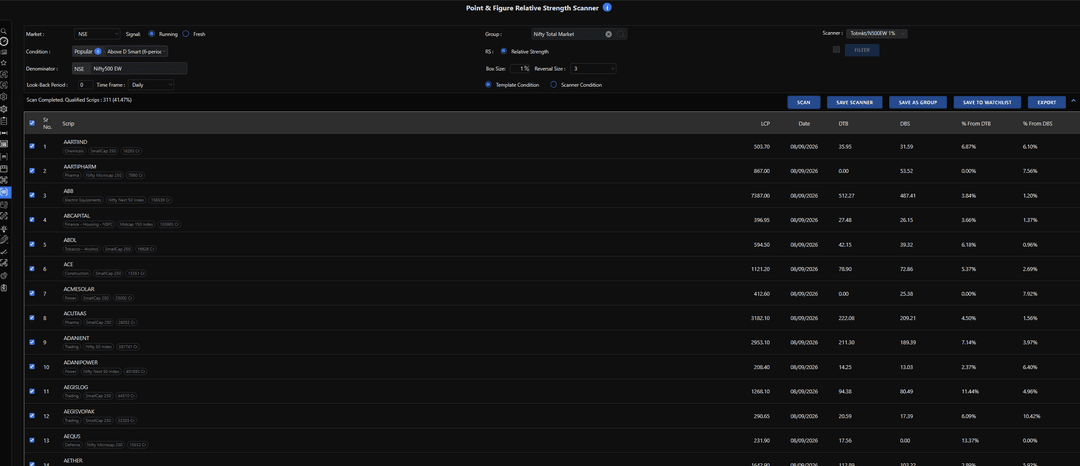
    2nd scanner

    image.png

    Final list

    image.png

    My question - is this methodology/ process correct?


  • Auto group and multi layer RS knowledge
  • N Naresh Kanani

    20644e61-98e8-483d-9f61-089475550d13-image.png

    Hi Team,

    I am trying to create a group of stocks which are outperfroming the sectors and sectors are outperforming Nifty500EW.
    I am putting under Auto group which updates on daily basis.

    1st scanner - PnF RS above Dsmart for Sectors / N500 EW
    2nd scanner - Nifty total market/ N500 EW (i couldn't do sectors here)

    Is this the correct approach?

    If not, please highlight - how should i proceed?


  • Relative Strength
  • N Naresh Kanani

    Hi Team,

    I have couple of questions for Relative Strength.

    1. I want to generate a report which is above D-smart over its "Definedge" sector index. For eg. BSHSL/Definedge - Agriculture
    2. Like you have Nifty All sectors RS, can you have Definedge All sectors RS?

    Are the above two points possible in Rzone? Also is there a way to automate rather than running in each sector?

    Eventually I want to have dynamic portfolio which outperforms its respective Definedge sector as well as broader market.


  • Box size - RS Chart - Definedge sectors vs Nifty 500/ 750?
  • N Naresh Kanani

    Thanks @Karan-Dattani - is there a way to find out. specific stocks who also outperform on sector and sector outperforms N500 in one scanner/ list in Rzone?


  • Box size - RS Chart - Definedge sectors vs Nifty 500/ 750?
  • N Naresh Kanani

    Hi Definedge team.

    I am plotting all Definedge sectors vs nifty 500/ Nifty 750.
    What should be my box size for Daily, Weekly and Monthly?

    Is there a way where i can filter sectors which are above Dsmart line on RS chart vs N500/ N750?


  • System builder - help needed to create a system
  • N Naresh Kanani

    @Brijesh-Bhatia how do i DM the UCC? the tools are great but its so difficult to use them. Is there a chat/ discord except for this forum?


  • System builder - help needed to create a system
  • N Naresh Kanani

    Hi, I am new to definedge and creating a strategy for bullish swing trades.

    I am very new to definedge and i am not sure if this is correct method to identify bullish breakout. above dsmart line.

    I have been following market strucutre and i wish to have two DTB/ or Turtle breakout before i could enter the trade and hence i have designed this strategy.
    Also, there is an angle to have PMOX pullback as a VCP style swing trade.

    Can someone help me if i am doing it correctly or need some improvements?

    The idea is to have it in buzzar for F&O stocks (hard limit of 300)

    Also, i need a help on blocksize
    is 0.25% = 15m TF or a daily TF?
    If i have to set buzzar alert, do i need to keep on Daily or 1min?

    Swing_v1.jpg

  • 1 / 1
  • Login

  • Login or register to search.
  • Blog
  • Youtube Videos
  • Refresh
  • First post
    Last post
0
  • Recent
  • Categories
  • Unread 0
  • Popular
  • Tags
  • More
    • Guidelines
    • Disclaimer
  • Users
  • Login

  • Login or register to search.
  • Blog
  • Youtube Videos
  • Refresh