Please check in the insights section.
N
Nitin Shukla
All Replies
-
-
• 3% Box Size –
o Consolidation + Turtle breakout
o Setback-Comeback• 1% Box Size –
o ABC Breakout
o Close > 08EMA>21EMA
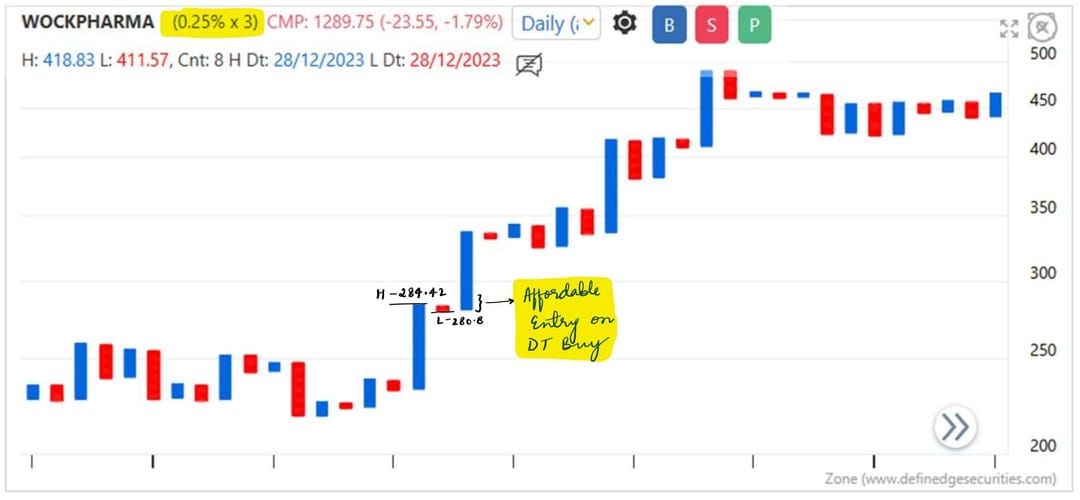
o High upswing volumes• 0.25% Box Size –
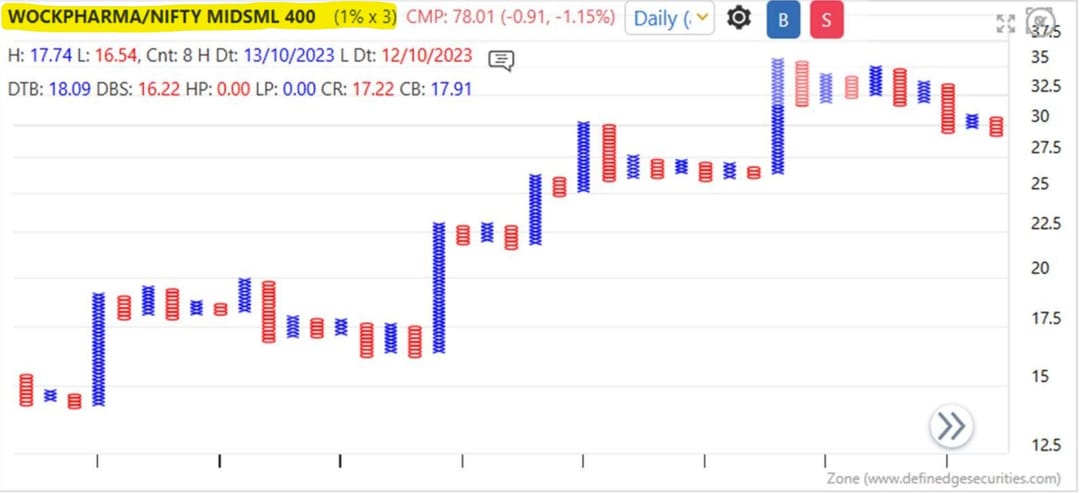
o Flag• RS Chart on 1% Box Size –
o Anchor follow through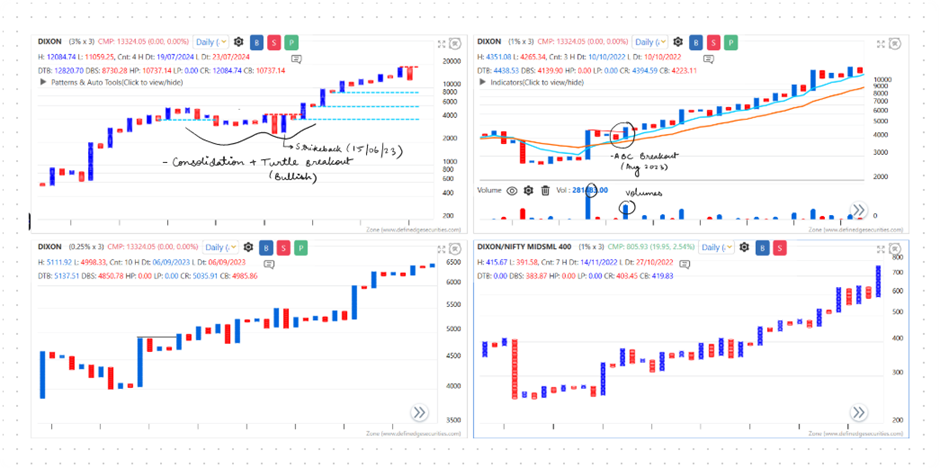
-
• 3% Box Size –
o Base Formation and breakout
o Anchor follow through near breakout• 1% Box Size –
o Anchor Column
o Close > 08EMA>21EMA
o High upswing volumes• 0.25% Box Size –
o Super pattern providing affordable entry• RS Chart on 1% Box Size –
o Anchor follow through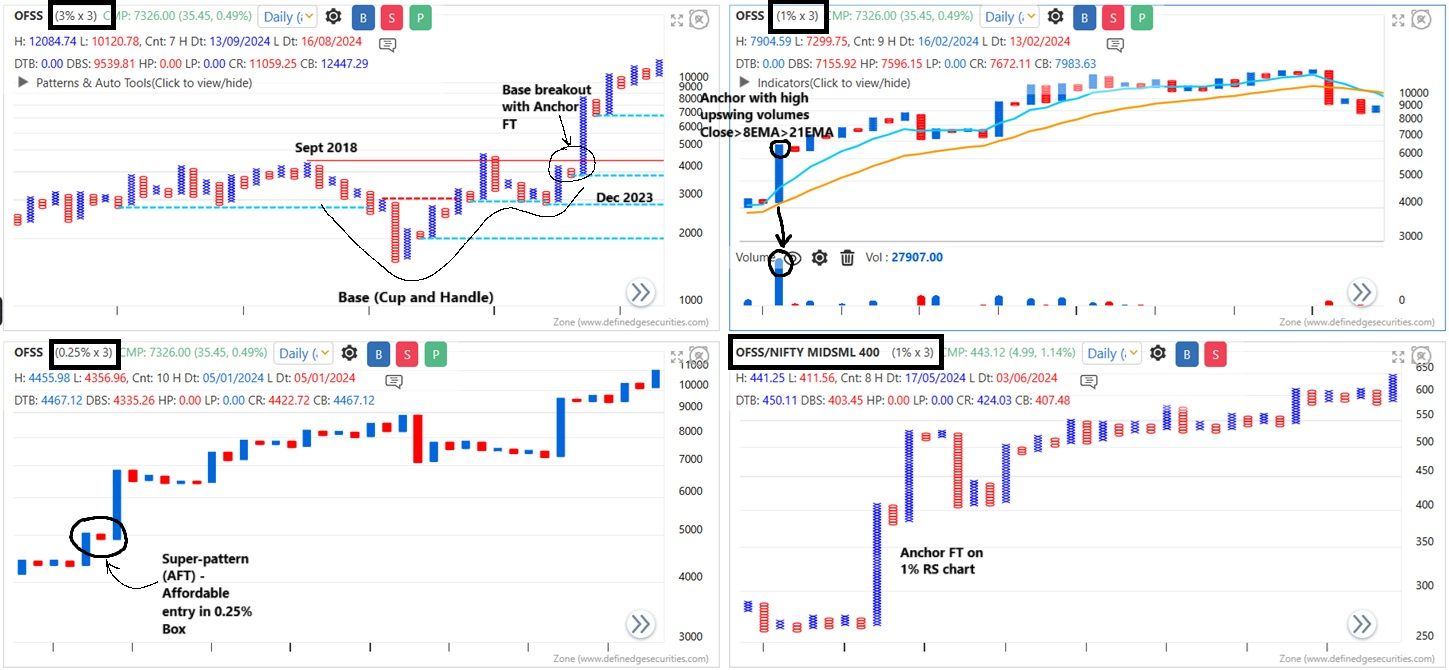
-
3% box - Anchor column(10)
1% box - Anchor FT
Closing price > 8EMA > 21EMA
Large upswing volumes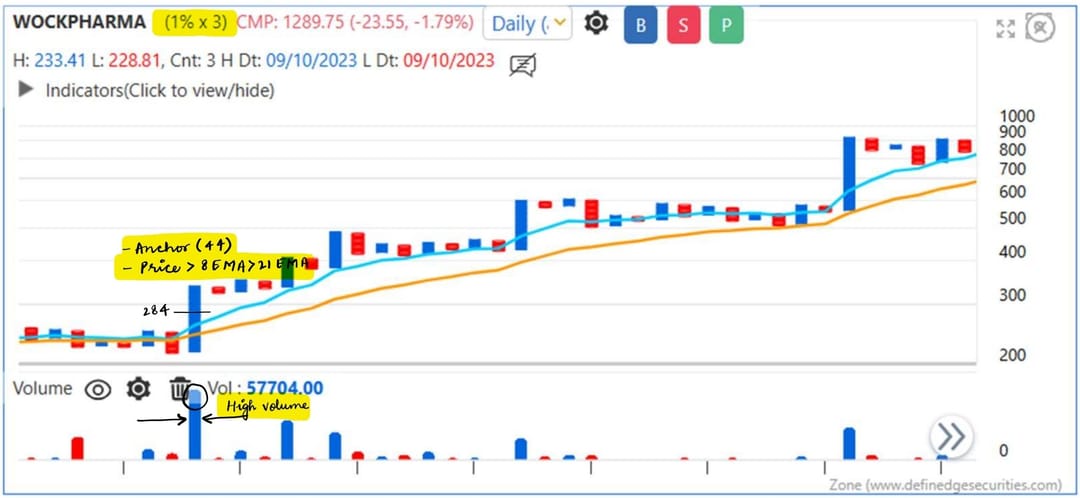
0.25% box - Anchor FT
1% RS chart - Anchor FT
-
-
3% box - Anchor column(10)
-
1% box - Anchor FT
Closing price > 8EMA > 21EMA
Large upswing volumes -
0.25% box - Flag pattern + Basing
-
RS chart - Anchor FT

-
-
-
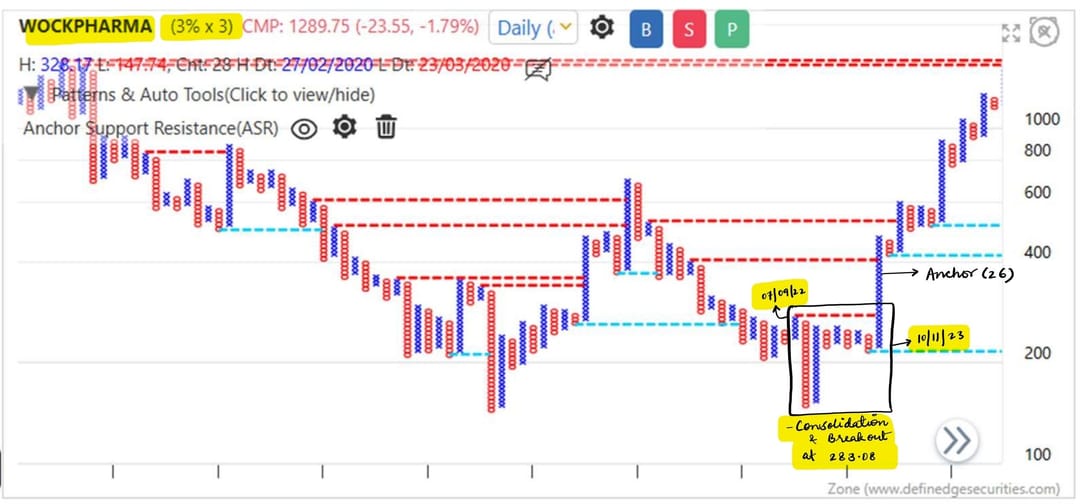
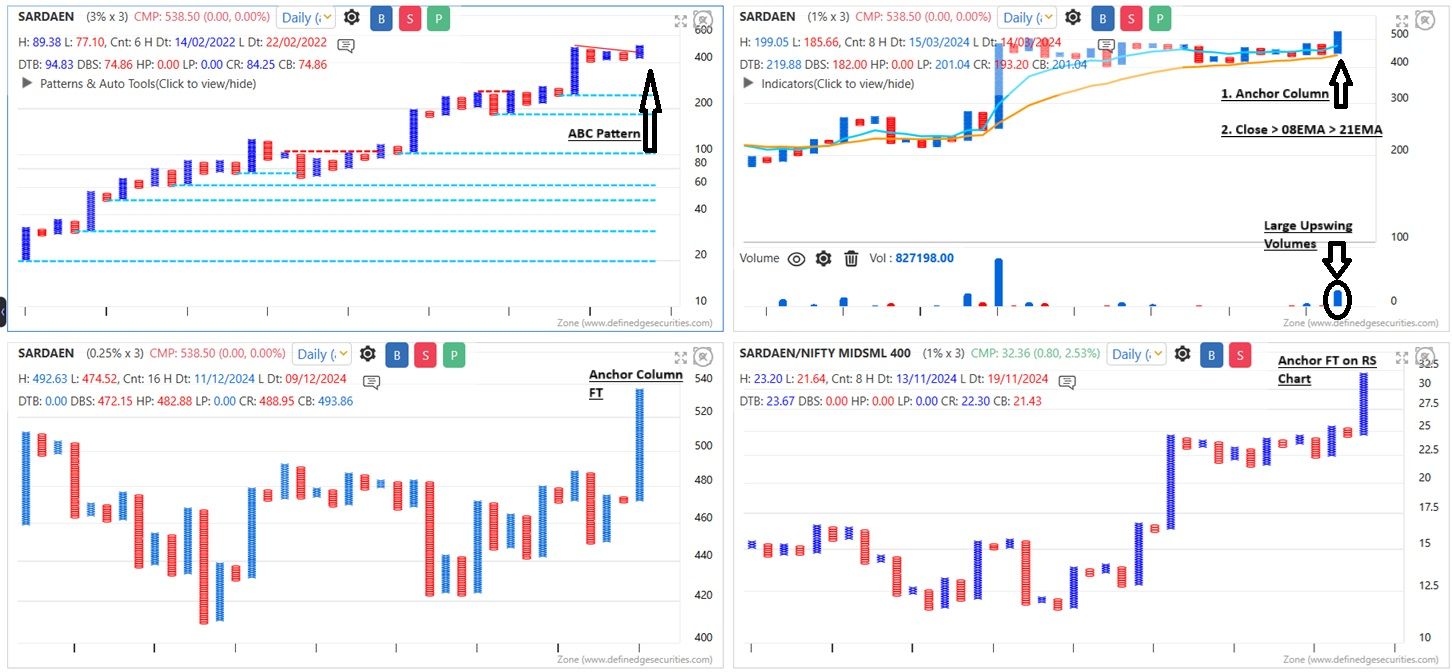
3% box - Bullish ABC
-
1% Box - a. Anchor Column
b. Close > 21EMA
c. High upswing volume -
0.25% Box - Anchor FT
-
1% RS with Nifty MidSmall400 - Anchor FT
-
-
Learning to study and filter out stocks using multiple box size charts (3%, 1% and 0.25%) analysis.
Also the concepts of relative strength of a stock wrt the broader market (Nifty 500) are being tested.
Comments are welcome.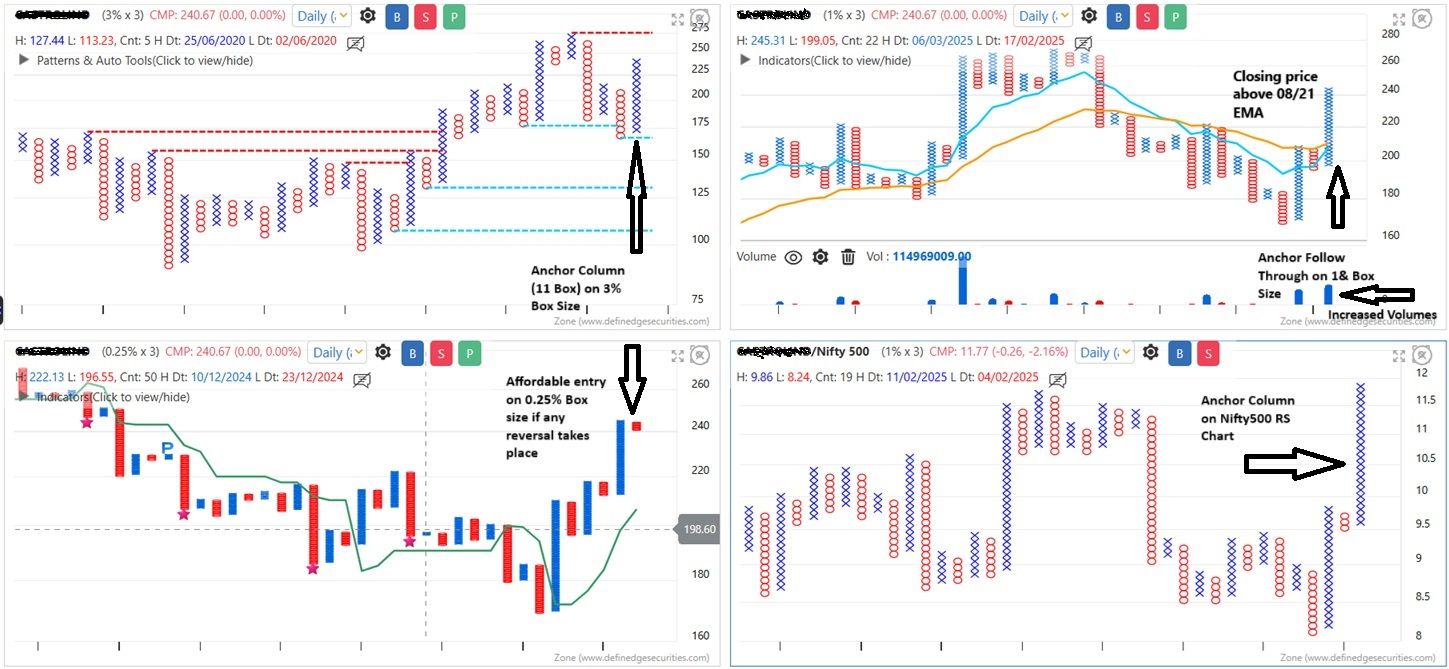
How to Identify Leading & Lagging Sectors in the Current Market Scenario, Tue, 08 Apr, 2025
Past Winners 2024 - Dixon
Past Winners 2024 - OFSS
Past Leaders - WOCKPHARMA
SRF Limited
Sarda Energy & Minerals Ltd
Multiple Box Size Analysis With Relative Strength