still no response? let me know how can I know in detail about this feature. It's very interesting feature and want to explore.
R
Rajesh Khadkikar
Pro User
All Replies
-
-
which timeframe or box value we are using for Demap intraday ?
-
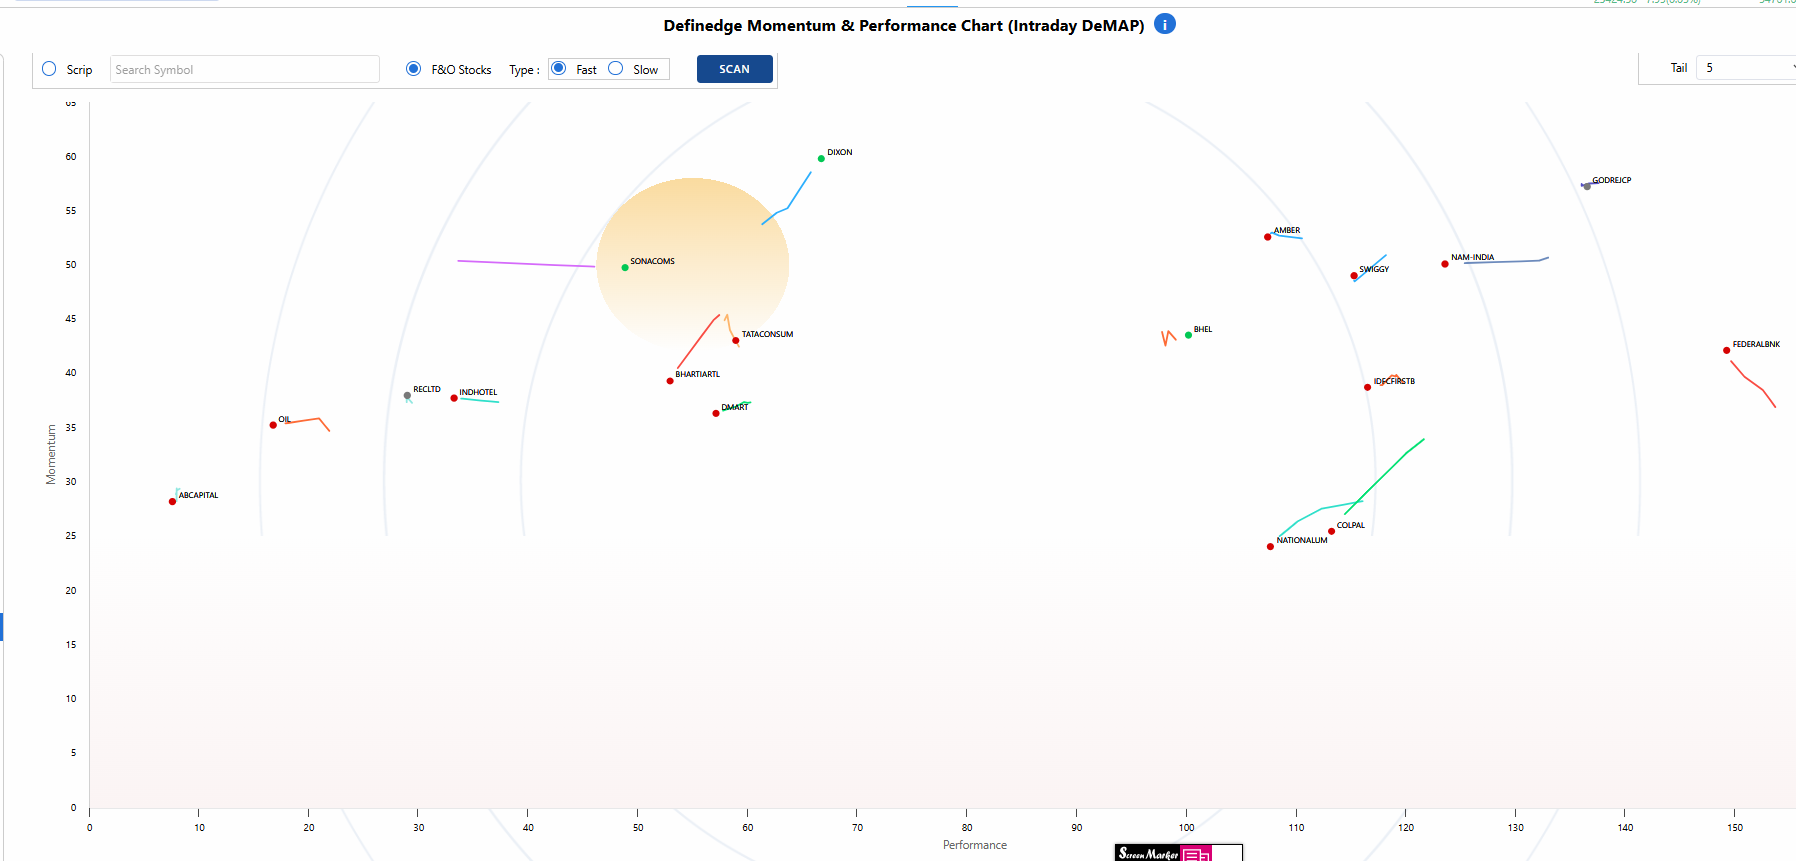
this feature seems interesting and I want to use it for intraday trading. can you please explain how to use Intraday Demap feature
Thank you
-
I need to set my favourite template as a default template in tradepoint desktop. can you please guide me
-
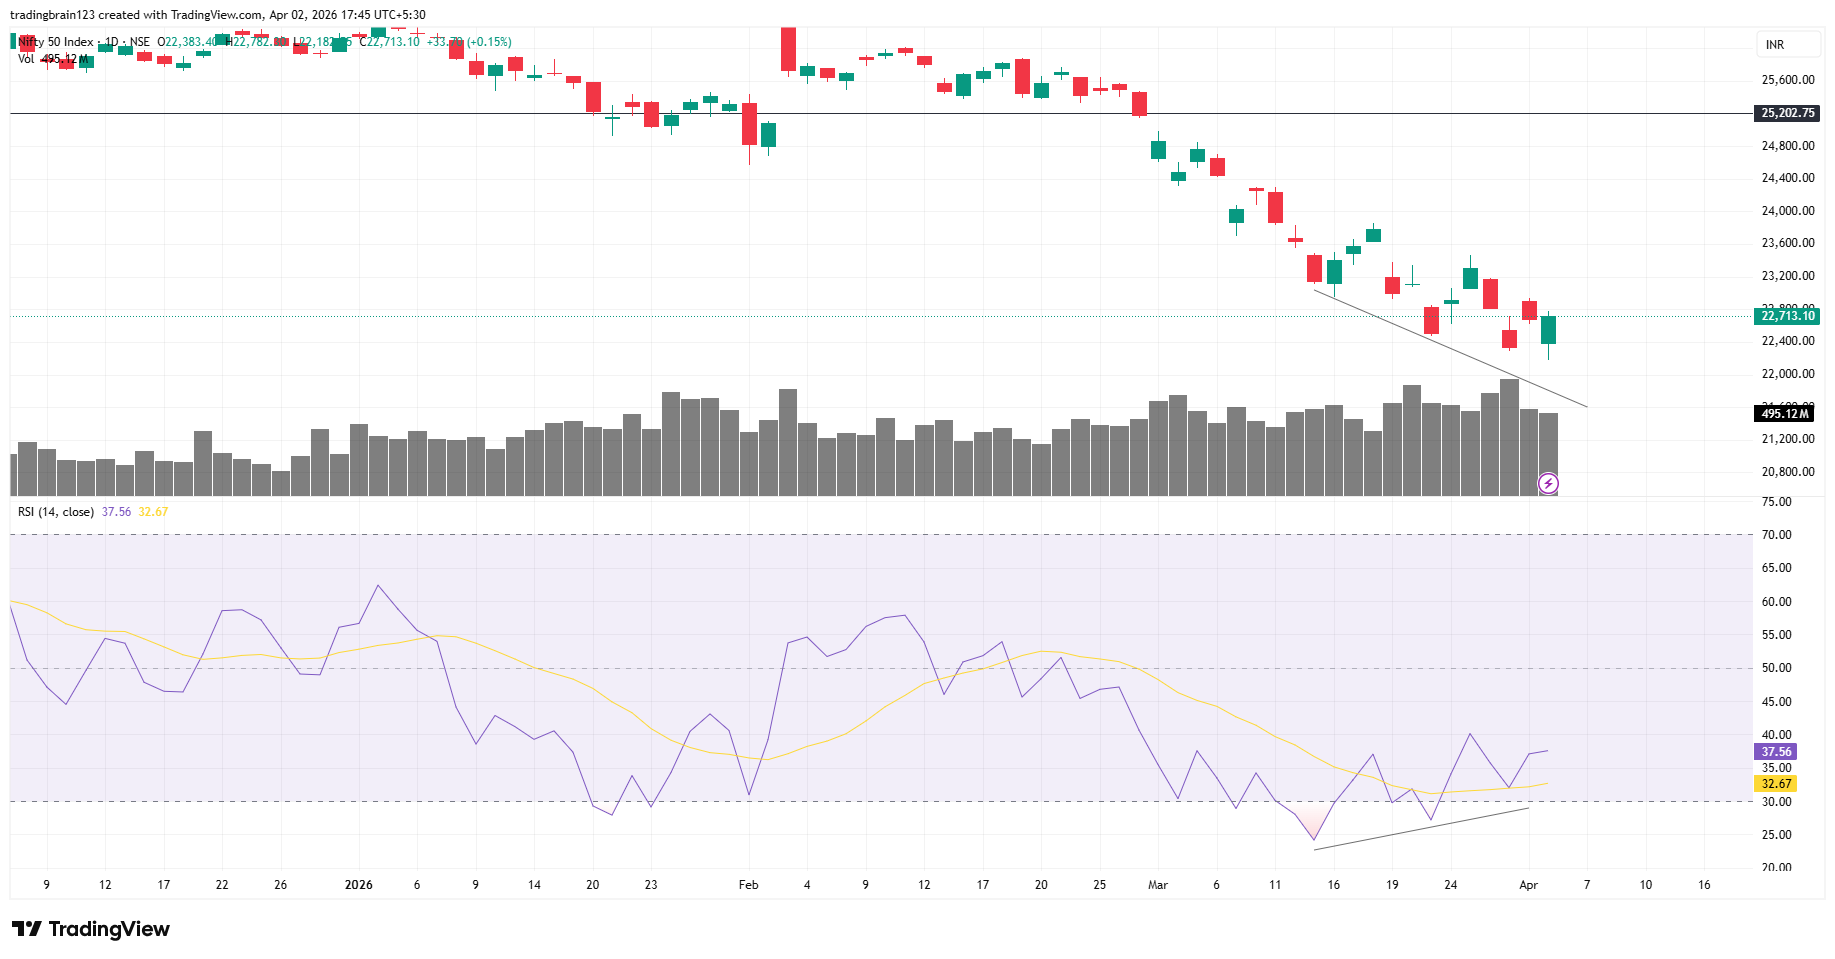
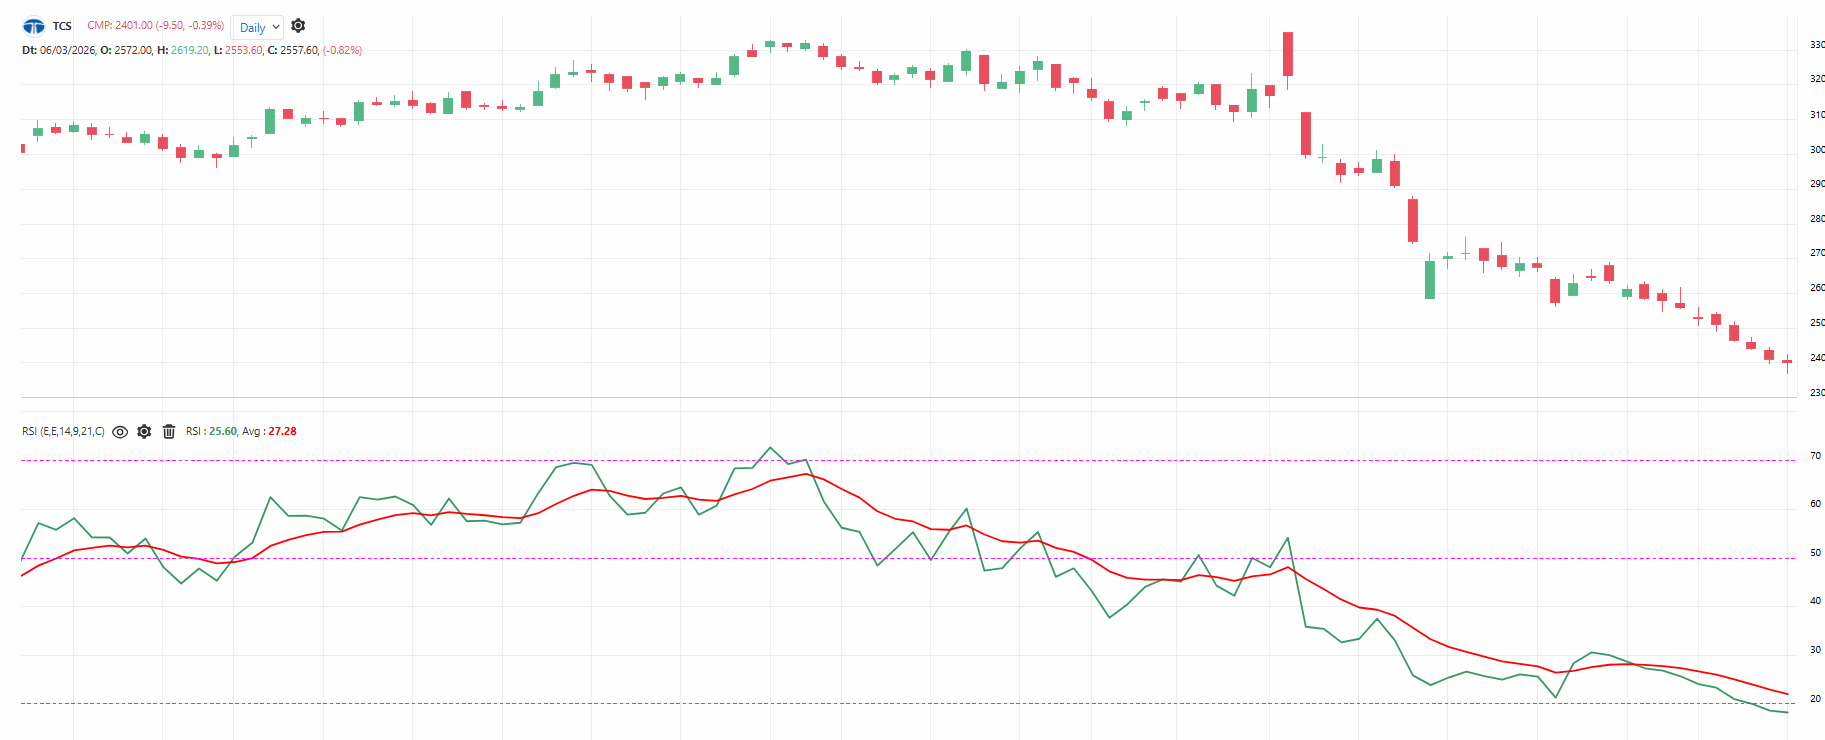
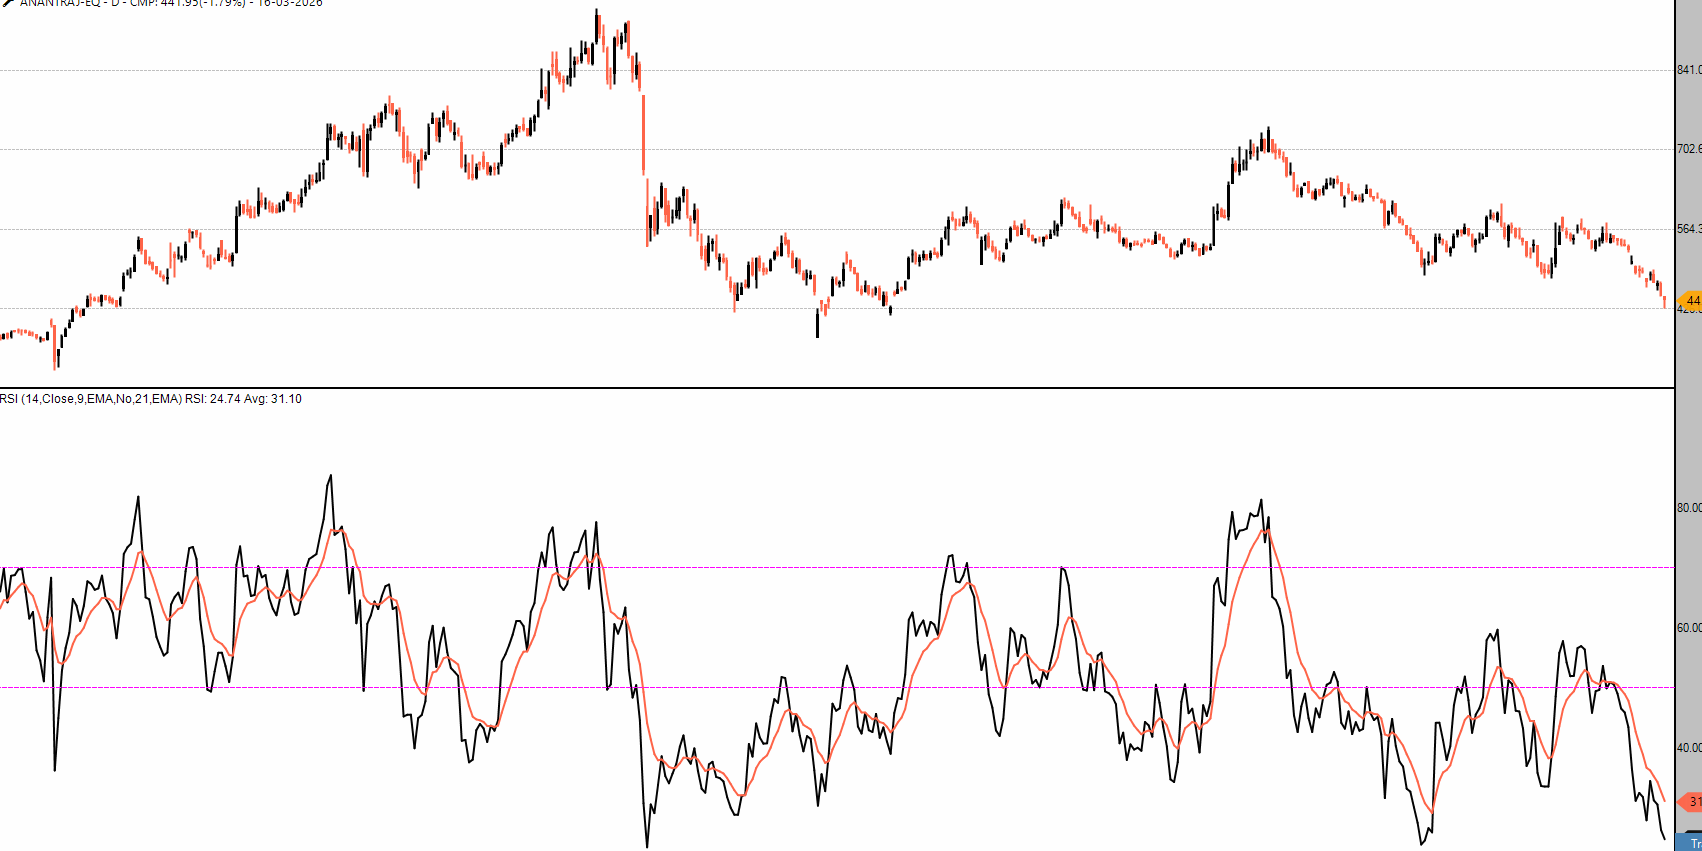
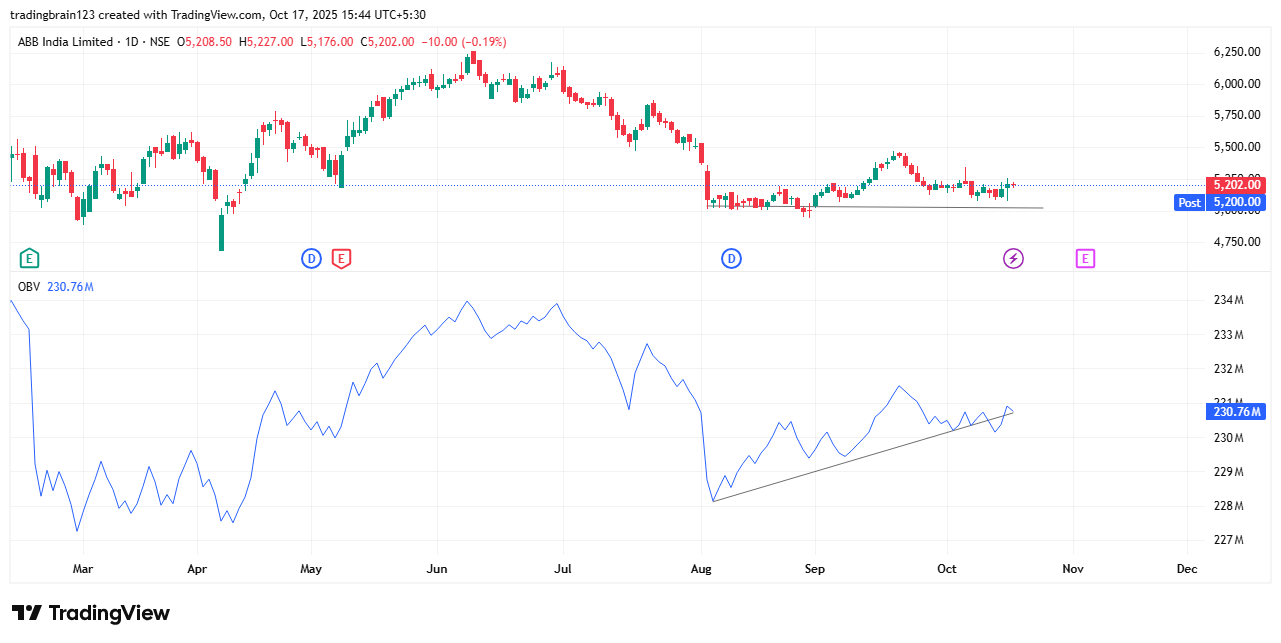
I noticed that drawing trendlines and SR lines on indicators like RSI can significantly improve buy/sell decisions. Can you please Enable 'Trendline' and 'Horizontal Line' tools within indicator panes.
just like this.
-
Here In zoneweb I can see 3 pink dotted lines of RSI but In trade point desktop lower line can't see. I can only see RSI 50 and 70 line. please suggest the way.
-
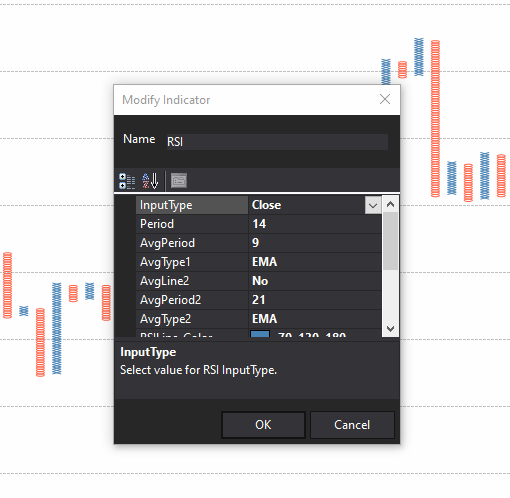
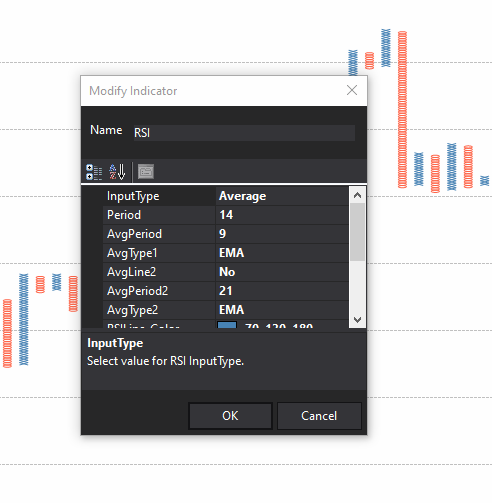
please check above screenshots. in RSI indicator on P&F chart, should I use average or close in the input tab. because P&F based on closing price. if so then why average option has given
-
Checking intraday breadth in ready report is very good option but it's only limited for nifty 50 and nifty 500. can you please make it available for all sectors
-
@Radhakanta Samantara it's tradingview screenshot I want the same in trade point or zone
-
It's tradingview screenshot
-
-
I am trying to learn OBV and some other indicators and want to find out the relation between indicator and price.I need to draw some trendlines and S/R lines in indicator area but I couldn't. please let me know how can I do that
-
Please guide me
how to draw horizental line/support resistance line,trendline on indicators on tradepoint or Zone -
@Yogesh Varhadpande Thanks a lot, actually it was hidden behind the taskbar, thanks again sir
-
Hello Sir,
It's difficult and time consuming to check every breadth chart one by one.
can you please make available breadth chart in the breadth scanner. same like we do in price scanner.Thanks
-
@Prasiddh-Shroff Sir, I can't see DeMAP section in Rzone. Please suggest the ways to solve this issue
-
I can't see Demap section in Rzone, did I miss something? please suggest
-
Prashant Shah sir discussed very nicely about how money moves from different assets, like equity, commodity, currency and bond. so I am keen to know how to trade currency. please guide me how should I study currency market
-
Yes! it's really a great solution to ride the trend. @Brijesh-Bhatia Sir explained the HA charting method in a beautiful and simple way. thanks a lot sir
-
Hi
can I get a dedicated video tutorial about how to use tradepoint Pro.
I was using Rzone premium and recently purchased tradepoint pro so need a video tutorial to use it effectivelyThanks
-
-
can you please describe D smart indicator and how to use the same on P&F indicator
-
I want to know the fees structure and when can I Enroll in this course called "Relative Strength & Breadth Analysis" course By Prashant Shah Sir
Please let me know any updates regarding this.Thanks & Regards
Rajesh N Khadkikar -
please guide me about how to use volume profile in point & figure chart in tradepoint
Can you please make a detail video or article about using intraday Demap
Can you please make a detail video or article about using intraday Demap
Can you please make a detail video or article about using intraday Demap
how to apply my favourite template as a default template in tradepoint desktop
Drawing trendline and support resistance lines on indicators
Should I use Input as a close or average for RSI indicator on P&F chart
Should I use Input as a close or average for RSI indicator on P&F chart
Intraday Breadth for all sectors
How can I draw trendline, horizental or vertical line on indicators
How can I draw trendline, horizental or vertical line on indicators
How can I draw trendline, horizental or vertical line on indicators
How can I draw trendline, horizental or vertical line on indicators
how to draw horizental line/support resistance line,trendline on indicators on tradepoint or Zone
Query : some meaning in DeMAP
Please make available Breadth chart in Breadth scanner
Query : some meaning in DeMAP
Query : some meaning in DeMAP
can someone please guide, how to trade currency,commodity
Mastering trends with Heikin Ashi
Tradepoint Pro tutorial
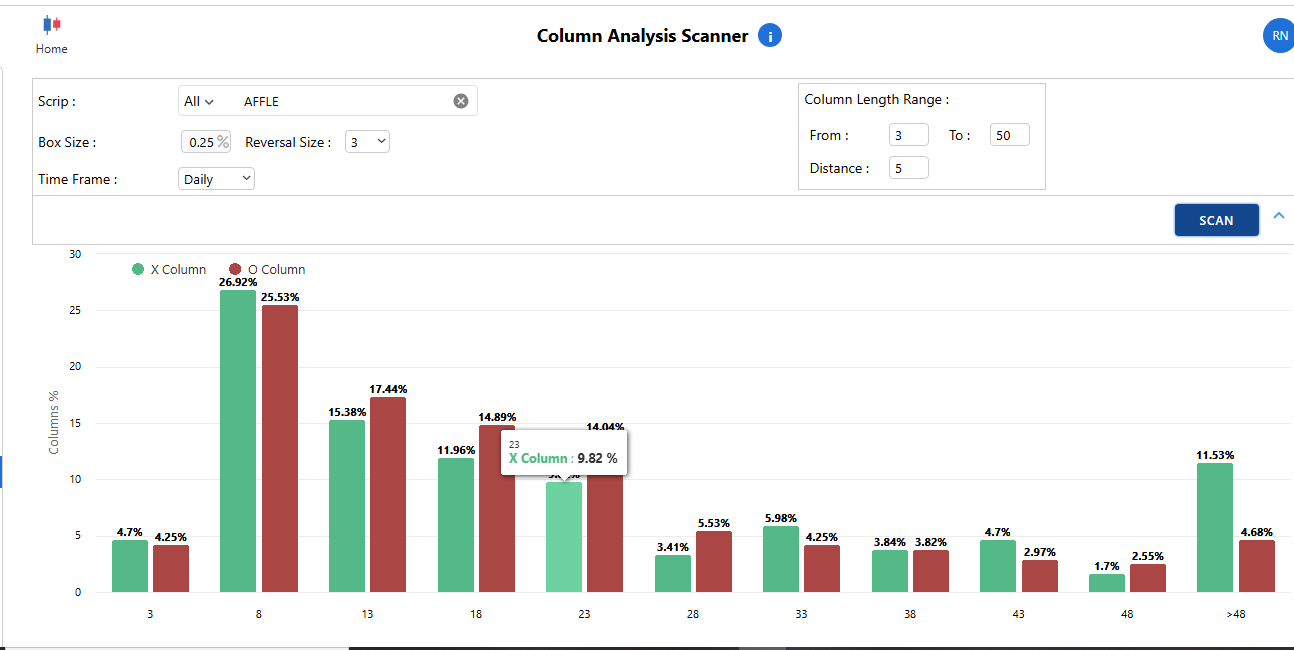
What is Column Analysis scanner and what does it tell us
D smart indicator
Any updates about Relative Strength and Breadth Analysis course by Prashant Shah Sir
How to use volume profile tool in tradepoint software