There is a group "All Stock Options - ATM". Can similar group be made available for "Options Liquid Futures Top 50 - ATM". It will be a great help.
Ravi Shinde
Pro User
All Replies
-
-
Dear Sir,
Under historical charts in Opstra, we currently have an option to use line chart or a candlestick chart. It will be helpful to add Renko charts as well. It will be a great help.
Ravi
-
Traders often fall into a trap when they look at charts in hindsight and see perfect entries and exits. The mind starts imagining how much more money could have been made, and this pushes the trader into profit maximization thinking instead of process thinking. The brain begins to believe that it should catch the full move every time, even though that is only possible on past charts, not in real trading. When the focus shifts to outcomes, emotions take control. You feel happy when a trade goes your way, upset when it doesn’t, and the worst feeling comes when you book profits and the price keeps rising without you. To avoid this emotional pain, traders keep changing indicators, tweaking settings, and searching for a perfect system that never loses. But this search never ends because such a system simply does not exist. The market is driven by probability, not perfection, and trying to force accuracy through profit maximization only creates more fear, more greed, and more disappointment.
When you backtest a system, the real test is simple: Are you satisfied with the returns? Can you handle the losses? Can you sit through the drawdowns without losing discipline? If yes, then just follow the system. Don’t try to increase the profits or remove the losses, because there is always a trade-off. You cannot have everything—more profit usually means bigger drawdowns, and smaller drawdowns usually mean less profit. Optimization is not about making the system perfect; it is about making it workable for you, based on your own execution skills and emotional strength. Many traders get influenced by someone else’s great results and try to copy their system, only to fail because they are not built for it. Every trader has done this at some point. Real optimization is about improving your process, not chasing better outcomes. It matches the probabilistic nature of the market and builds discipline over time. If you commit to this process and accept it fully, your consistency will improve, and in the long run, this approach will outperform anything driven by fear, greed, or comparison. In the end, embrace optimization over maximization—it is the right path.
-
When your stop-loss is based on the end of the day , you should exit only at the EOD close. Some trades may give bigger losses than the actual sell signal because you wait till the EOD exit, but the reverse is also true some stop-losses may trigger during the day but won’t trigger on an EOD basis. If you follow the EOD stop-loss rule for a longer period, both situations will balance out and should work in your favor overall.
Easier said than done, it takes a lot of discipline and self-control. Another option is to trade using 75-minute charts with a larger box size, like 1.5%, which allows you to exit during the day. You can try that and see if it suits you, but I’d still suggest sticking to the EOD closing stop-loss.
-
Dear Team,
The Pnf/Renko charts of the indicator are available in Tradepoint desktop as of now. I request you to make those available in Rzone.
If possible, please see to it if we can use system builder for these charts like the price charts and use it for Auto Trader/ Super Algo.
Thanks in advance.
Ravi
-
Simple yet powerful setup.
-
Nice feature to place orders directly from the chart. Working smoothly since it is introduced. Thank you @Definedge team. -
Dear Definedge Team,
Request you to make the RSI divergence Conditions available in the system builder for renko Charts.
-
Good one Nish
-
You can try incognito mode to check if that solves the issue.
-
That's great. Looking forward for your observations.
-
Something like this
-
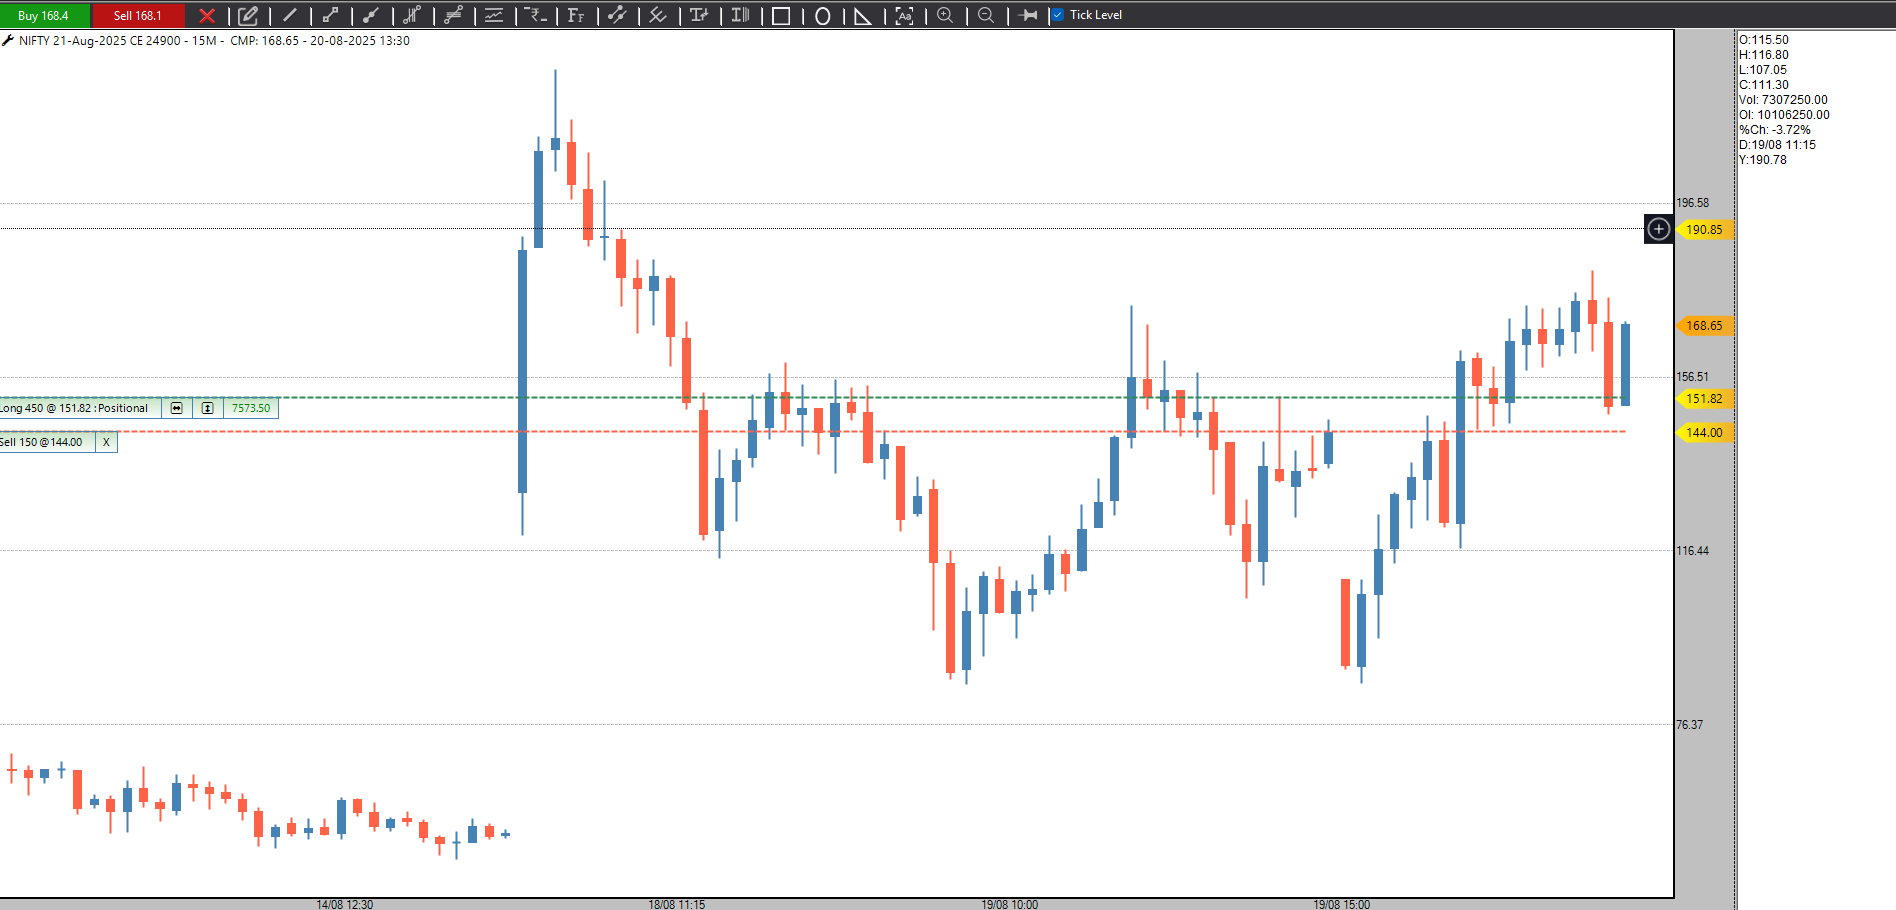
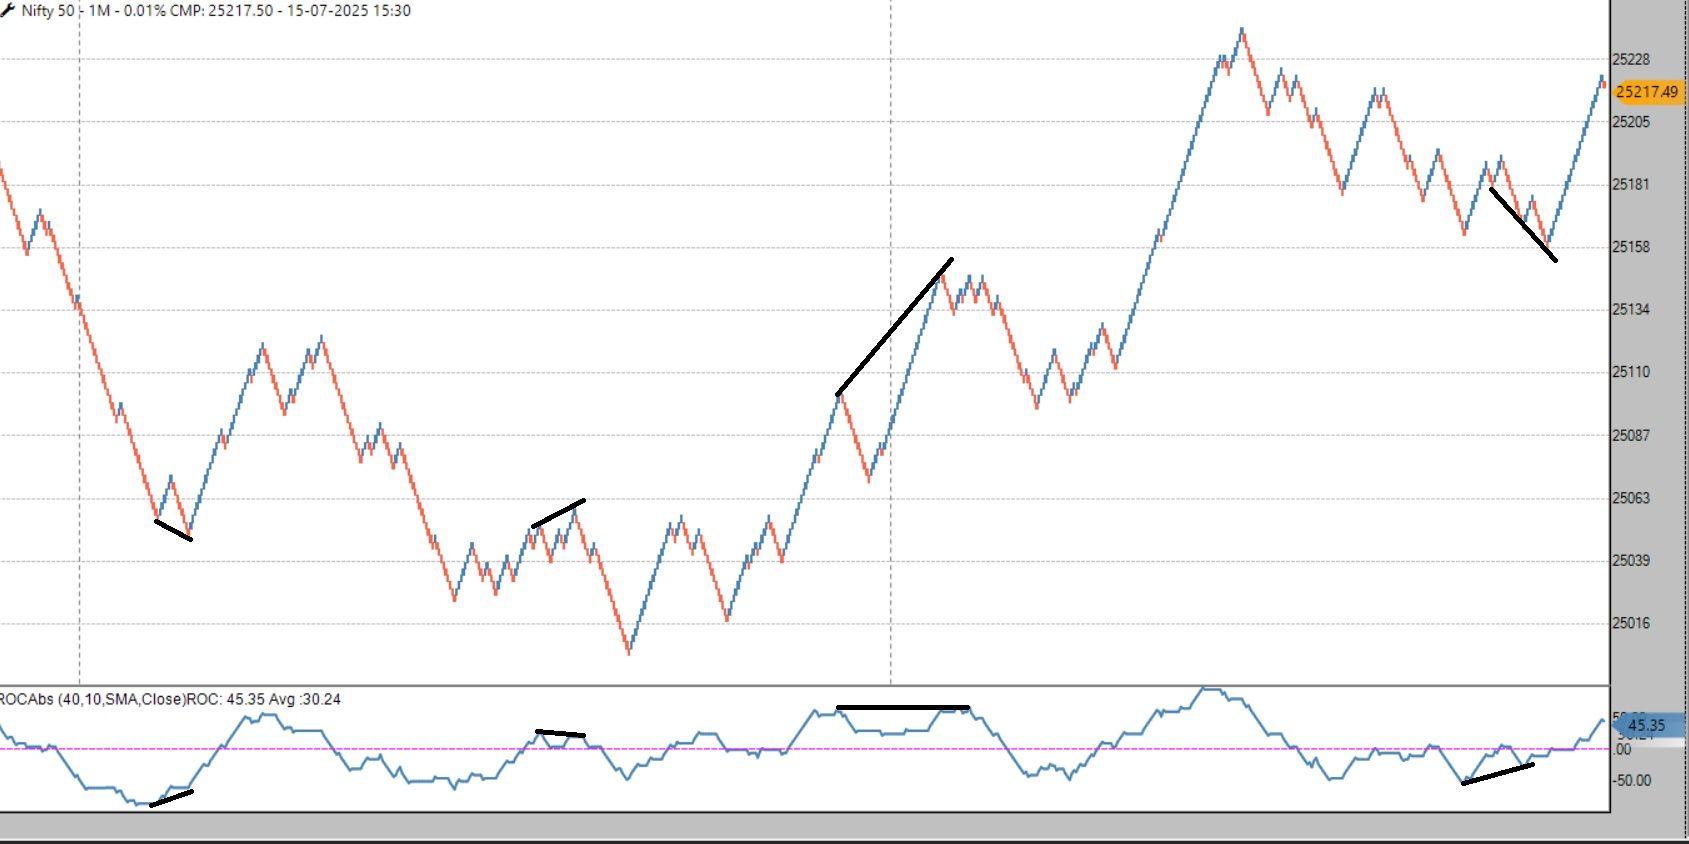
I don't usually trade based on divergence, but here is a suggestion that might help:
Try tracking divergence on the Nifty 50 chart instead of option charts. It gives earlier signals, so you can enter CE or PE before the move begins.
Option charts show more divergences because of volatile price action, which leads to too many signals. More trades often mean lower success rates.If you track divergence on Nifty 50 instead, the signals will be fewer but more reliable. Once the divergence is confirmed on the underlying, you can take an options trade using your own stop-loss criteria.
-
Good Execution
-
It’s strange how we get so attached to our current trades, even after doing many before. We really want each one to be a winner, and when it’s not, we often repeat the same mistakes.
What needs to change is our thinking. Just follow your trading plan and take the right steps — that’s enough.
Judge your success by how well you follow your plan, not by how many trades win. If you feel the need to be right, take a moment and focus on doing things the right way, not just on the result.
-
Dear Team,
Please tick charts available in Zone terminal and mobile app.
-
This research paper on the trend following reinforces my belief in prioritizing execution and risk management. While understanding the logic behind indicators is essential, using too many can lead to confusion and indecision. It’s better to choose one or two, learn them well, and focus on good execution.
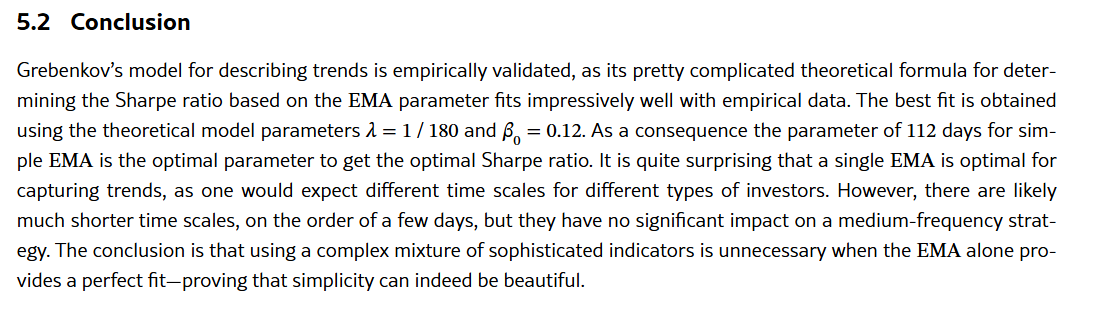
Link for the research paper. -
@Prashant-Shah I have planned 101 stock future trades with a strategy that I would design using this book. I will show it to you during the offline event and get your views on it. Looking forward.
-
Dear @Definedge Team,
I need Anchor Support resistance line breakouts for my entries and exits. It is not available in the system builder as of now. Please make it available as early as possible. -
I have started reading the book now. No doubt it will deliver more than my expectations. I must appreciate the QR codes for the charts. Very innovative and useful.
-
Thank you for this query. I did a small write-up using it.
-
I recently came across a request from a fellow trader to restart MKLH. He mentioned that MKLH can be particularly helpful during "uncertain times." That phrase "uncertain times"caught my attention. If uncertain times exist, then certain times must exist too, right?
But the market isn’t a place of certainties. It’s a game of probabilities, not guarantees. What we often refer to as uncertain times usually means periods of high volatility or when the market moves counter to our natural bias—like a bearish phase for someone who’s typically bullish.
While most traders are aware of volatility and the various market phases, very few truly accept them, and even fewer adapt to them.
The reality is, anything can happen at any time—regardless of whether we label it a “certain” or “uncertain” period. A trade can fail for any number of reasons, and it's often not even worth overanalyzing why.
Every day in the market is uncertain. The only way to survive is by trading a system with positive expectancy, combined with proper position sizing and risk management. And then, repeating that process consistently.
Before trading any system, one must understand its worst-case scenario—how many consecutive losses it can endure—and ensure they're mentally and financially prepared to stick with it. Imagine hitting that losing streak right at the start. Could you keep going?
Position sizing, risk management, and repetition—that’s the real holy grail.
-
Correct
-
Yes. 20 period.
-
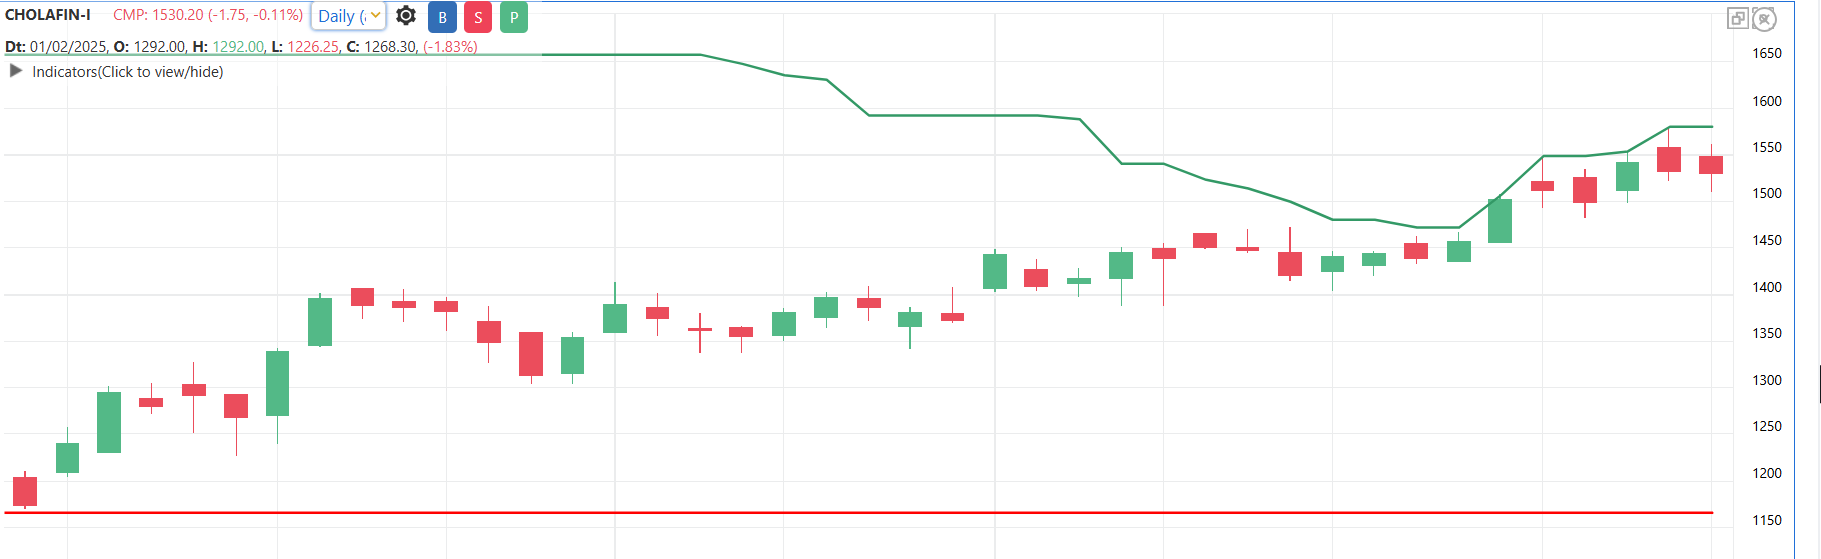
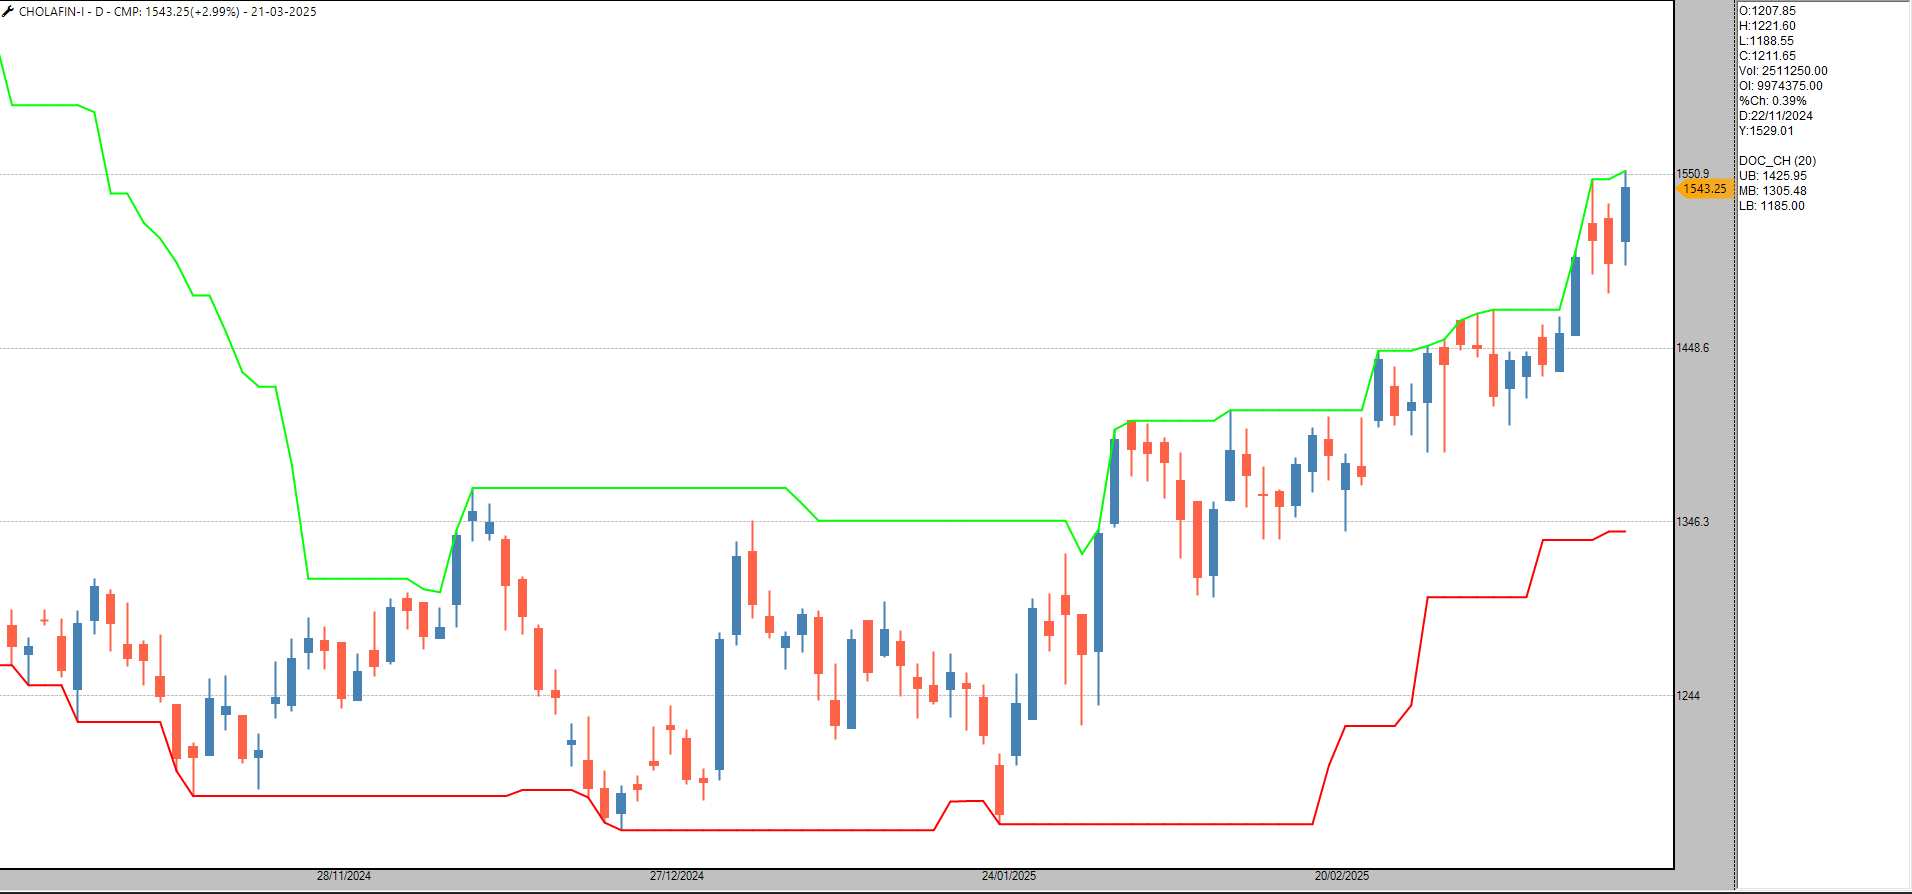
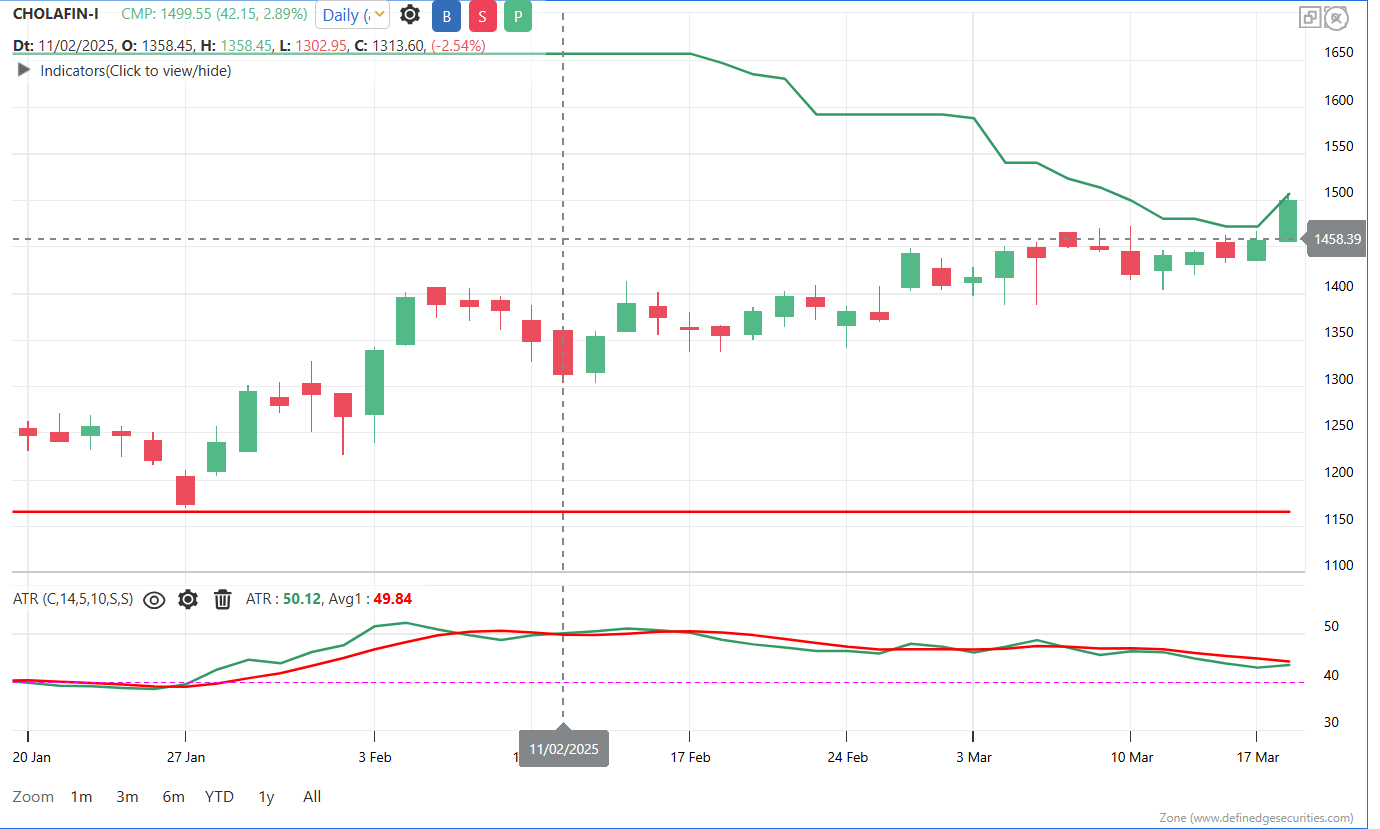
The stock closed @ 1524 on the expiry. I got 52 points in this trade. -
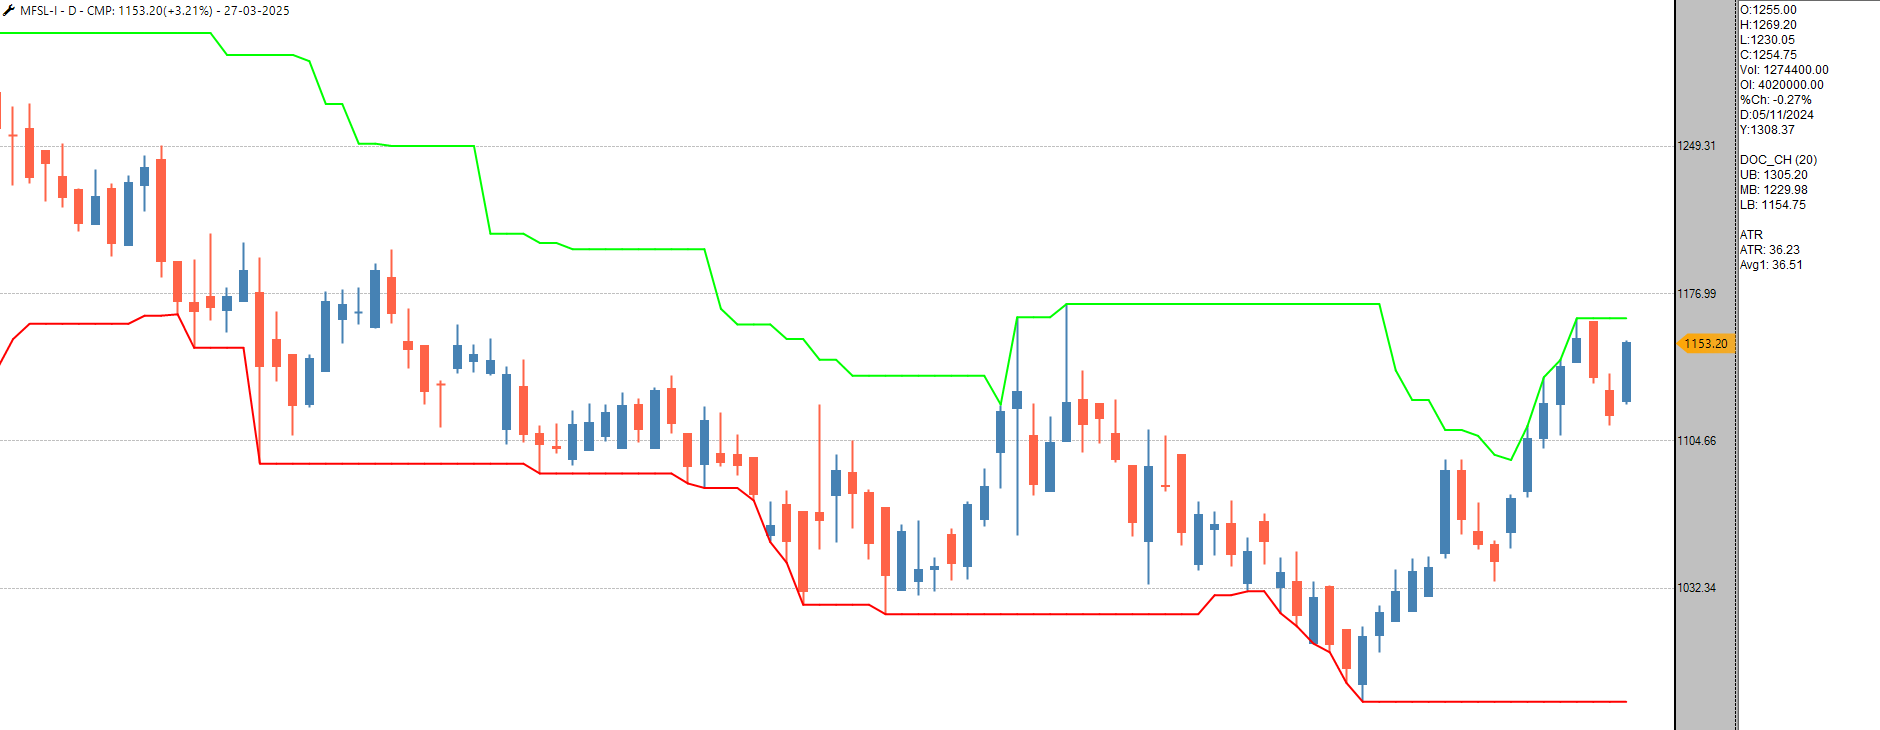
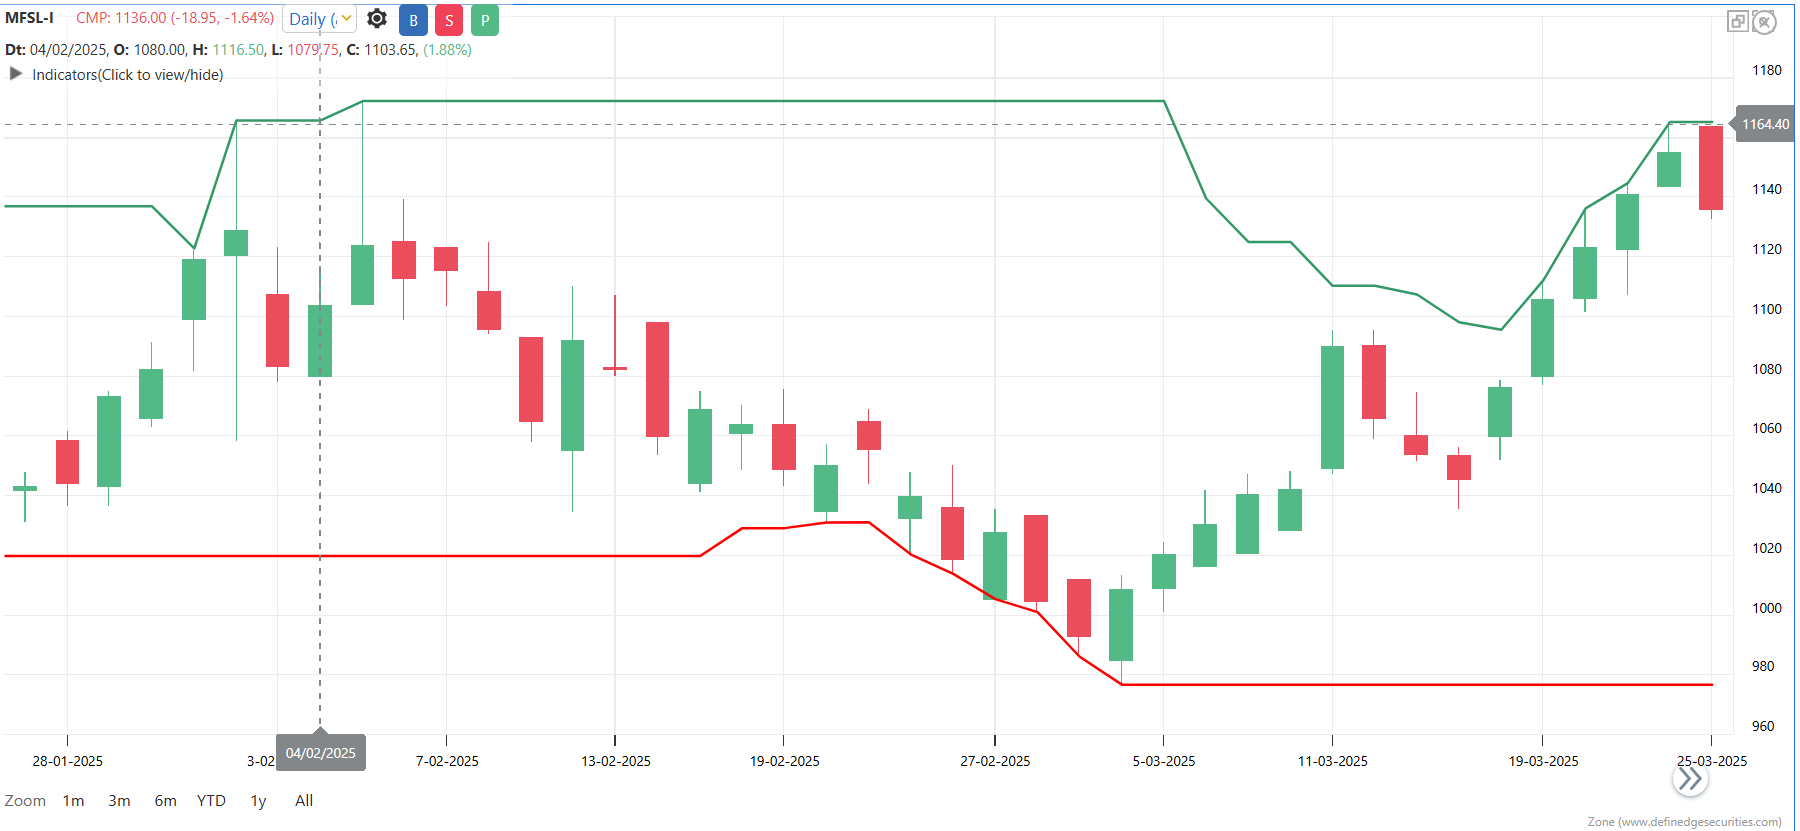
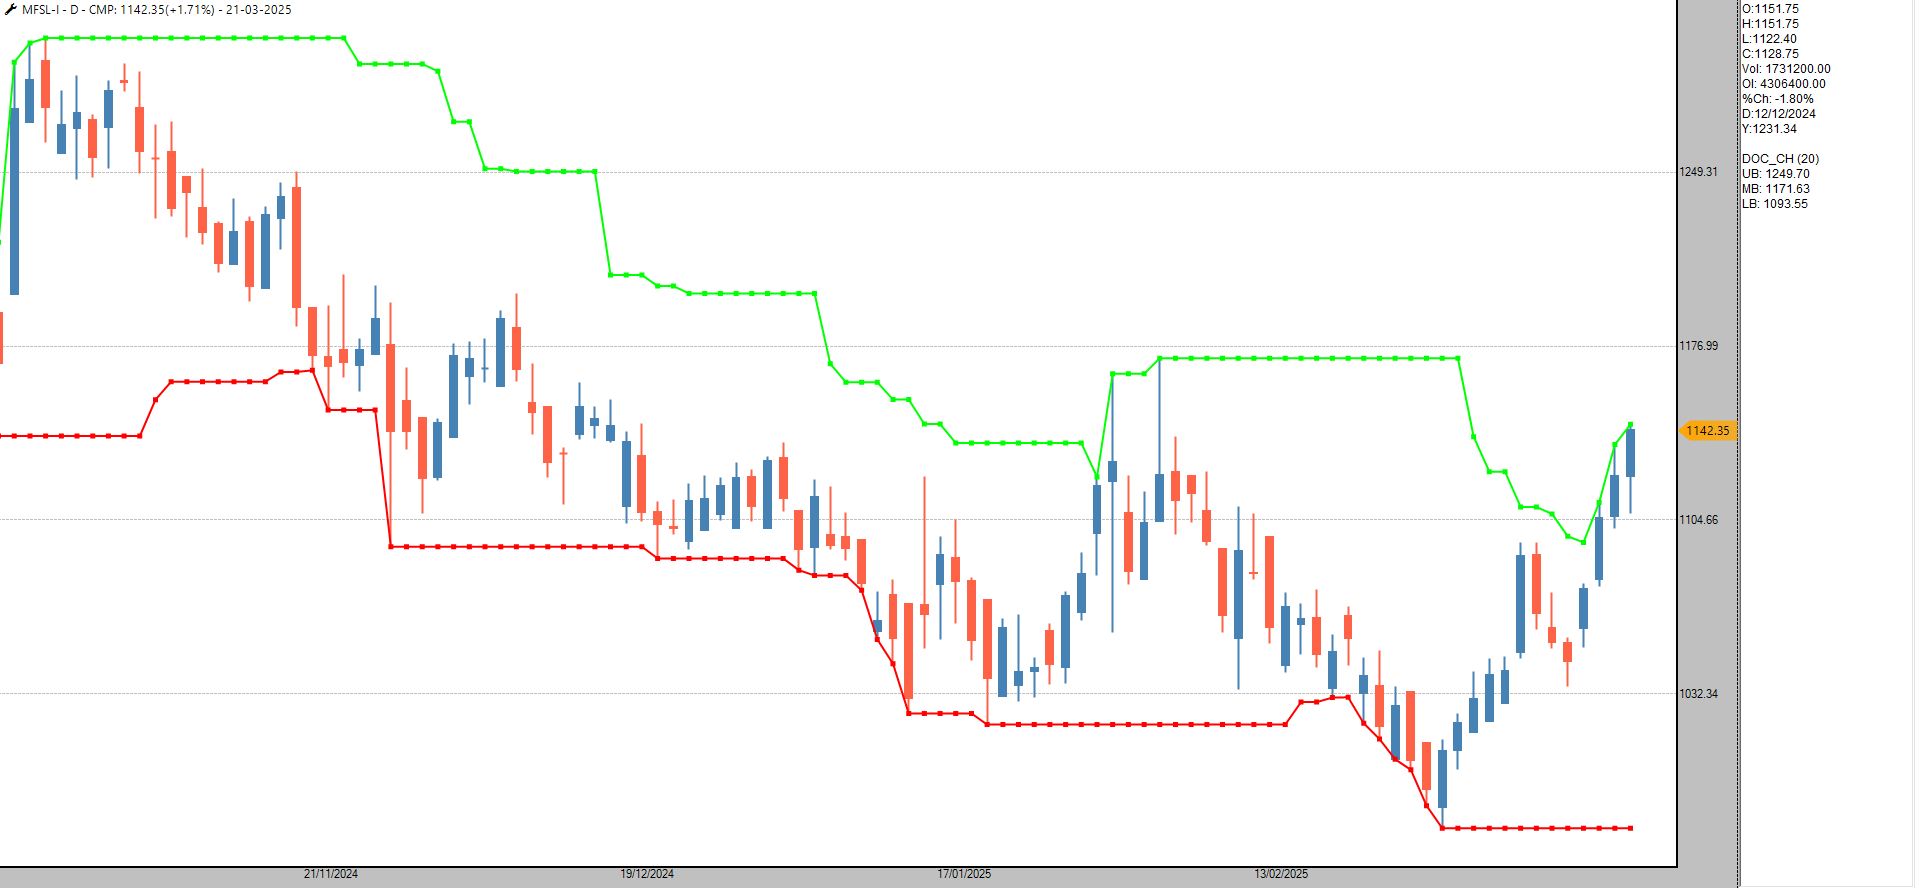
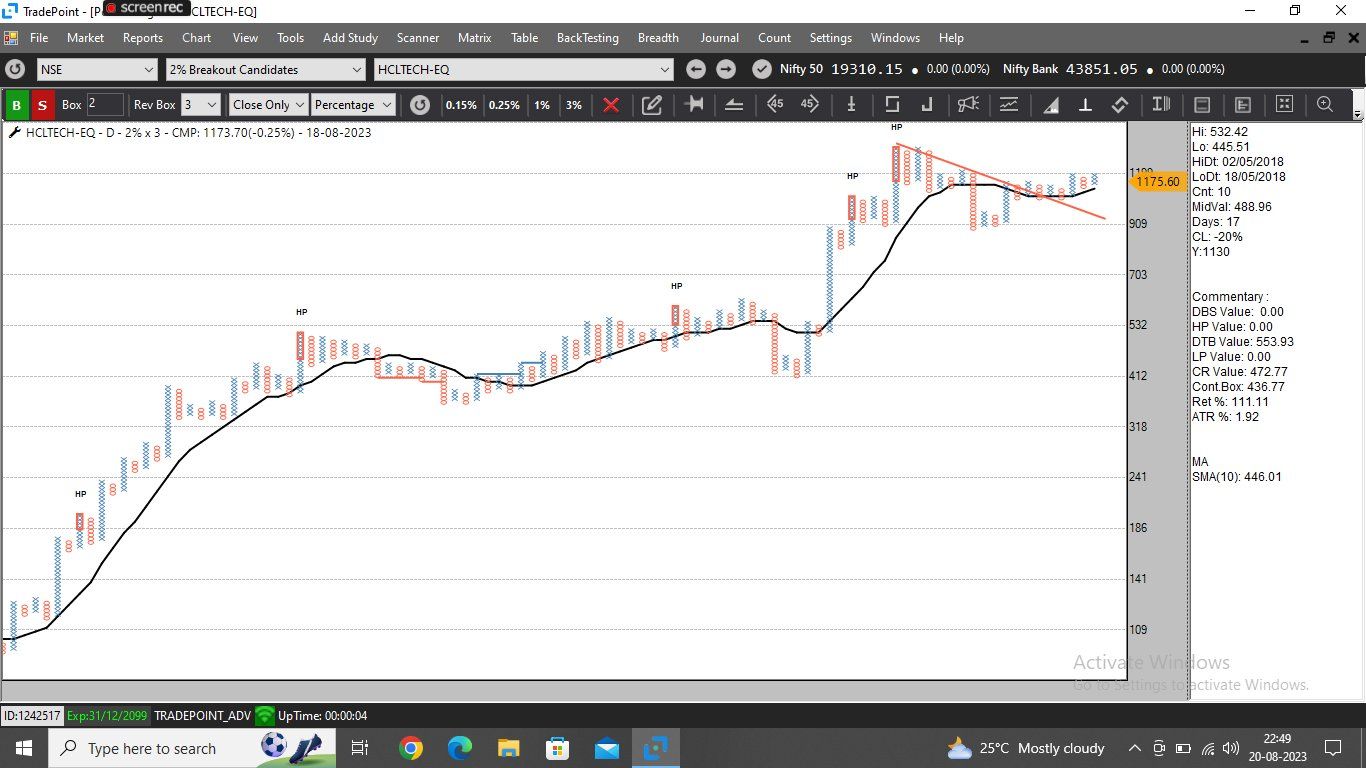
The Stock closed 3.21% in my favor @1153. I got 55 points in this trade. Closed the trade on the expiry. -
Dear Team,
My request is to have an indicator based exits even if the entry is not indicator based. For eg, I enter on MAST breakout but I want to exit on Bollinger band lower band breakout, I should be able to set the indicator based SL.
Ravi
-
The stock closed -1.6%. The SL remains same. -
The stock is -0.11% down. The SL remains same. -
Both the CE and PE charts were above 20 hour low hence I did not initiate the trade. I will take the trade whenever setup occurs.
-
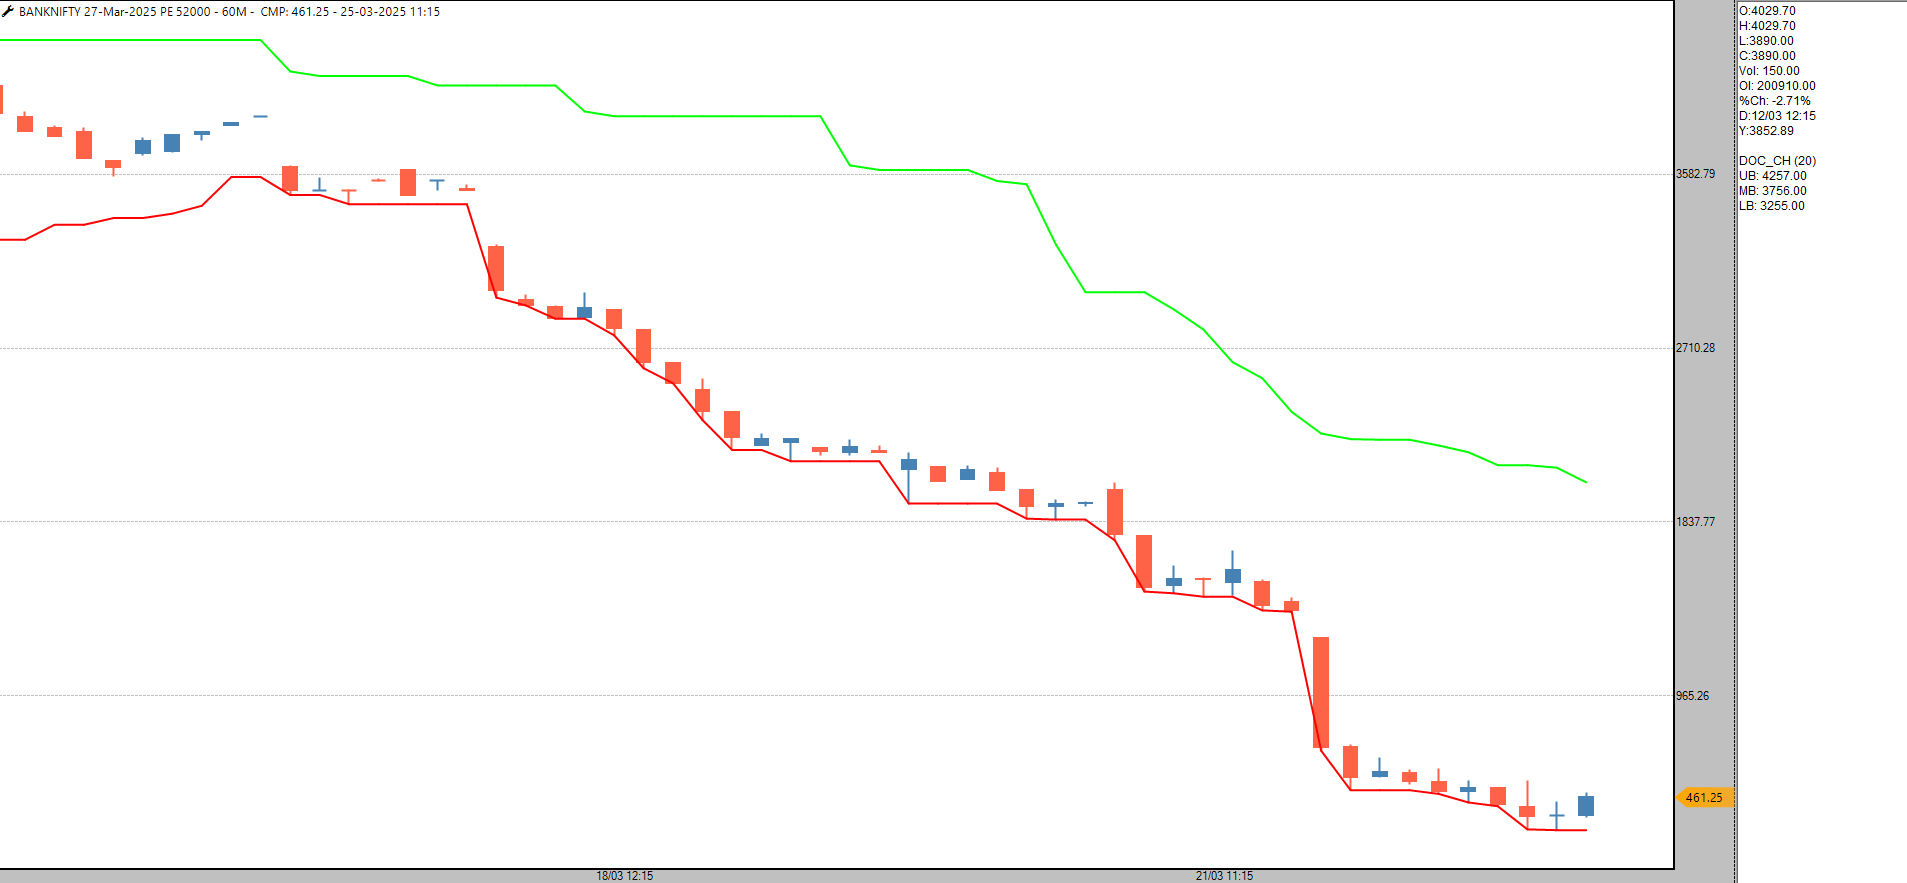
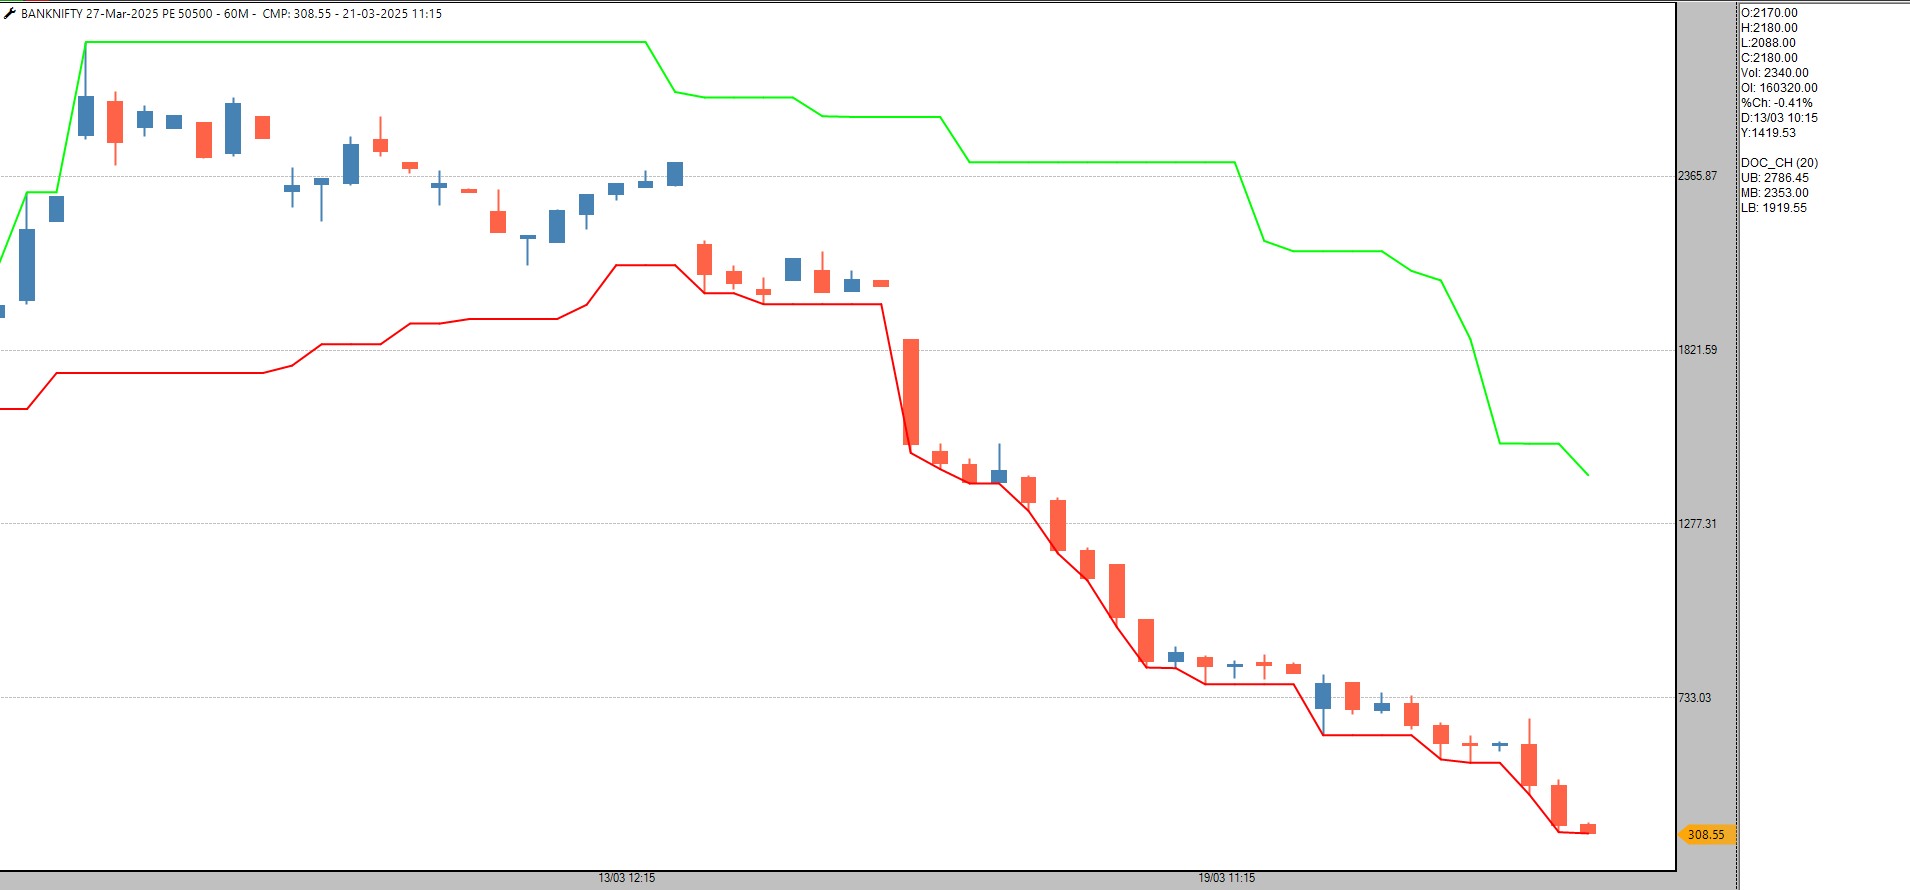
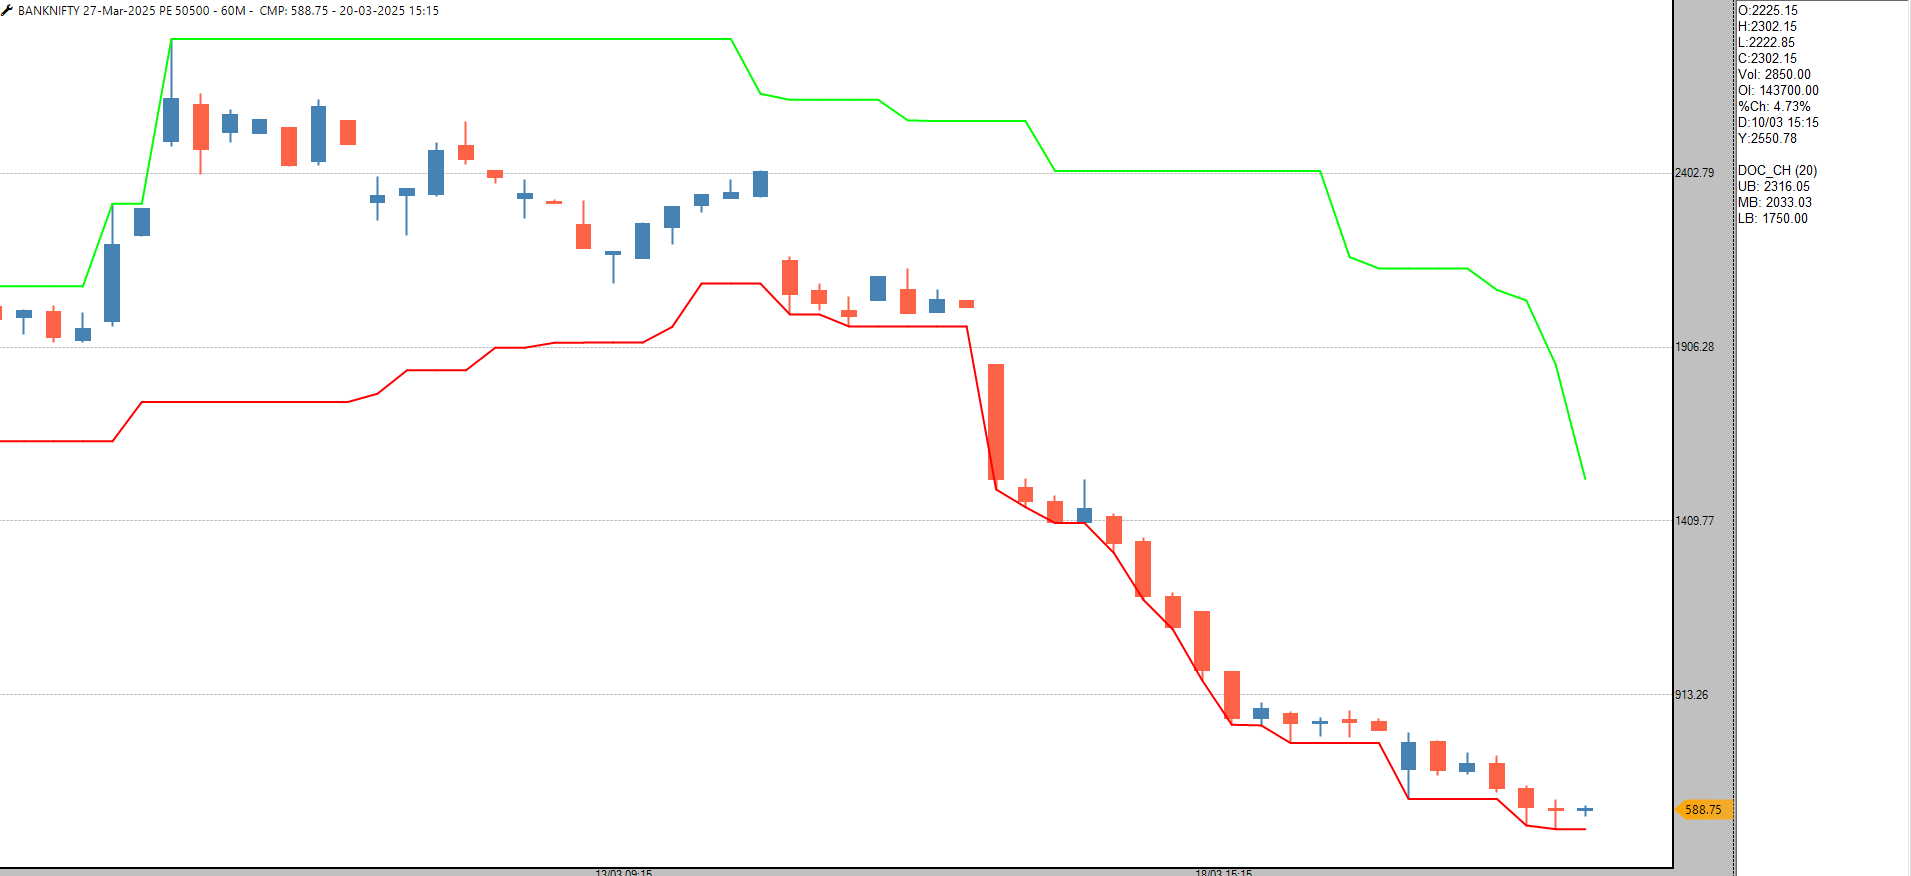
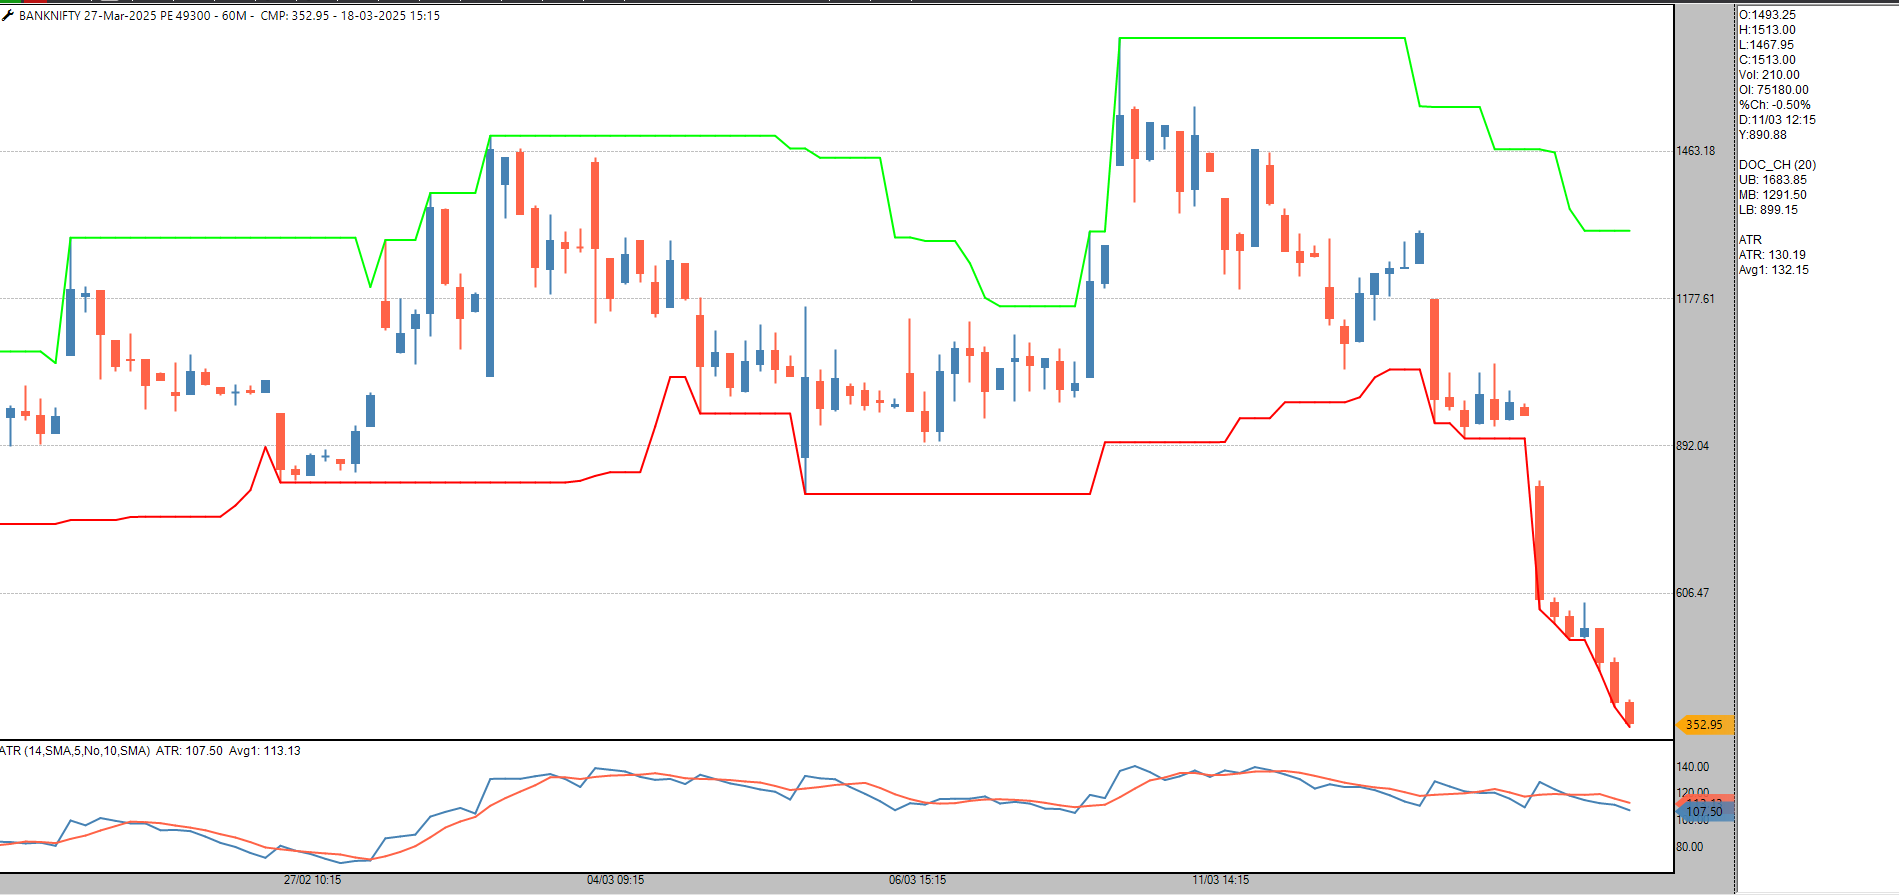
The price made a low of 291 and hence my trailing SL was 485 which triggered now hence i exited the trade. I will sell one ITM CE/PE which breaks the 20 hour low first.

-
The Price made a low of 345 today. I have moved my trailing SL to 575 to maintain a 1:1.5 RR -
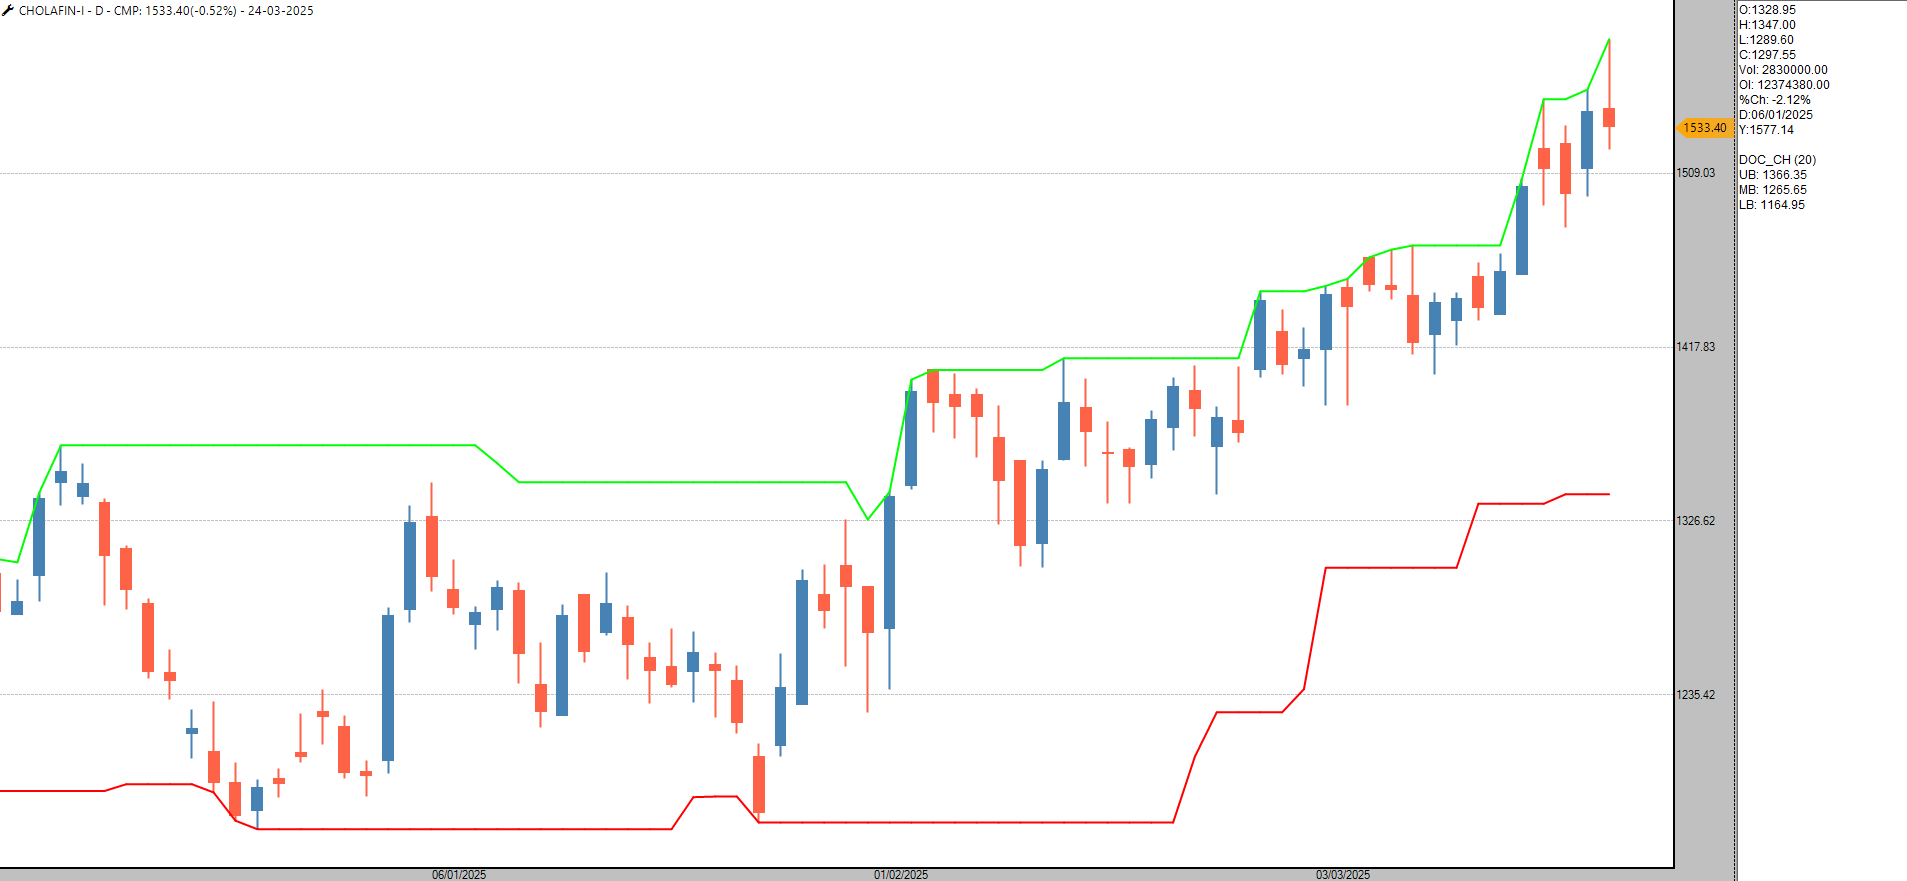
The stock is down -0.52%. The SL is at cost. -
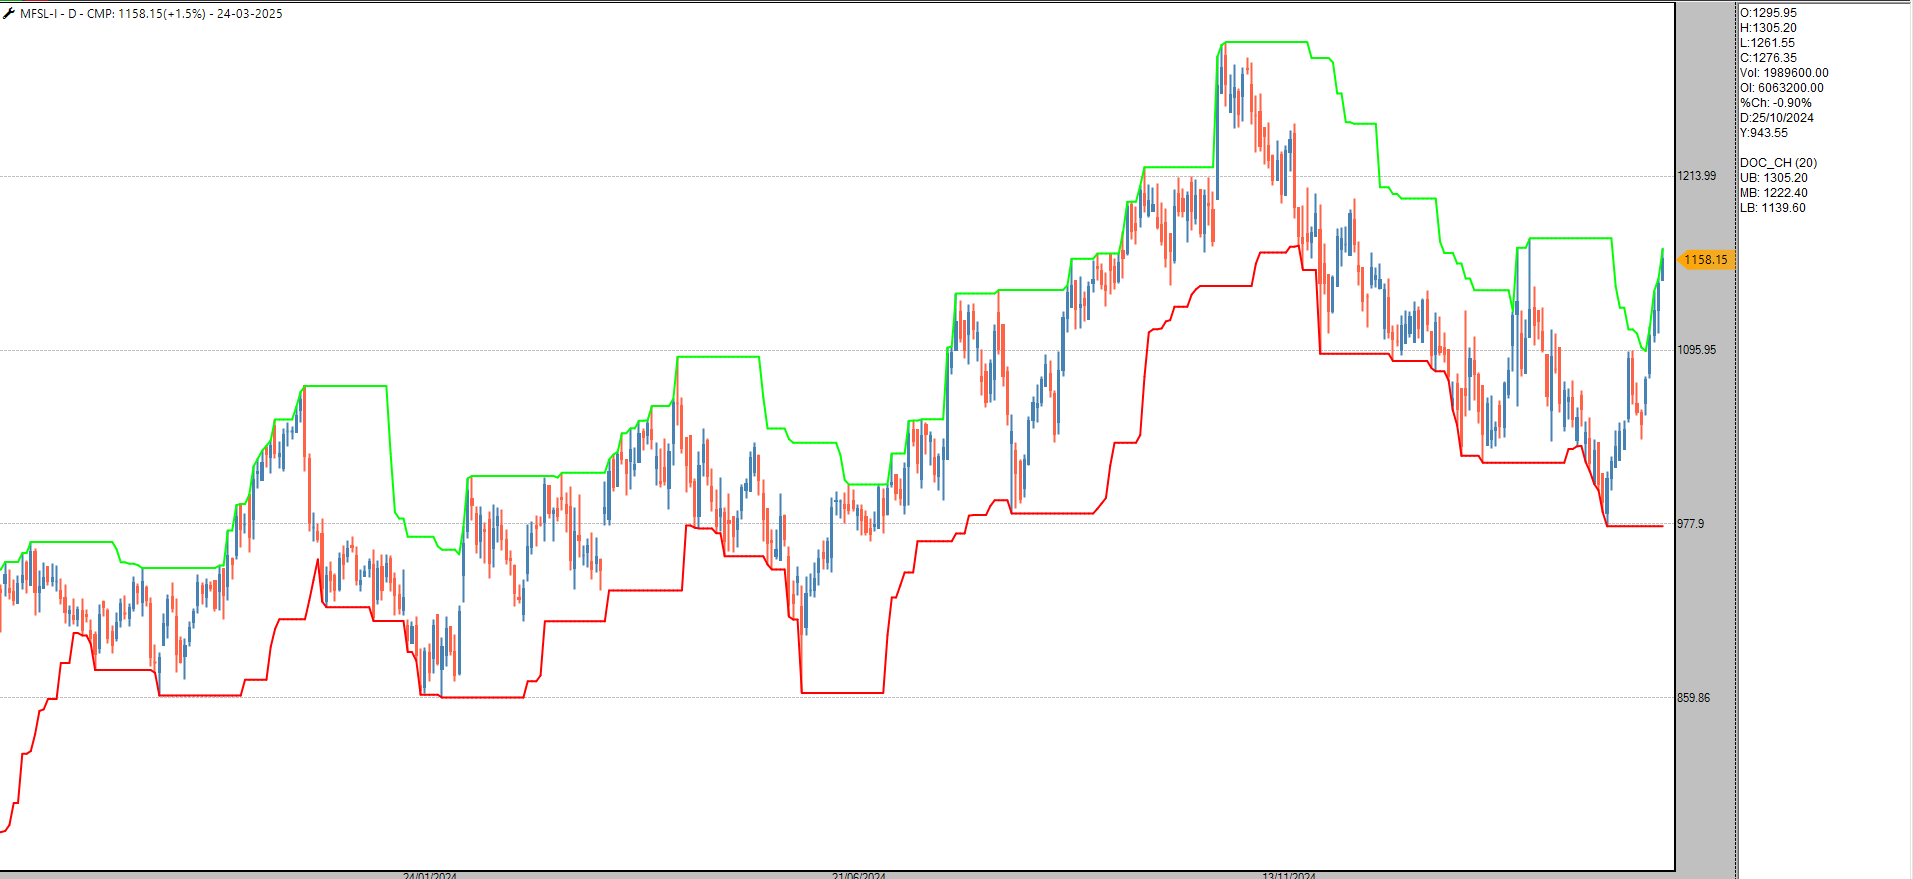
The stock has closed 1.5% in my favor. The SL is at cost.
-

The Price closed at 420. The low was 410 hence my trailing SL to maintain a 1:1.5 RR is 685. -
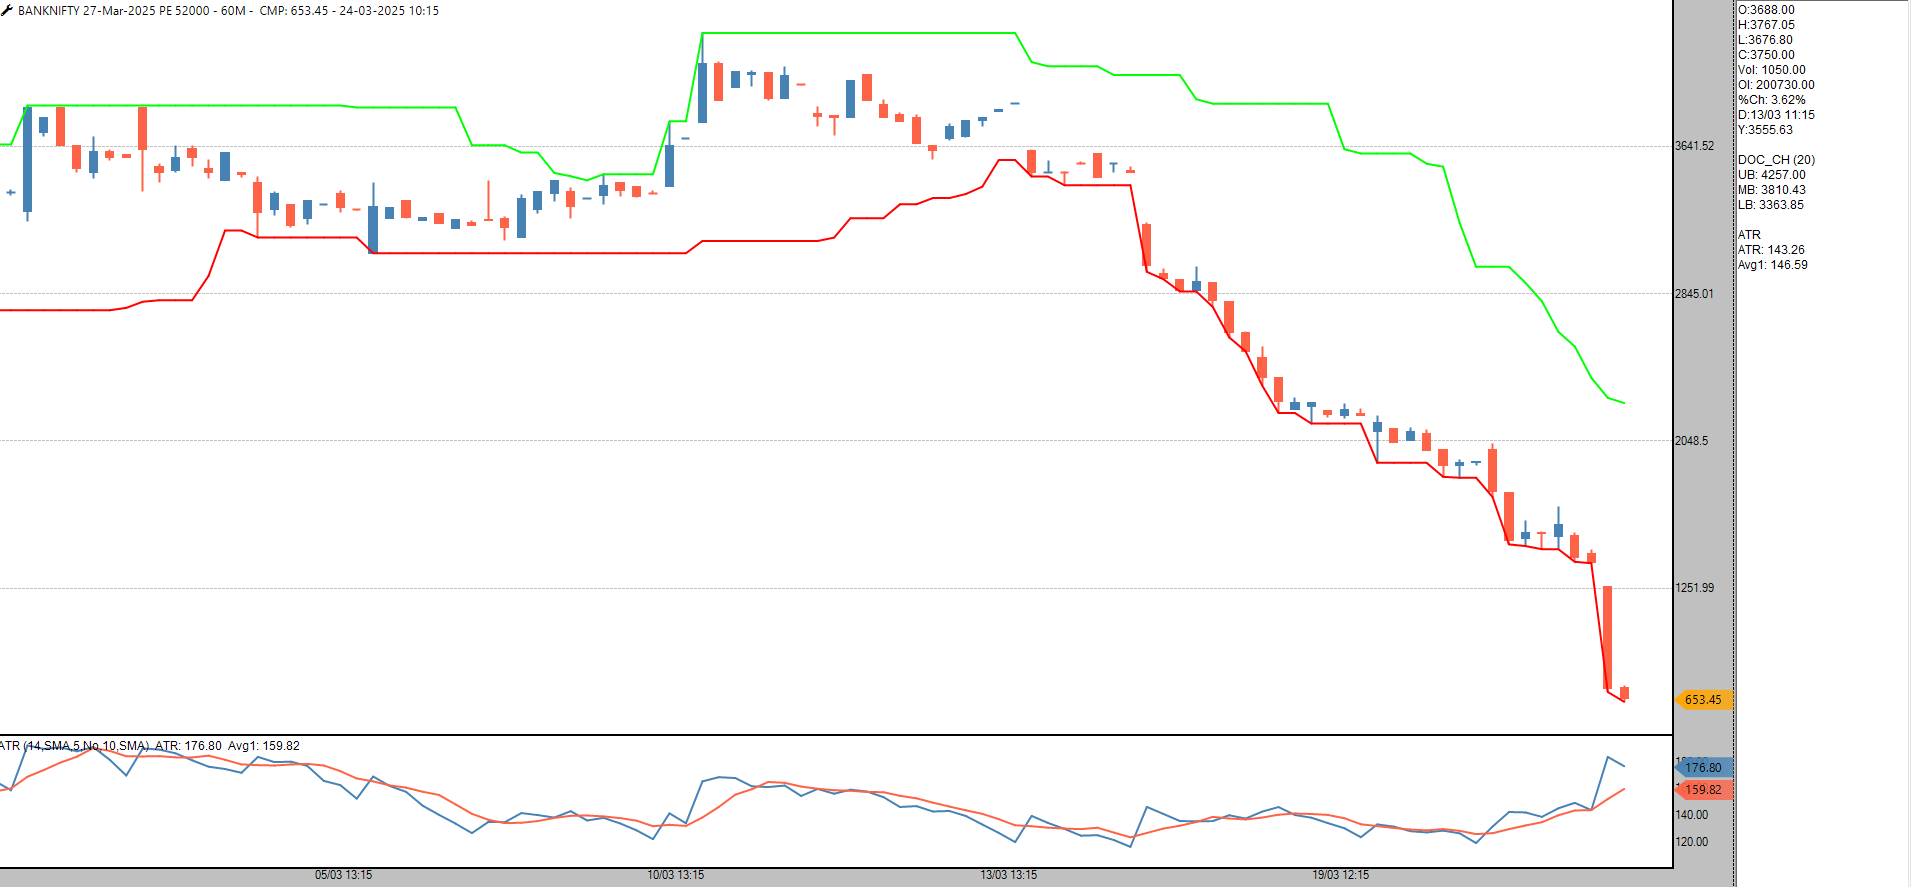
Sold @665 with initial Sl of 2 ATR 1015
-
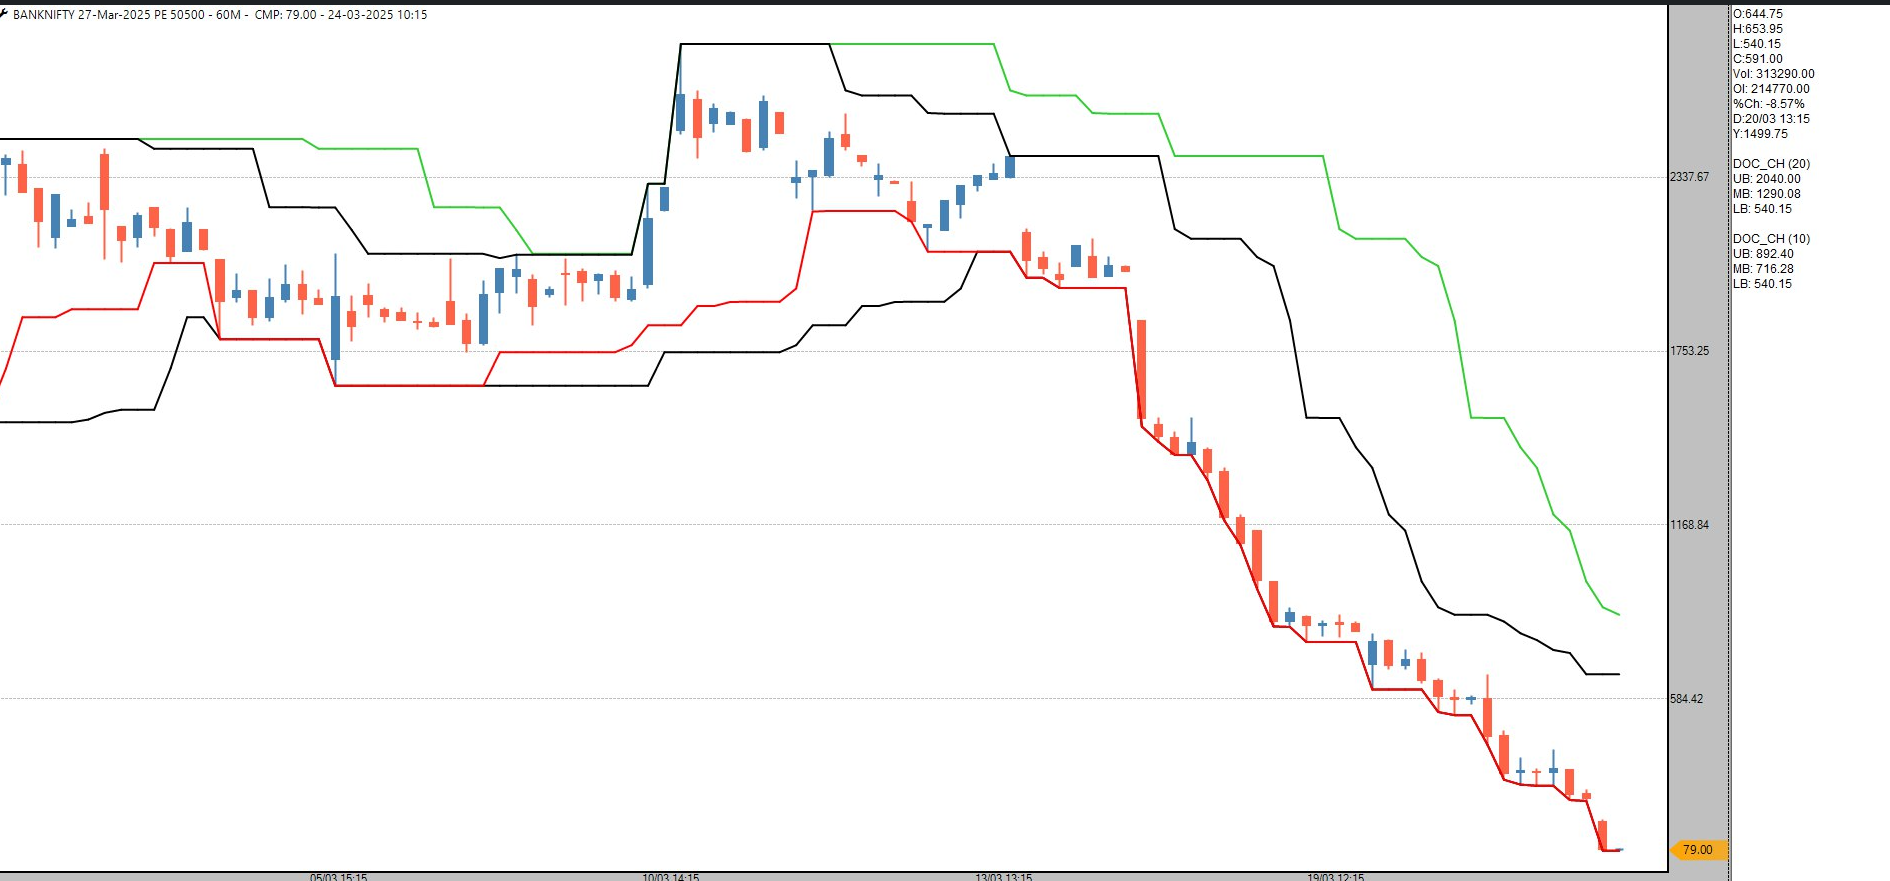

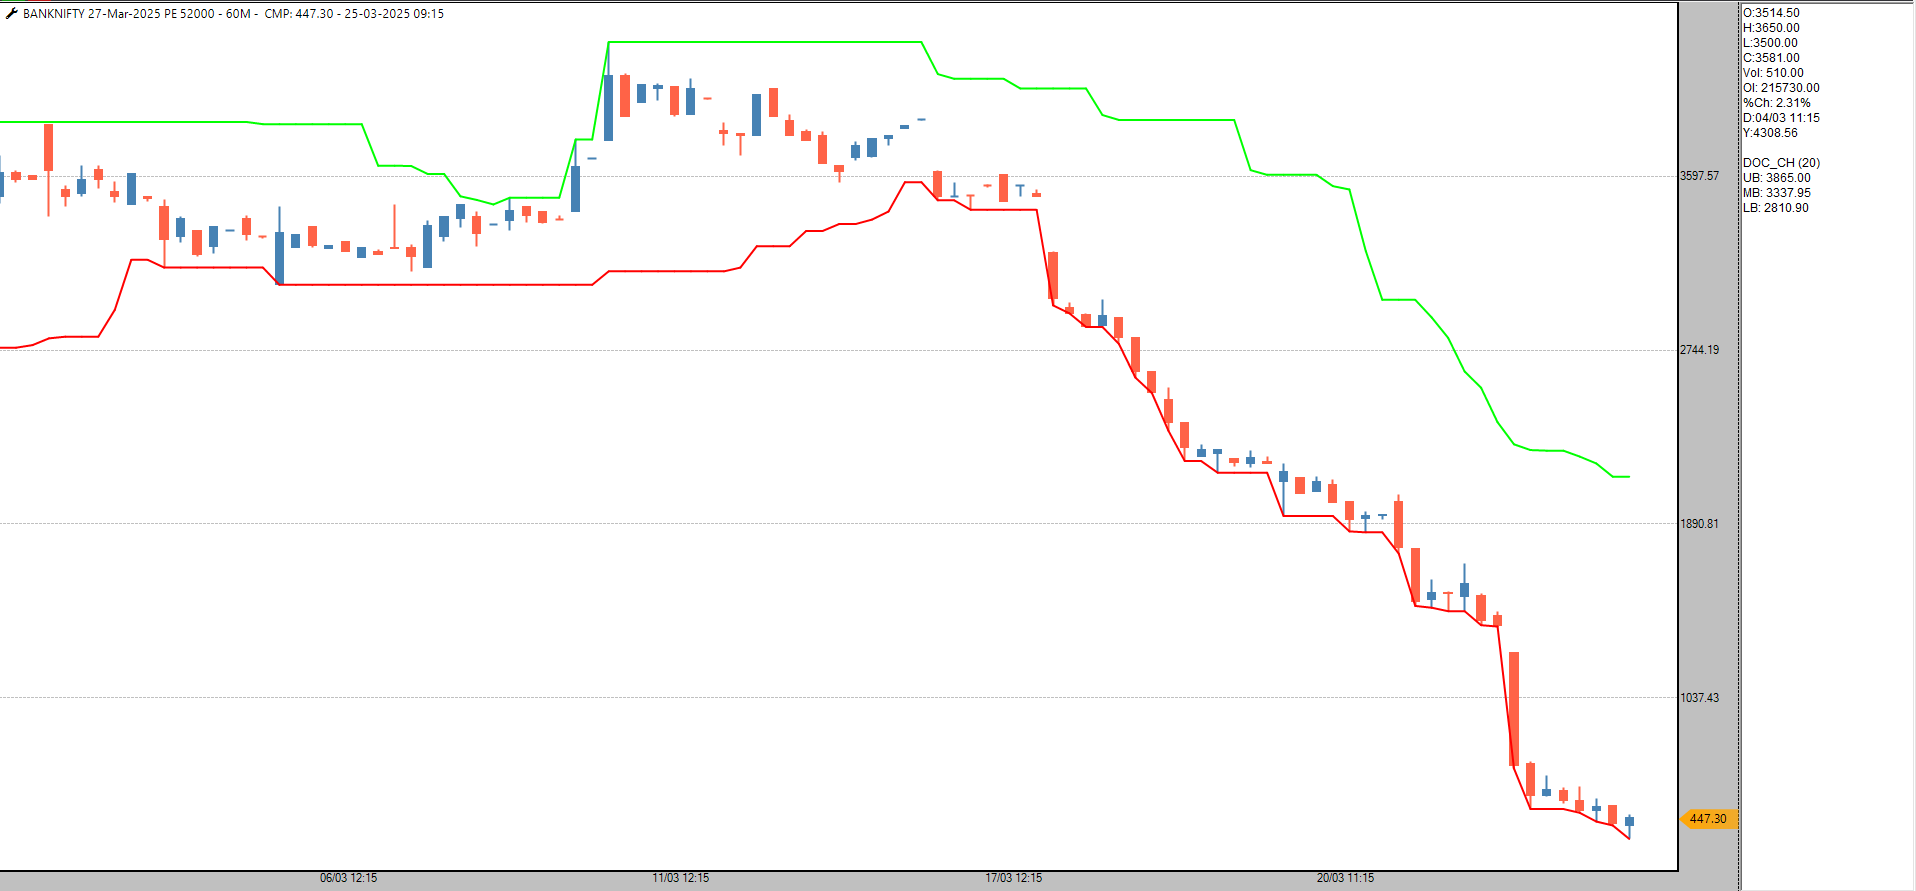
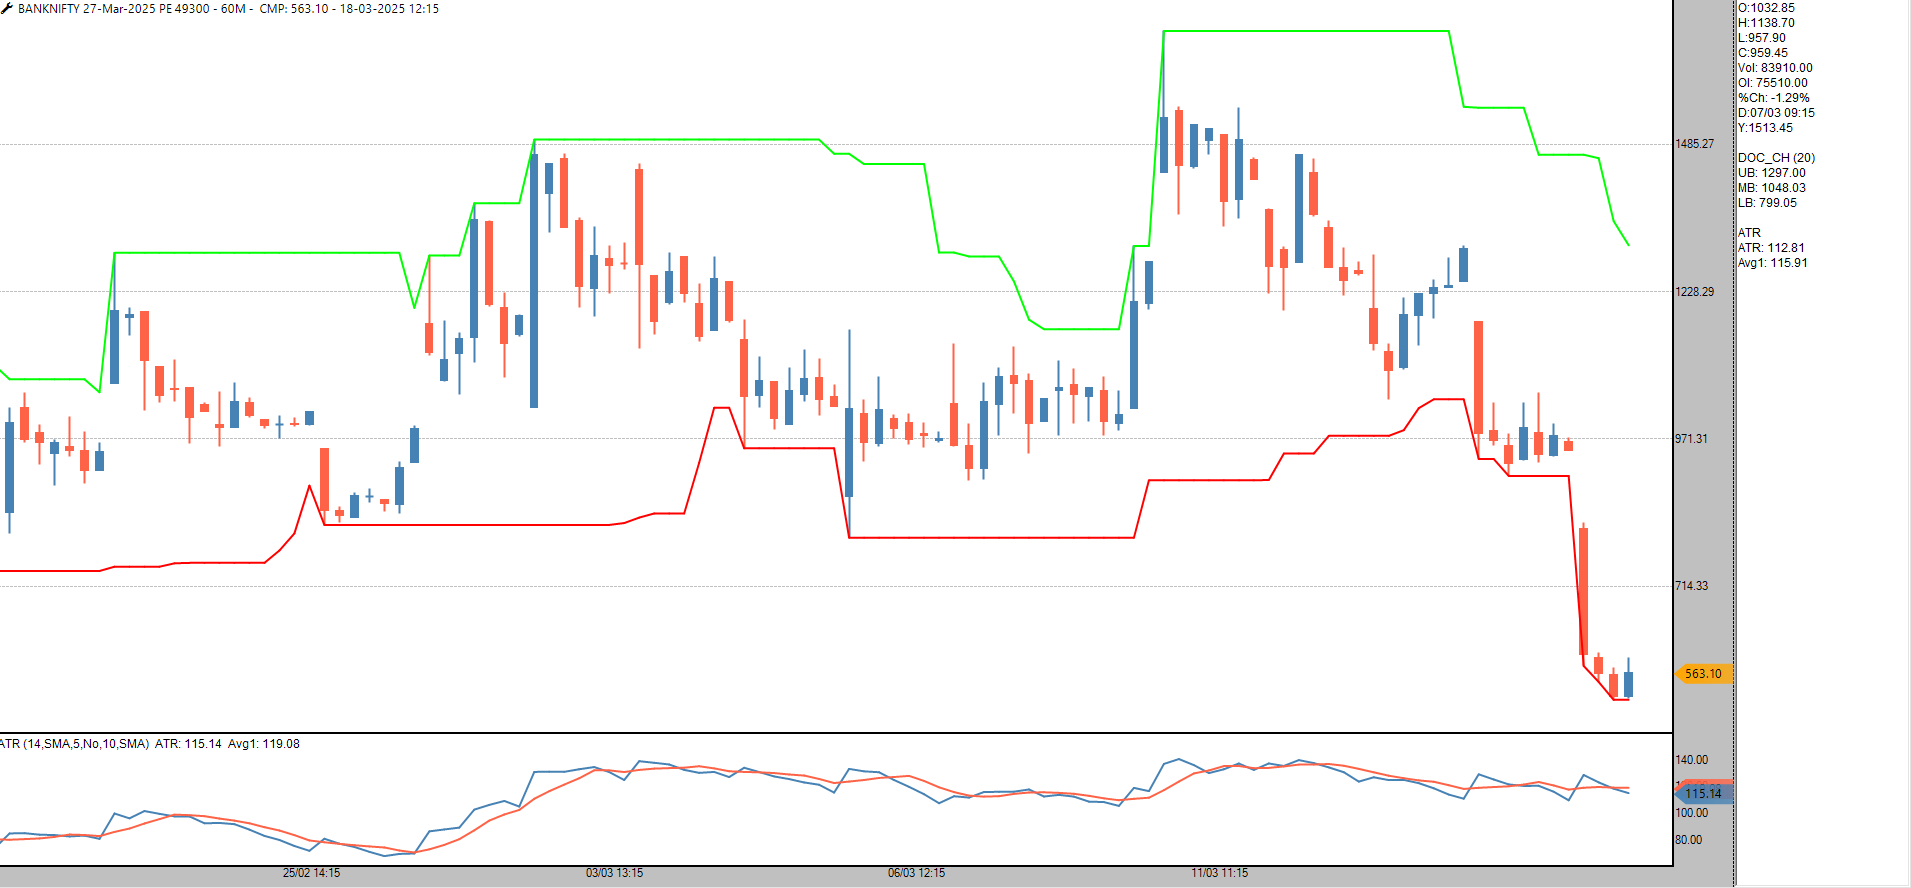
Booked at 79. Will sell 52000 PE below 665
-
The Price is 100 rs now which is amlost 90% of the selling price. I want to move to the ATM strike hence I will move the SL to 1:1 RR which is 200
-
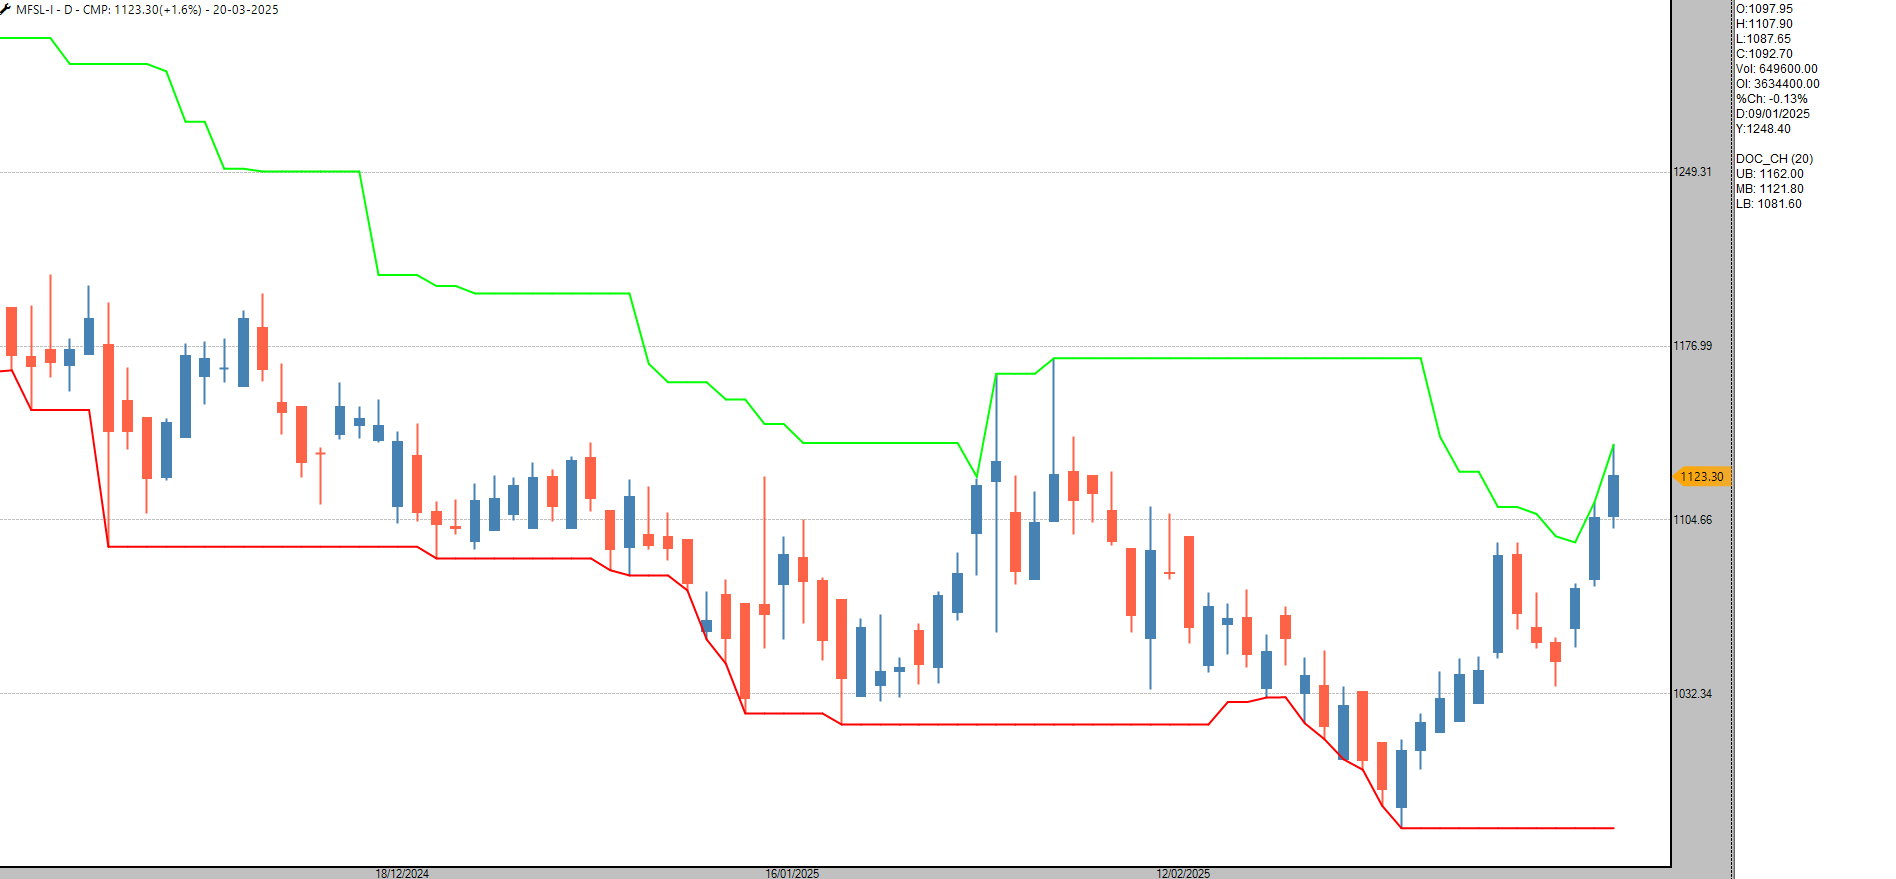
The stock has closed +1.7% in my favor. The PnL is 33k hence I will move the sl to cost. -
The stock closed 3% in my favor. The Pnl 44k hence I will move my SL to cost now. -
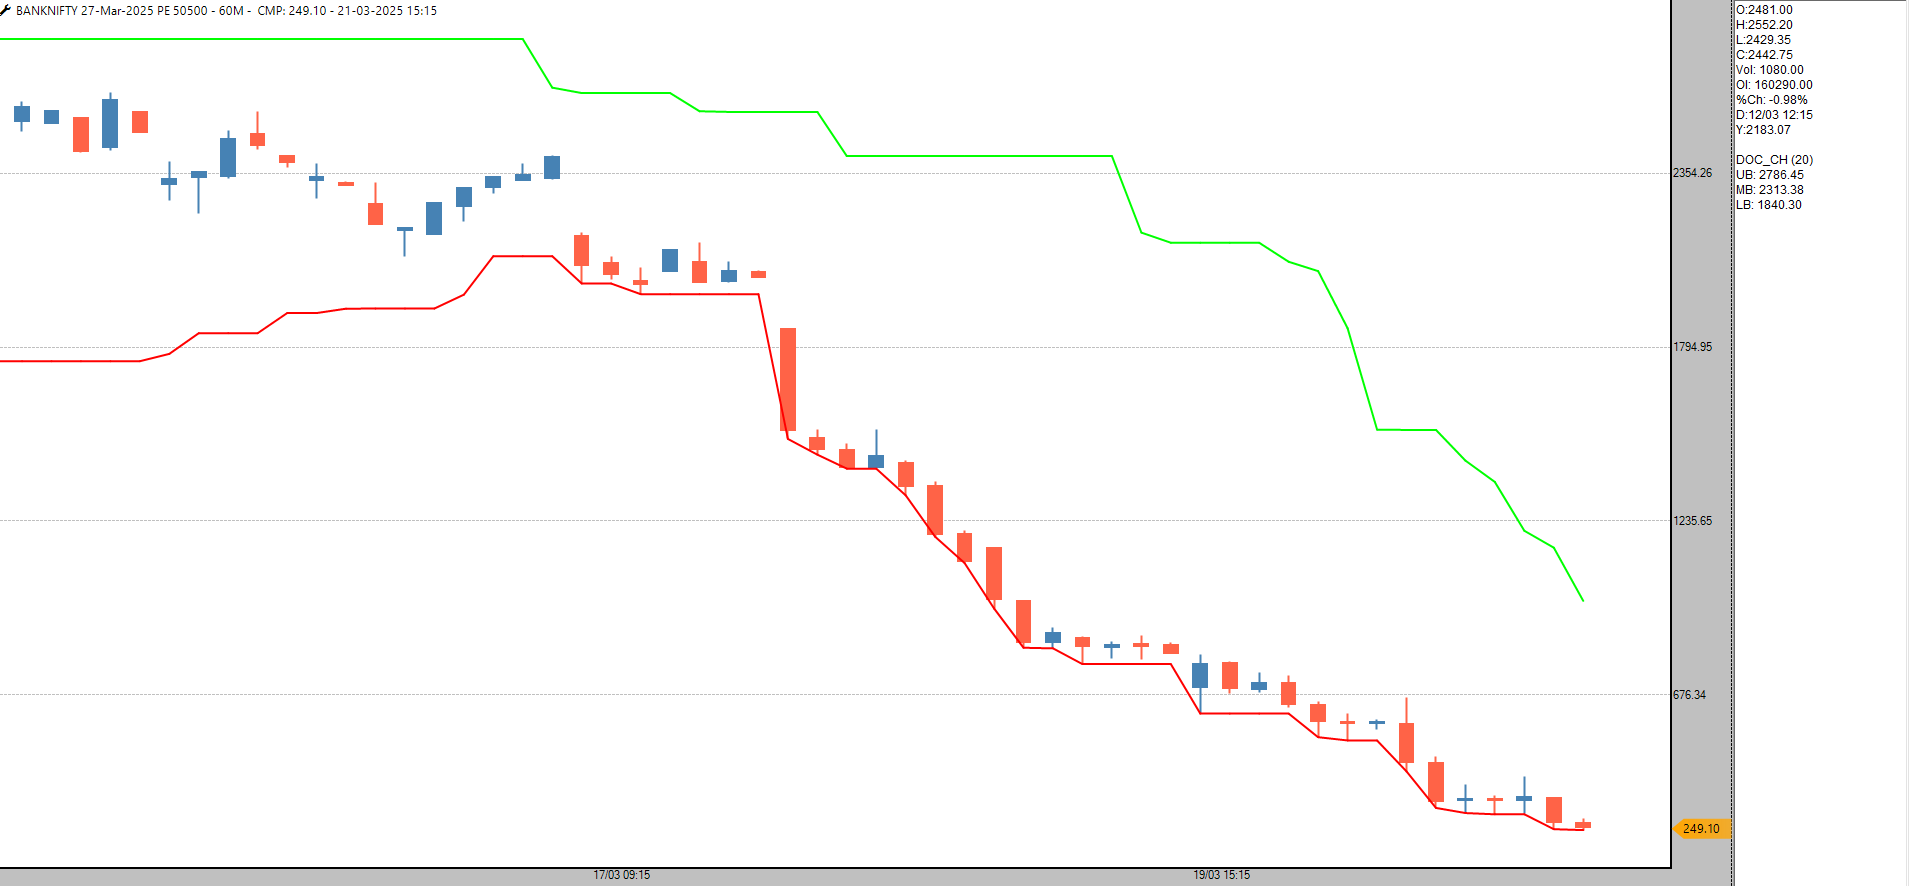
The Option price is 250 hence my trailing SL is 417. -
Yes..20 period
-
I went through a lot of videos of Van Thorpe recently and I found Risk Reward as the SL for option shorting. The 1:1.5 is the right RR for me. It suits my risk appetite and keep in the trade for a longer time. I trail the SL which maintains that RR. The low price is 308. So the formula for calculating the trailing SL is (308/1.5)+308=514
-
Sure. I am running a system on 0.15% tick tf with Dsmart. i could see that you have to take 6-8 whipsaws before a trending move. I think I have completed around 60-70 trades and the system is not profitable as of now. I have moved the TF to 1 min and will complete another 150 trades with it. Lets see.
-
The move is in my favor. I have shifted my SL @ 890 to maintain a RR of 1:1.5 -
The stock was 1.6% up on eod basis. The SL remains same as the initial SL. -
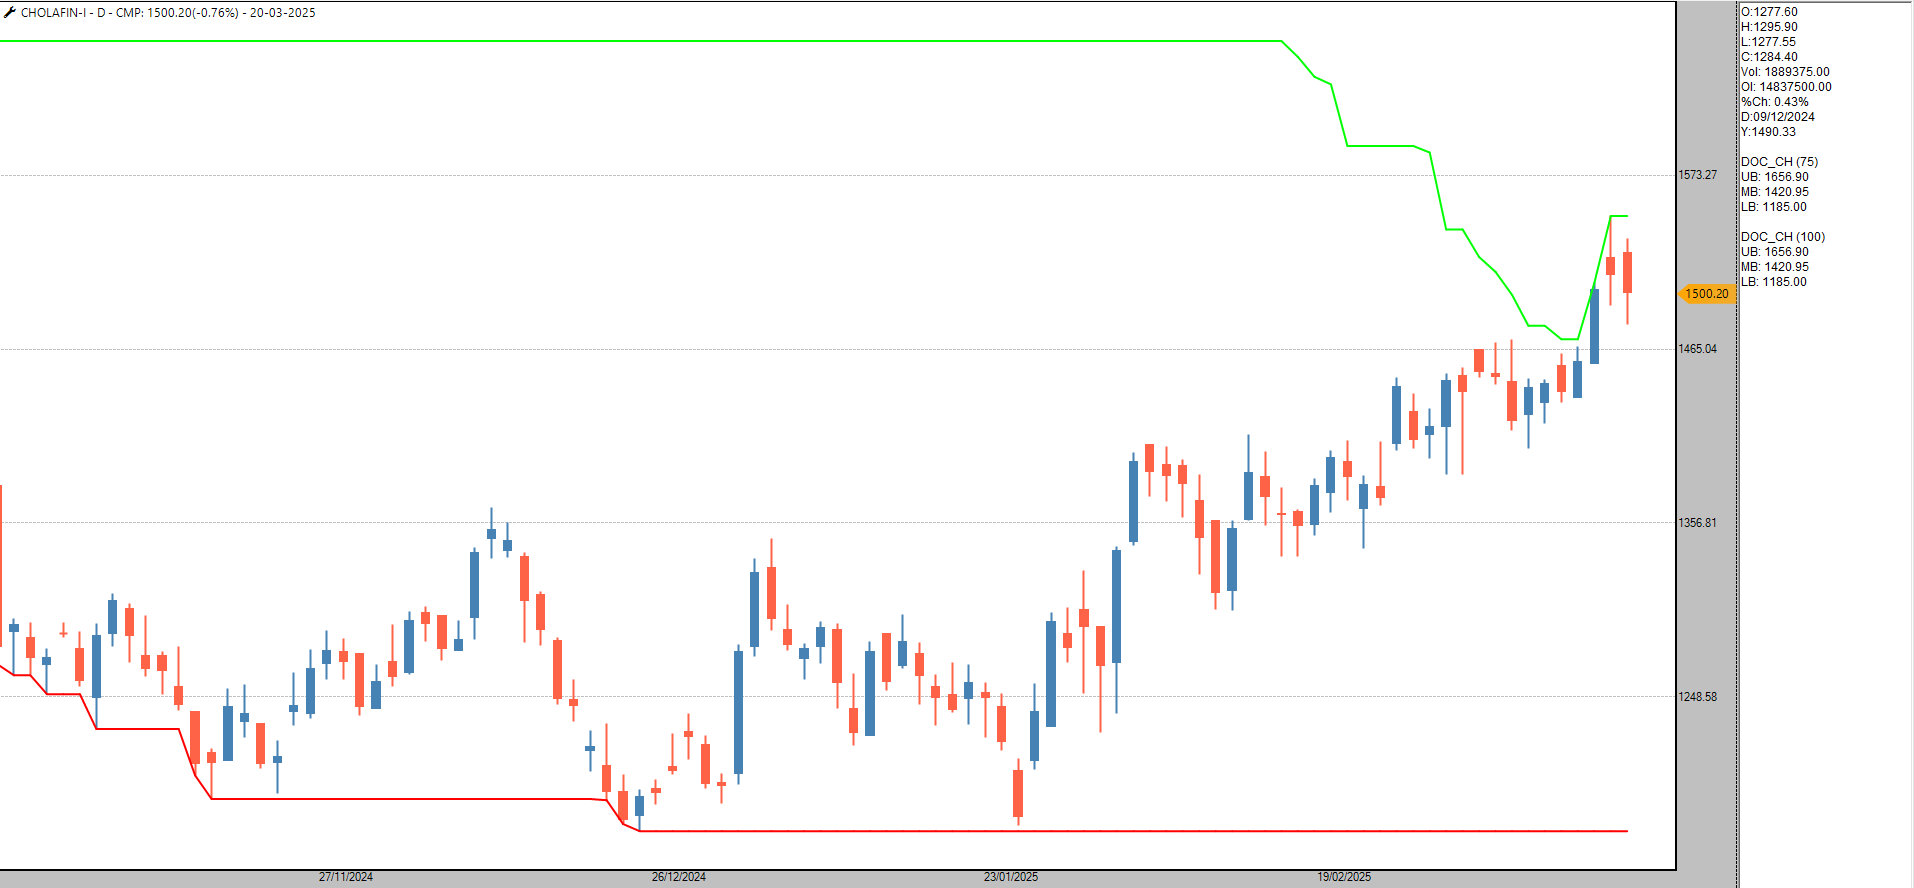
The stock closed -0.76%. The SL is as per the initial SL. -
What's your observation on the number of whipsaws before a trending move on 0.1%? And what's the average whipsaw and a trending move %?
-
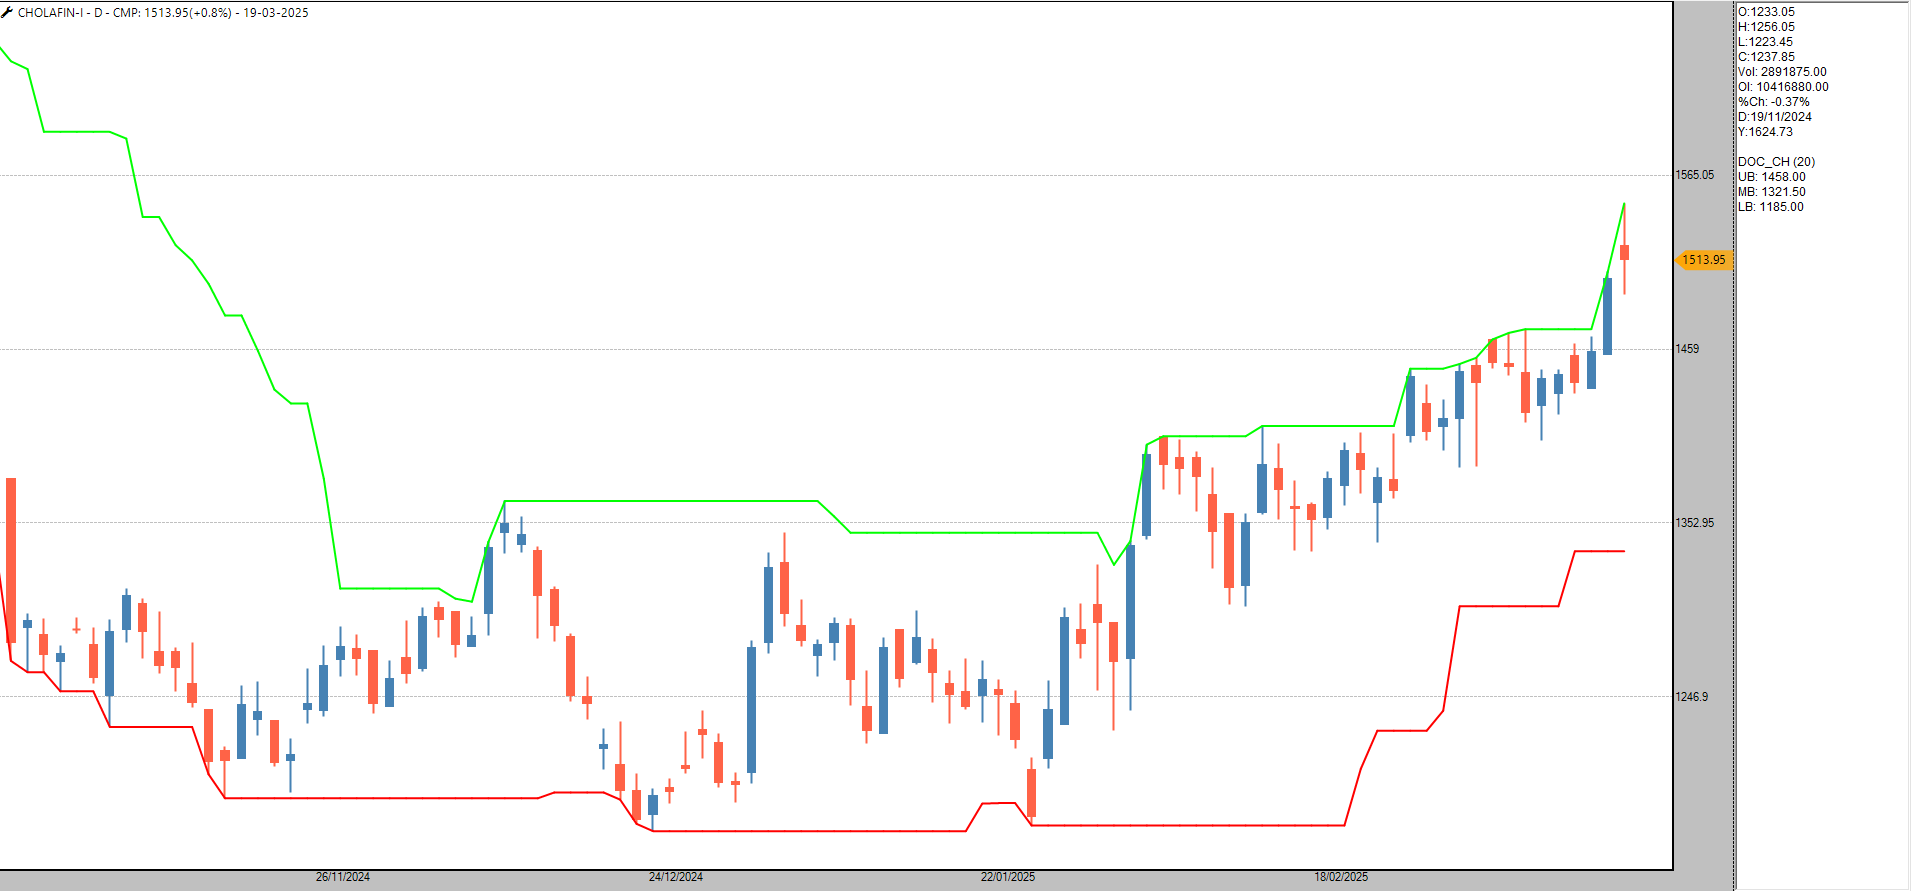
The stock closed +0.8% in my favor. The sl remains unchanged as the initial SL. -

The stock moved in my favor on eod basis. The SL remains same as the initial SL. -
Correction : Sl is 1060
-
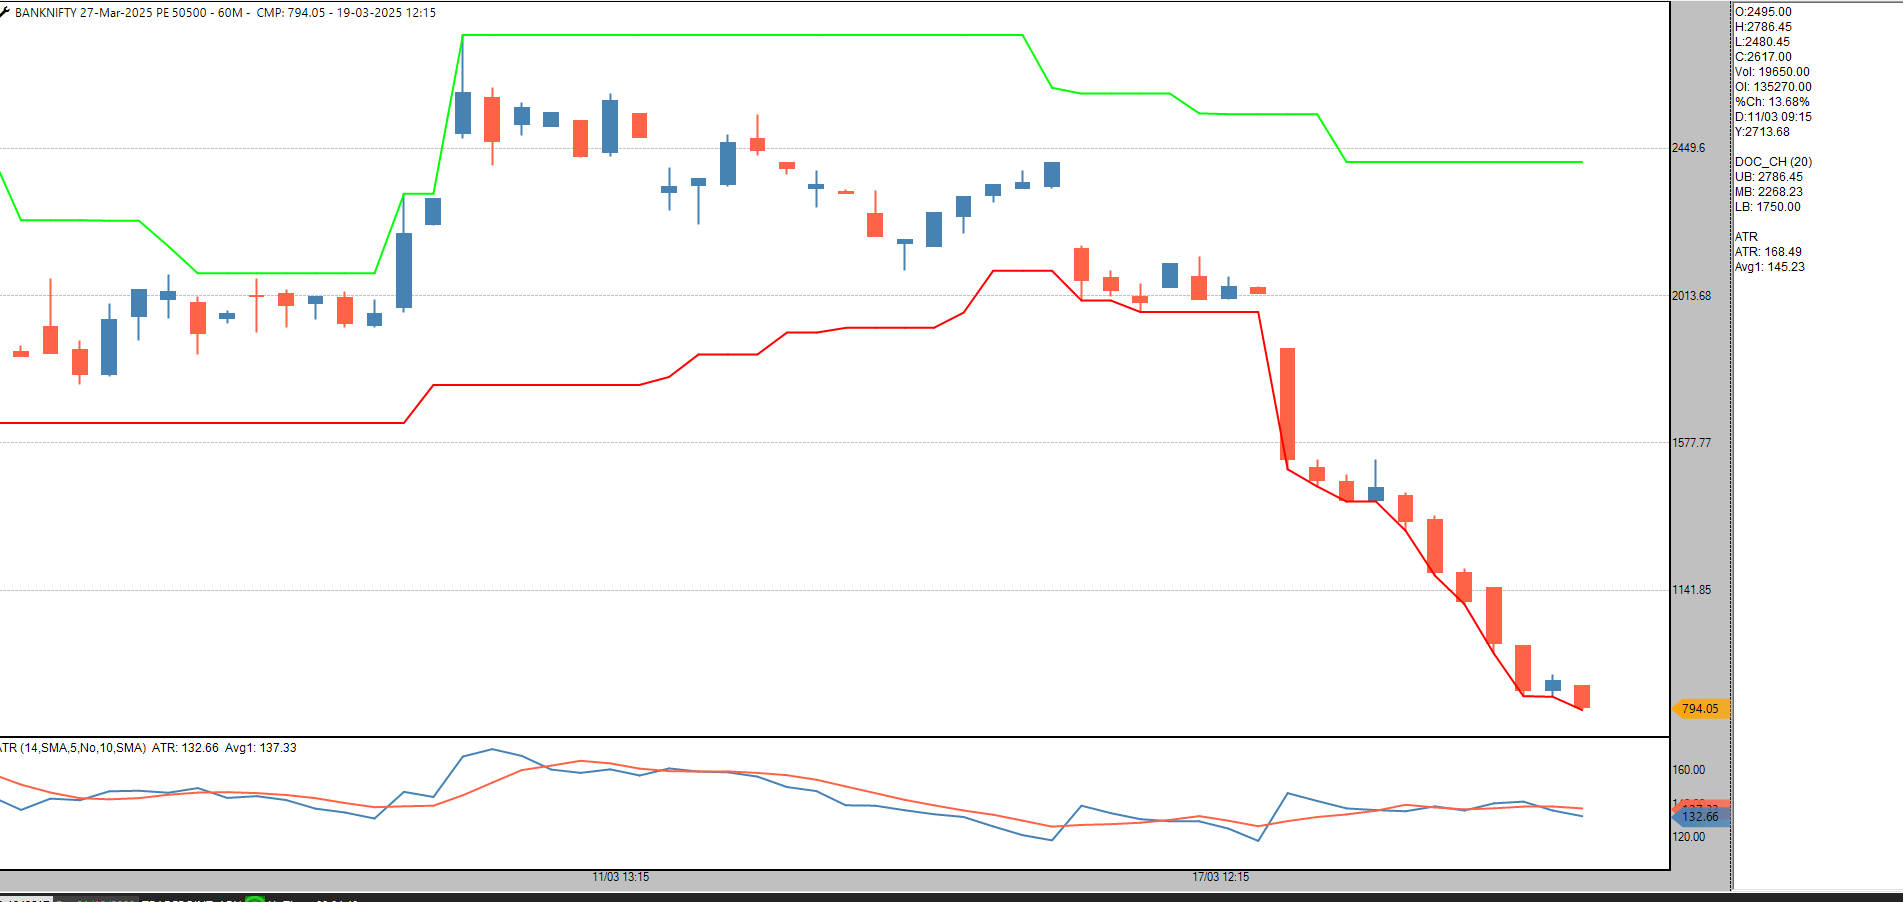
I sold 50500 PE @800 with a SL @960. The RR is in my favor now. -
CMP is 505 which is 1:1 RR. I need at least 1:1.5 RR so I am going to book this and enter a new trade.
-
Wonderful. Thank you for the update.
-
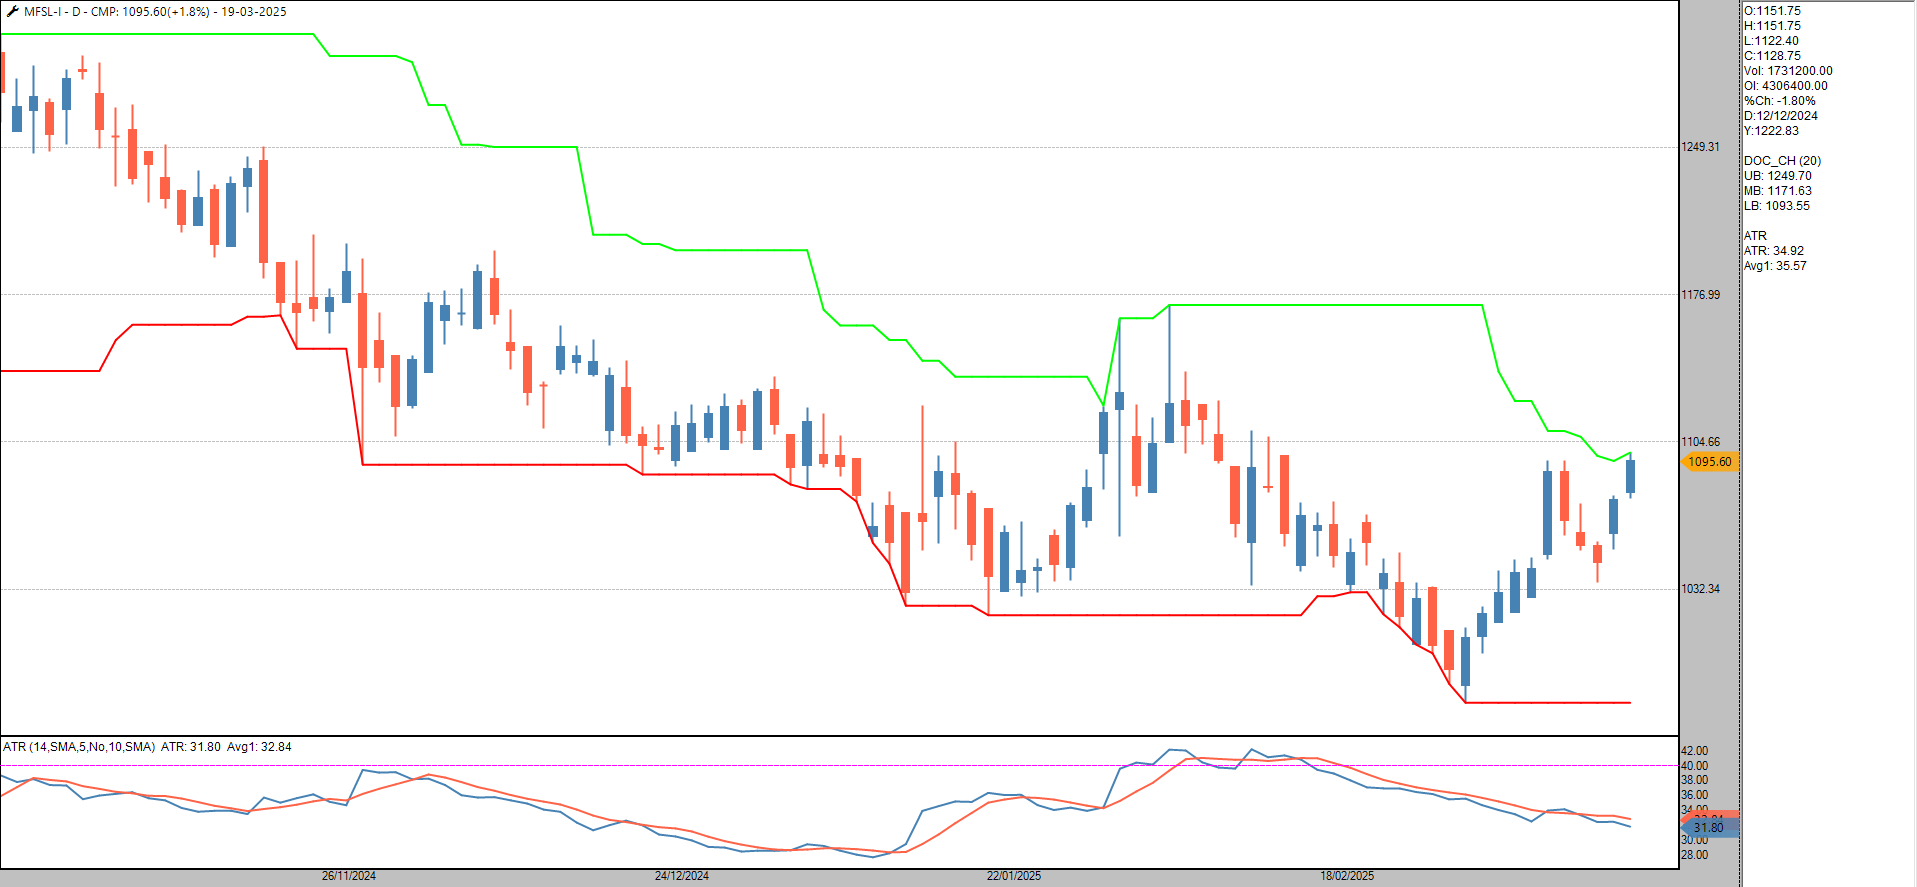
I entered MFSL March Fut Long on 20 day breakout. The initial SL is 2 ATR @1032Lets see how that goes.
-
If possible, please add % away from ATH,52 Weeks high and 100 Days high.
-
The current position is my favor. I will move the SL to cost if there is 4 ATR move in my favor which is at 1640. Till that time, Initial SL will be in place. -
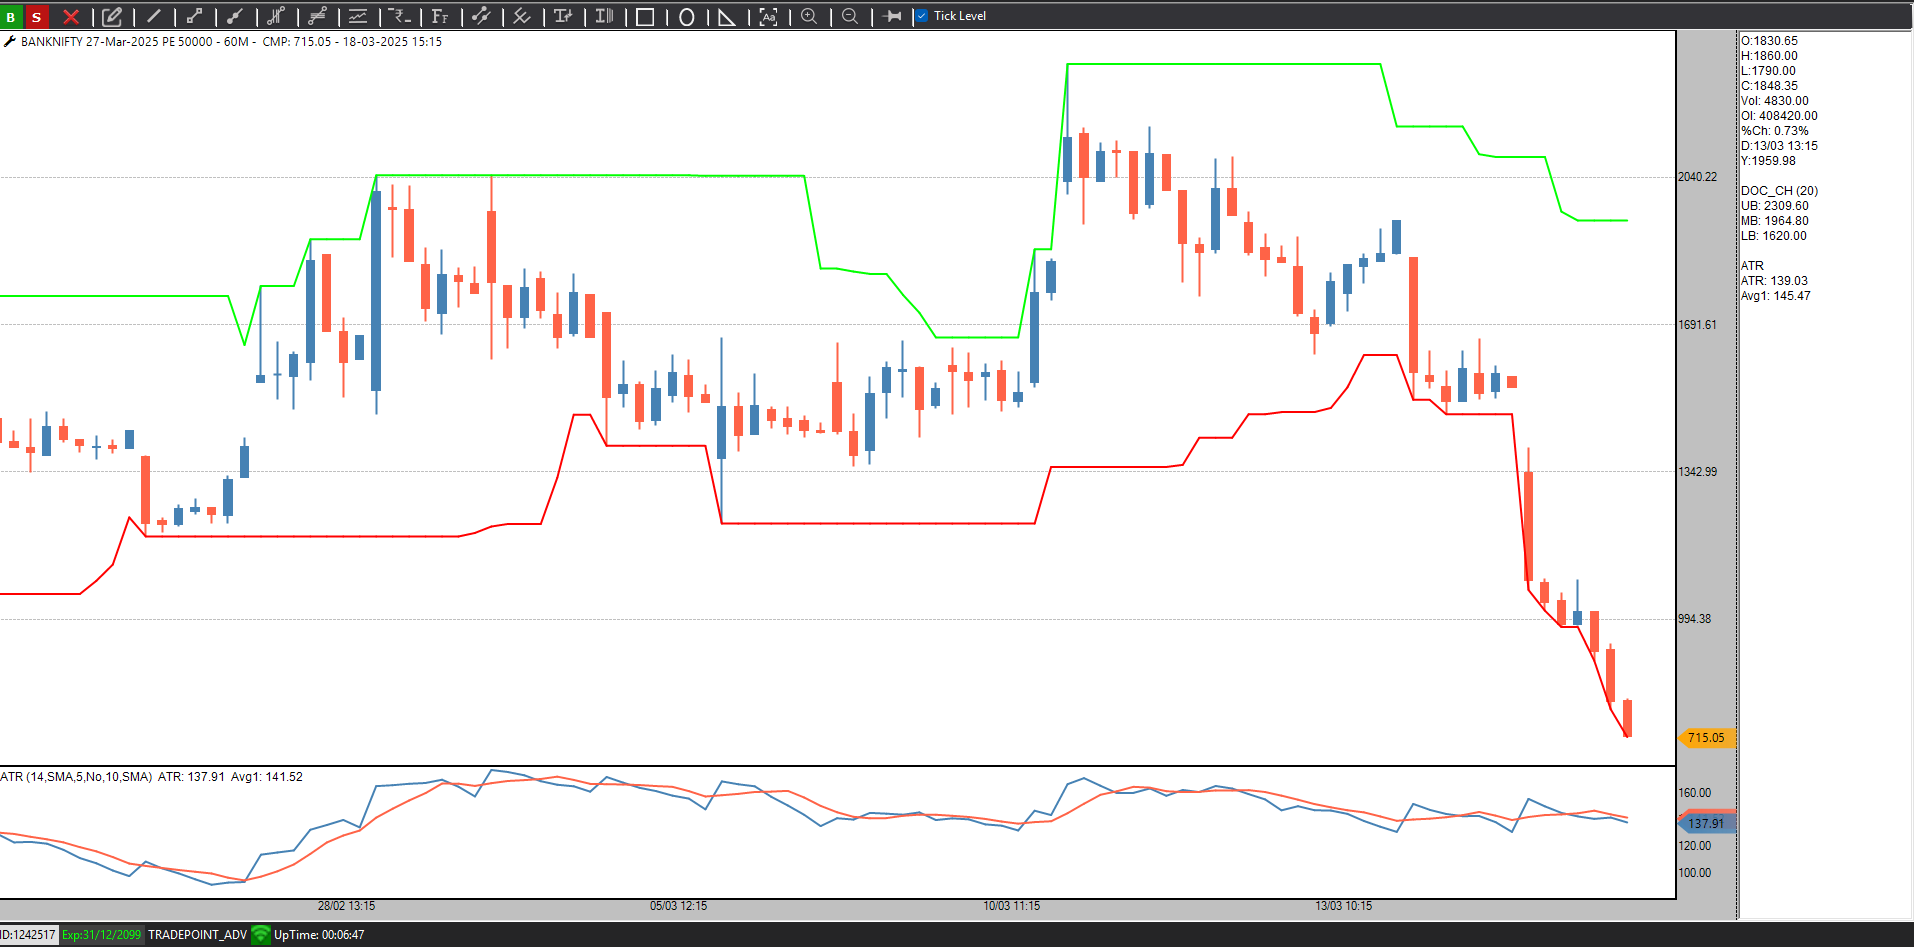
Shorted @ 735 Initial SL 1015
-
Since there is 50% move immediately, I am booking profit here and will short 50000 PE -
If you are talking about the Long trades, yes. It has been a bad 8 months. I have exited 2/3rd of my stocks as the exits triggered on 3%. But that's a market phase and you cant do anything else than following your rules. This period was the best for shorting the stocks or going long on Gold,Currency,Bonds etc. But we have to take the trades accordingly. If you see the data rationally, you would find opportunity in different asset classes. We as traders should always have a system for every asset class or at least do both long and short in the equity marktets.
-
I am sure @Definedge team will help us with a solution.
-
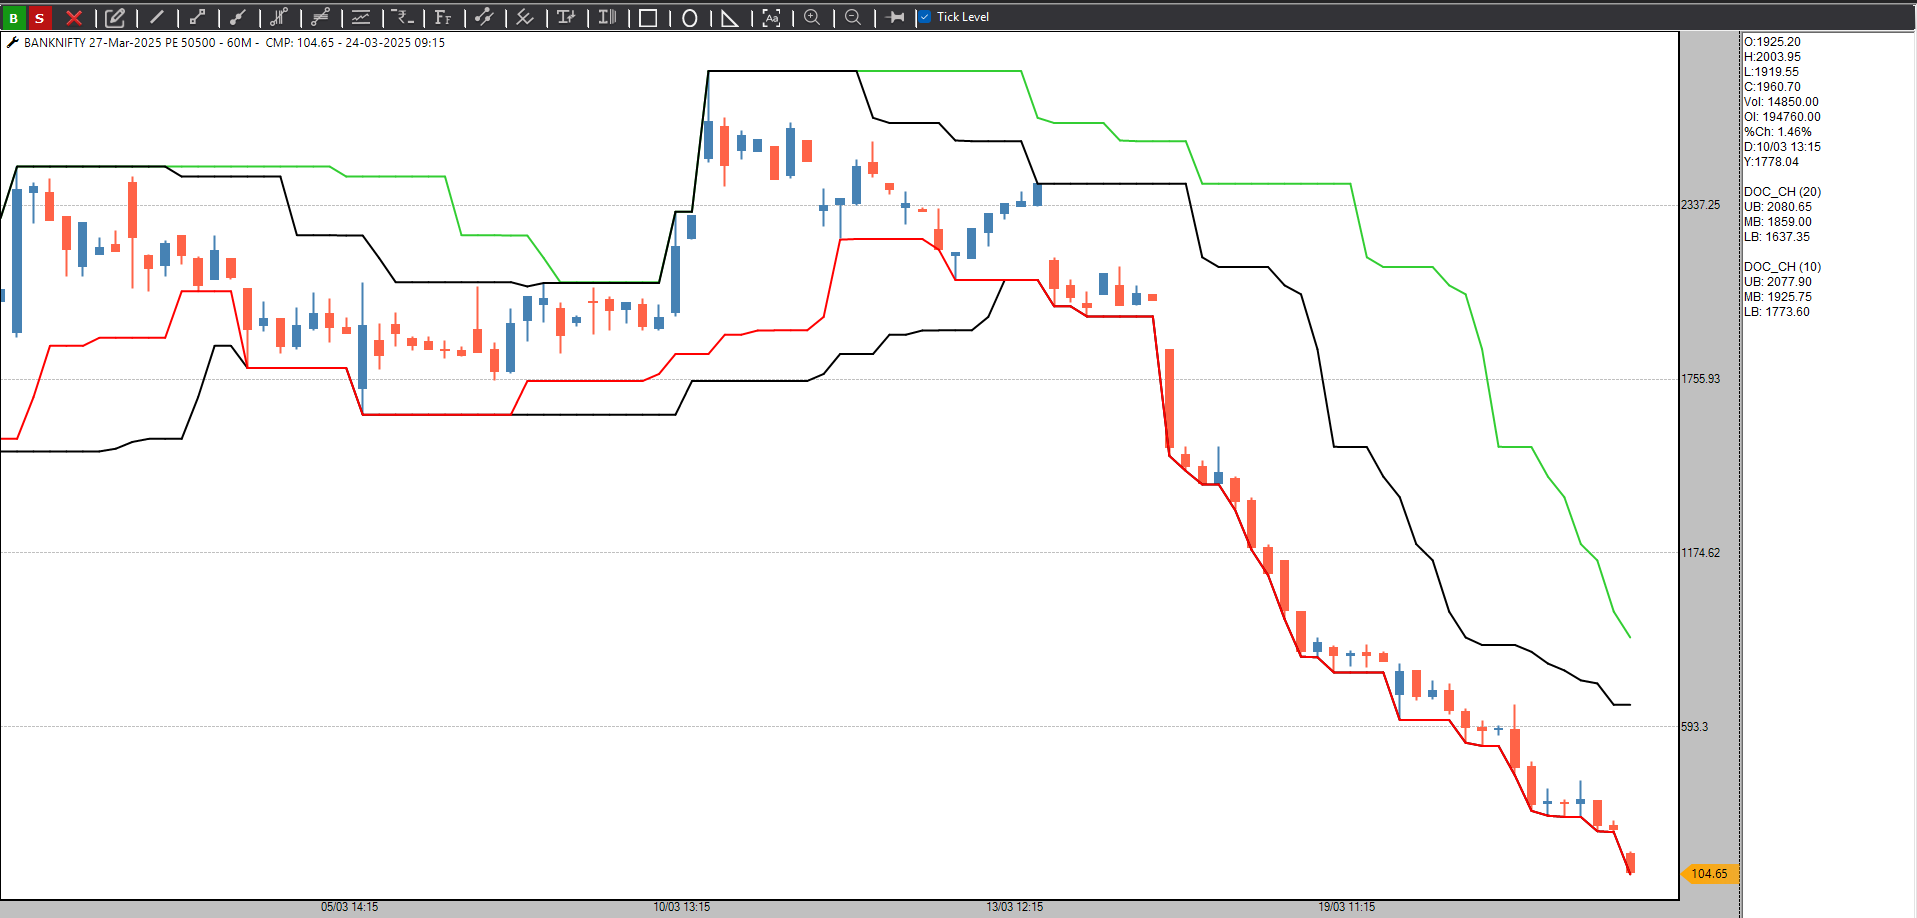
I shorted BNF 49300 PE @700 as it broke the 20 hour low. The initial SL is 2 ATR @ 960 and I will trail is with 20 hour high.
Lets see how that goes.
-
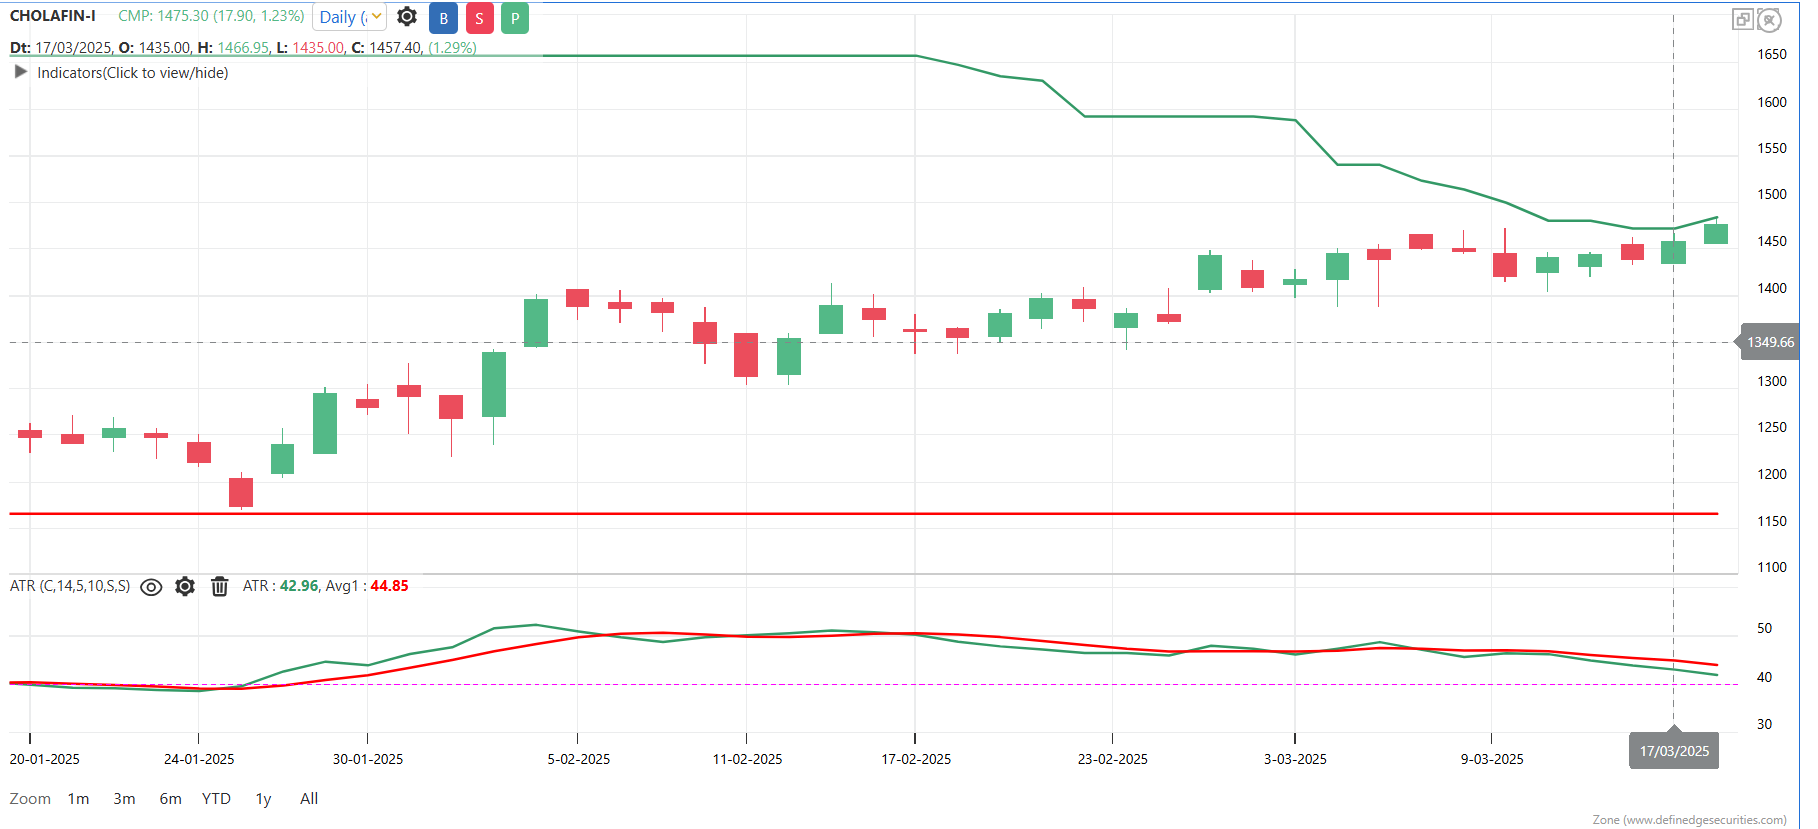
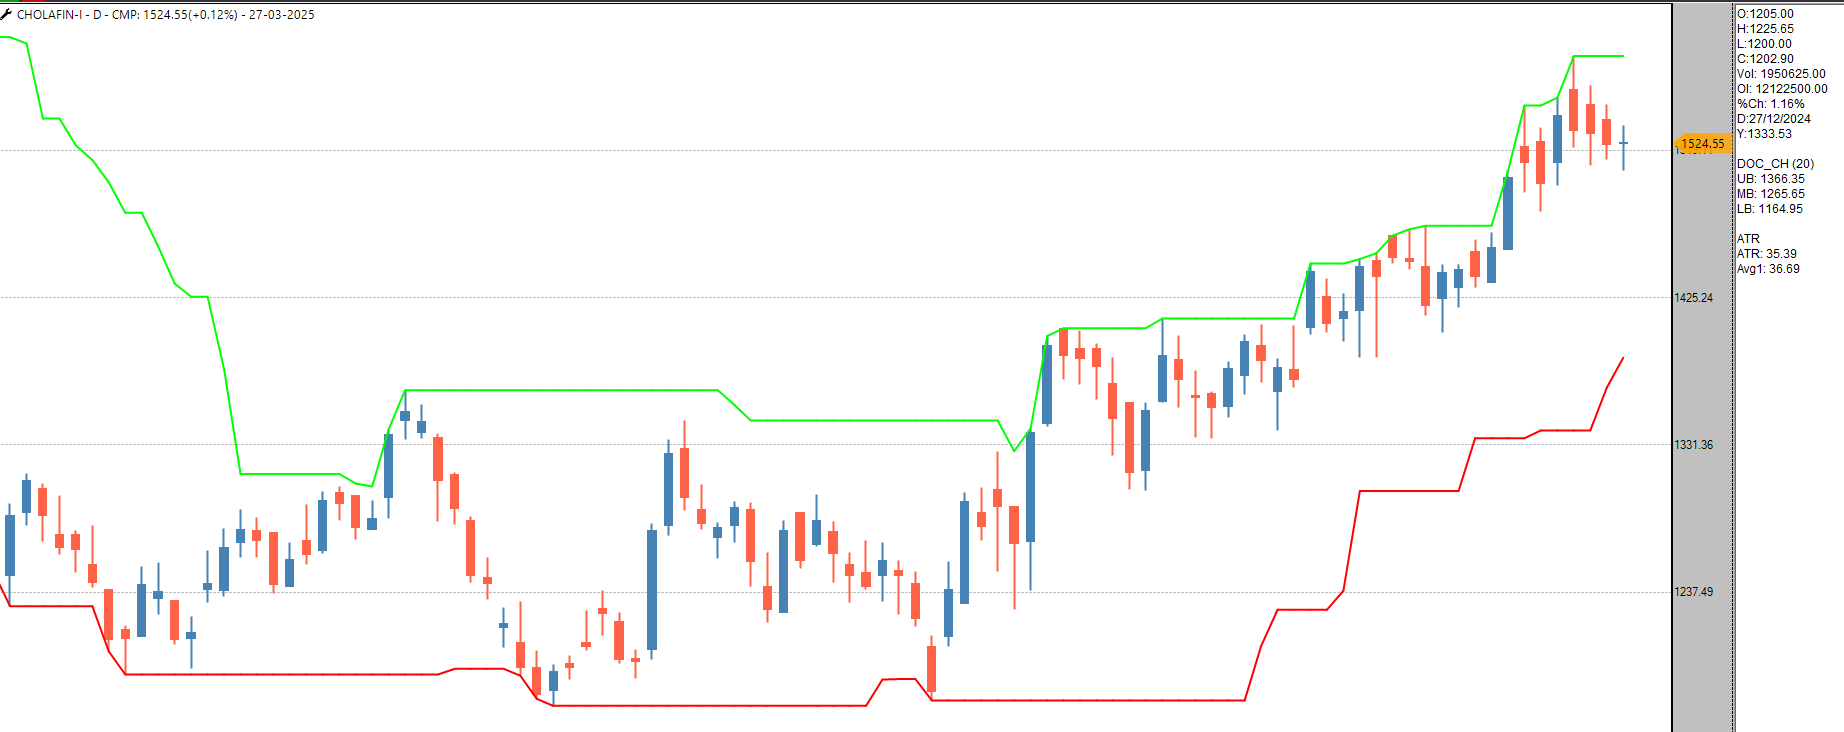
I plan to share the update on the execution of my trades with you all. I have entered the Chola Fin March Future long trade @1472 which is a 100 day Breakout. My initial SL is 2 ATR which is (42*2=84) @1388.
My trailing SL is 75 days low @ 1164 which is 30 days away. The Trailing SL wont change as the DTE is less than 30 hence I will exit on the initial SL or the closing price on the expiry day.
Lets see how that goes.
-
Everyone knows that trading is a game of probabilities, but how many traders actually approach it that way? People love making predictions because it gives them a sense of pride and satisfaction when they’re right. However, when their predictions fail, they feel disappointed or frustrated and start searching for reasons behind their failure. But the truth is, the reasons for being wrong are just as relevant as the reasons for being right.
Successful trading requires a solid trading system with a positive expectancy. The real key to success lies in position sizing, consistency, and maintaining an unbiased perspective. Traders should execute both long and short signals without hesitation, as they cannot outthink the system. Proper position sizing allows for stress-free execution, while a larger sample size helps assess the system’s efficiency.
It is challenging to suppress overthinking and simply execute trades, as our brain is naturally wired to analyze. However, there is no other way to survive in the markets. Accept the probabilistic nature of trading, respect it, and avoid making predictions—just follow the system.
-
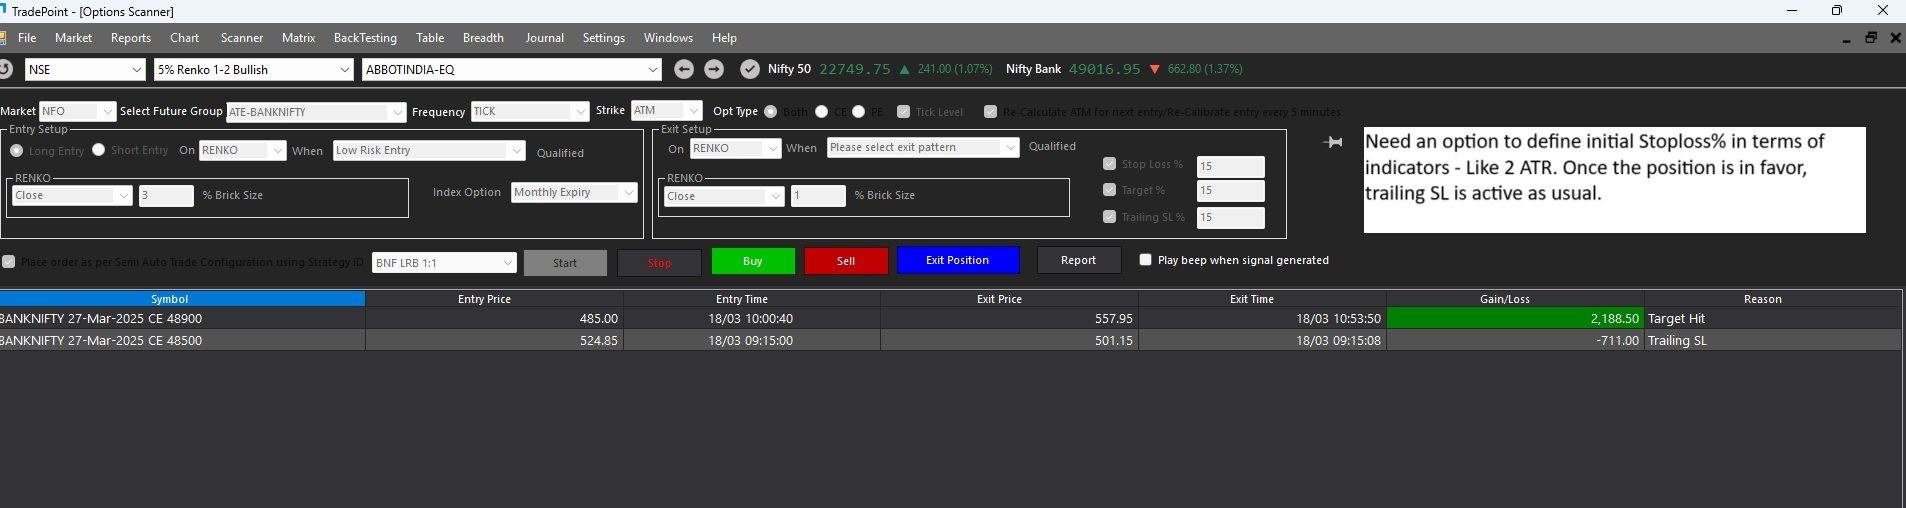
My request is to have an option in the Auto Trader to define the initial SL based on the indicator value. In one of my systems, I keep a 2 ATR SL as initial SL and trail it to 20 hour low once the position in favor.
-
Glad that you liked it.
-
I mostly trade in one direction and enjoy following trends. I’m more comfortable with buying trades, but I also take bearish trades when my system tells me to. Trading would be much easier without volatility. One major issue for me is when a Doji candle has a range of 0.5% or more. This can eat into my profits and lead to losses in my next trade. If I’m in a straddle before the Doji forms, I might get taken out of that position, making me lose even more in my directional trades. This can be very frustrating and emotionally draining. It often makes me feel like the market is working against me, leading to anger and a desire to get back at it. To try to cover my losses, I might increase my position size, but that usually makes things worse. This is really harmful to my profits. To avoid this, I need to first identify the patterns that upset me
A 300-point candle in an uptrend can easily take you out of a trade, which is the first negative sign. Then, you might see a good breakout on the put chart, but your stop-loss gets hit again. If there's another failed breakout on the call chart, it can be really frustrating. So, what should you do in these situations? The simple answer is to avoid rushing into trades. I have a rule to wait for 15 minutes after my stop-loss is triggered. During that time, I review the data and plan my next trade. I look for a range breakout from that candle and wait for it to hold for at least five minutes before making any new trades. I also watch the straddle chart and will enter a straddle sell trade when I see a Doji. These are three hourly Dojis in an uptrend. Selling straddles makes more sense during such a period.
It blocks my capital, preventing me from going all in on directional trades. Straddles are designed for selling when a Doji appears, which can lead to good returns during that time. The market is always changing, but we need to ask ourselves if we’re adapting as well. Flexibility in trading is crucial. We should adjust our approach based on the current market phase. Being flexible can help reduce the emotional stress we feel during market movements. Be flexible!
-
Very logical and easy to track the sector performance. Thank you for the write-up.
-
Good One Nishh. Once you practice the system over a longer period of time, you get used to these phases. Easier said than done but once it is in the behavior, trading becomes easy.
-
Baadal YuuN Garajataa Hai Dar Kuchh Aisaa Lagataa Hai
ChamakChamak Ke Lapak Ke Ye Bijali Ham Pe Gir JaayegiI heard this song after a long time. It made me think about a chat I had with friends regarding stock trading. One friend wondered why BDL was falling recently and what could be the reasons for the fall. Another friend joined the discussion and narrated how big players manipulate prices. He shared stories of losing money in trades and someone he knew seemingly predicting market falls. When I asked about a trading strategy, he admitted not having one.
Thinking about it, I realized the importance of having a disciplined system to handle market ups and downs and avoid emotional mistakes. Following a consistent system is challenging but crucial. It means showing up every day, sticking to the plan, and reaching a point where losing trades don't make you sad, and winning ones bring excitement.
On contrary, Knowing why markets move doesn't always make trading simpler. It can be like dealing with extra noise. When you're in a trade, the key is to stick to your plan – either cut losses with a stop-loss or ride the gains. Rather than constantly looking for more info on market trends, success often comes from sticking to your strategy and being disciplined in your actions.
In trading, Badal Garajega, Dar bhi lagega, bijli bhi giregi. Tab stop-loss lagakar bijli se Bacha ja sakta hai.
@Prashant-Shah @Brijesh-Bhatia -
Thank you @Debarchan-Ghosh-Dastidar
-
Traders use technical or fundamental analysis, but just being good at the analysis doesn't ensure success. 40% win rate and a risk-reward ratio of 1:1.3 is good enough to make money. What it means is that as analyst,you can be wrong 60% of the time and still do well if you execute trades effectively. As a trader, you dont have that choice to make any mistakes in execution to maintain that 1:1.3 RR. Execution is the king. A strong discipline and conviction is the basic requirement of a trader to go through the ups and downs during the execution of trades. Markets have opportunities in all phases, and traders need to adapt. Doing this is tough but once you master the execution,trading can be a very peaceful and rewarding business.
-
D Smart is the only indicator I use for my trading. It is extremely useful. On pnf, d smart 6 and 10 can be plotted together and it can be a wonderful trade setup.
- Price above both 6,10 D Smart, trade bullish strategies.
- Price below 6,10 D Smart, trade bearish strategies
- Price between 6,10, trade sideways strategies. There should be at least 6 columns to ensure there is no breakout on either side.
- If price goes below d smart 6, and doesn't break d smart 10 and it again goes above dsmart 6, then it means that bullish momentum is continuing and it can be traded on the third column DTB. Vice versa for bearish trades.
-
@Rajeev Talasikar thank you.
-
@Ritesh Badai thank you ritesh bhai.
-
Thank you @Debarchan-Ghosh-Dastidar
-
I am overweight when you go by the definition. Every time I play cricket, there is always someone in better shape on the team, making me wish I could be fitter too. I do want to lose weight, and I know how to do it.
The funny thing is, my wife is a nutritionist (P.Hd) (Often taunts me "Diye tale andhera"). I know I need to change my habits – like sleeping on time, eating the right things in the right amounts, and exercising. I have to stay away from stuff like junk food, too much carbs, and fats.
So, I've got the motivation and I know the process. The missing part is the action. I see myself making excuses to avoid exercising or sticking to a healthy diet. I need to make a decision: either take action, lose weight, and enjoy the benefits, or stay overweight, party hard, overeat, and deal with the consequences. I've learned that just having the desire and knowledge is not enough. I need to actually do something about it.
Trading is no different. Everyone wants to make big profits or knows that discipline is crucial. In trading, having stop losses is super important to survive in the market. Losses are just part of the business and accepting this fact is of paramount importance. Following a systematic approach matters a lot, and it's better to ignore the noise from stock news or expert opinions. Some of us learn technical/fundamental analysis, which is good, but it's not everything. The key is putting plans into action.
Going through the drawdowns, leaving some profit on the table, and letting go of a few good opportunities are all part of the process. By accepting and integrating the unpredictability of the markets into your trading, you can avoid the emotional pain. Trading, like life, needs more than just motivation and knowledge; it requires action. Traders should stick to their plans, keep practicing, and in the long run, the market will reward them. A trader with less knowledge but excellent execution skills can outperform someone with extensive knowledge but weak execution skills at any time.
The trader must choose between following systematic and disciplined trading and enjoy its benefits, or being an undisciplined trader and going through the stress caused by the unpredictability of markets.
@Prashant-Shah @Brijesh-Bhatia
-
yes exactly sir. that is it. thank you for sharing this. XIRR is the key.
-
@Harjjap Singh Ssaini sorry, I couldn't get your point sir. What is XIRR? Apologies for my lack of knowledge.
-
While pyramiding is widely acknowledged as a sound investment practice, not everyone feels at ease with it due to the fear of purchasing at higher prices. Many investors hesitate, fearing the stock might decline after reaching those levels. A friend of mine is holding IRFC from ₹29, and although the stock has surged to around ₹165, he hasn't increased his allocation for a strange reason. I asked him if he had not increased his allocation at higher levels because adding more funds to IRFC would lower the percentage gain displayed in the app. He said yes. If a stock doubles from ₹100 to ₹200, the return percentage is 100%, but adding an equal amount as the initial investment would reduce the return percentage to 50%. While the pyramiding system often yields higher absolute returns in the long run, emotional attachment to the perceived profit and loss restricts decision-making. Many aspire to become investors like Rakesh Jhunjhunwala or Warren Buffett, but few match their discipline. These successful investors didn't buy stocks in one go; instead, they patiently waited for their portfolios to grow over the years, investing more in winning stocks through pyramiding. Riding winners and cutting losses according to a disciplined system are crucial for investment success, and pyramiding is a proven method for maximizing gains.
@Prashant-Shah @Brijesh-Bhatia -
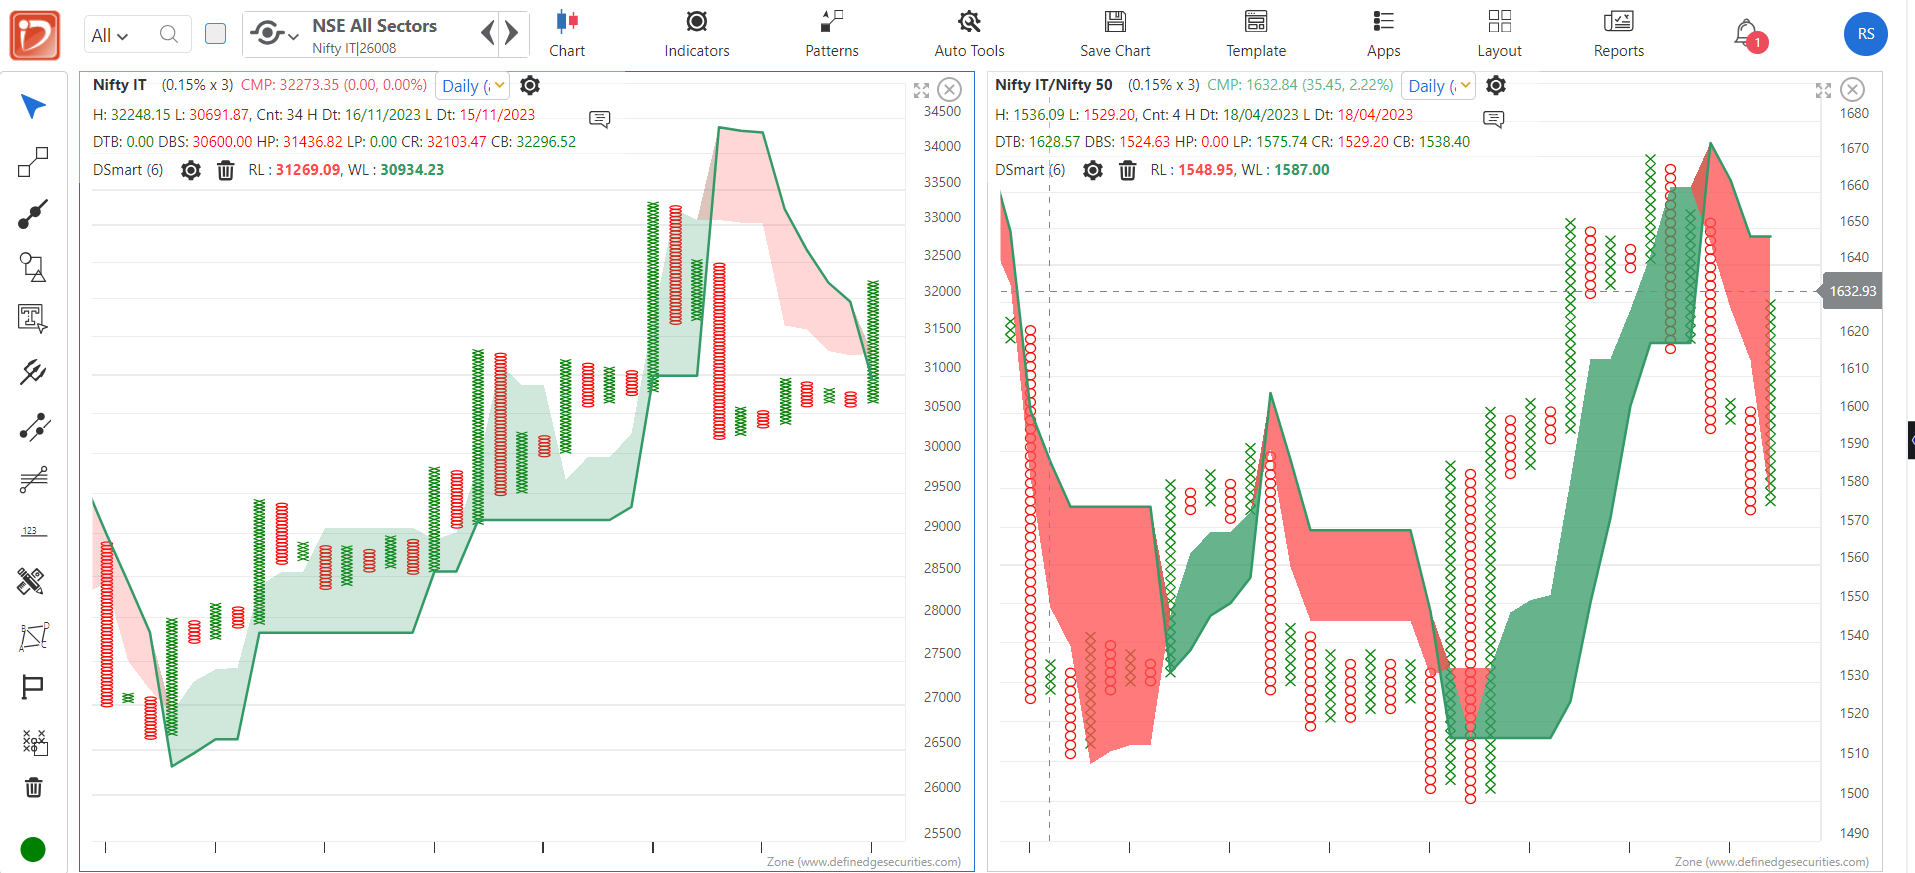
Nifty IT is doing well from last few sessions. The price has turned bullish by breaking out the D smart(6) line. The RS chart is still below D Smart line. The broader RS chart of Nifty IT vs Nifty 50 sideways to bearish. Is this a reversal? Let's check if the breadth can give some clues.
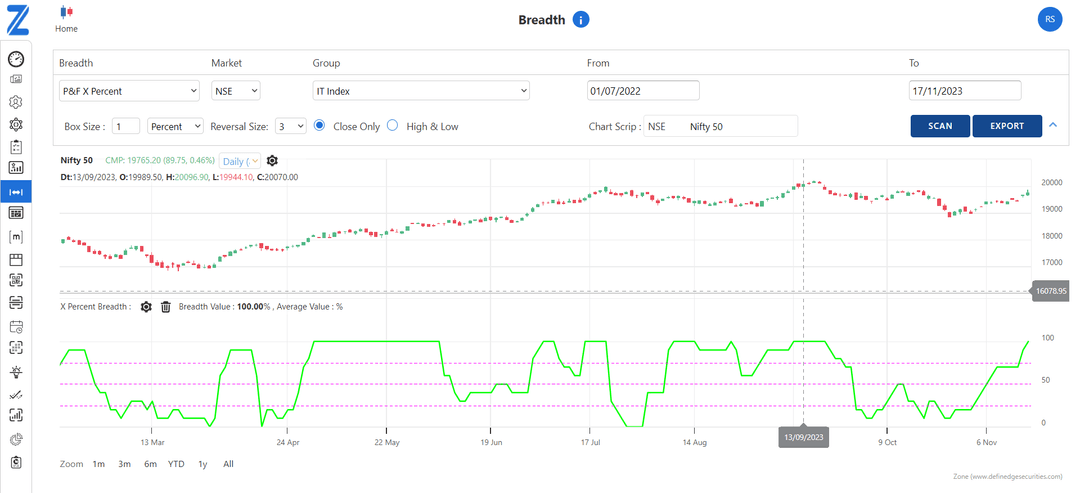
Whenever breadth moves from Overbought to Oversold and again reaches overbought zone, it is mostly bullish. We should wait for a breadth cool off and let it come in the neutral zone. Once it is neutral zone and nifty remains bullish, we can trade Lion patterns. If the breadth cools off and doesn't visit oversold zone and reverses, there can be a clean, strong and less volatile trend.
Nifty IT zone is a buzzing sector as the breadth is 100%in terms of both X% and DT%. Since there are few signs of reversal, the ranking score has improved from negative to 30. For me, Ranking score above 50 is strong.
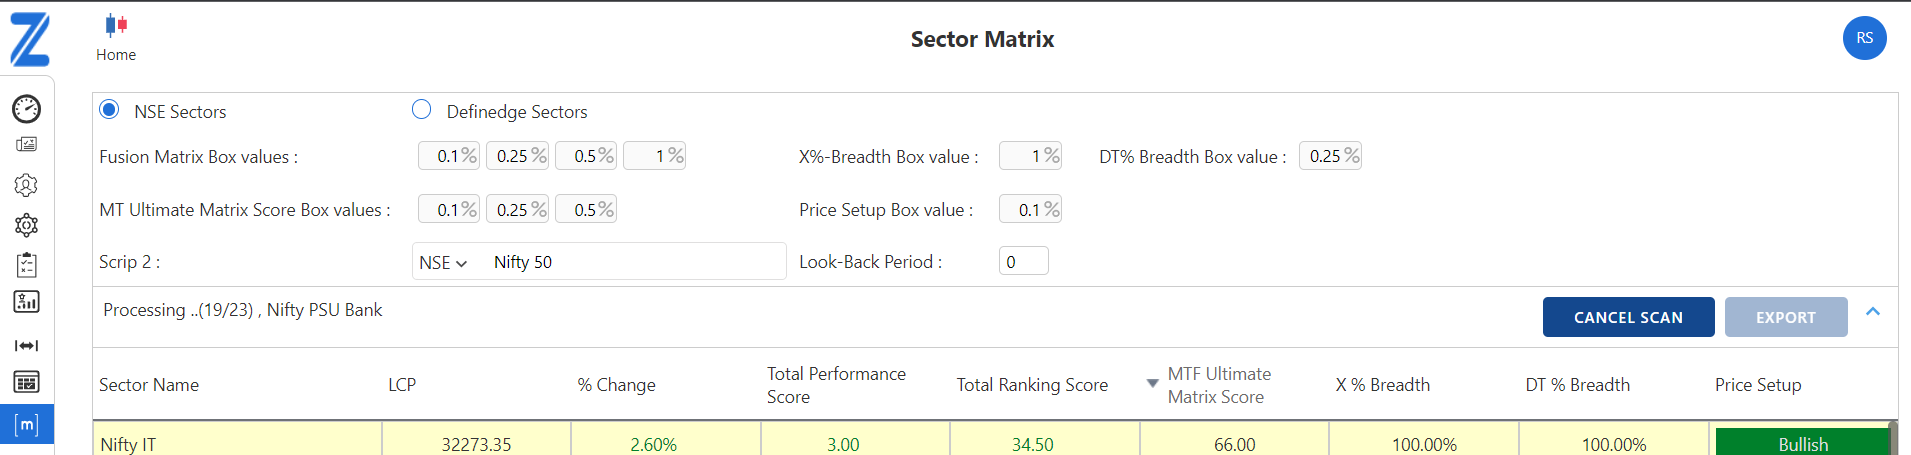
Short term traders can trade the breakouts with aggressive profit booking. But waiting for the breadth cool off and trading the Lion Patterns will make more sense. -
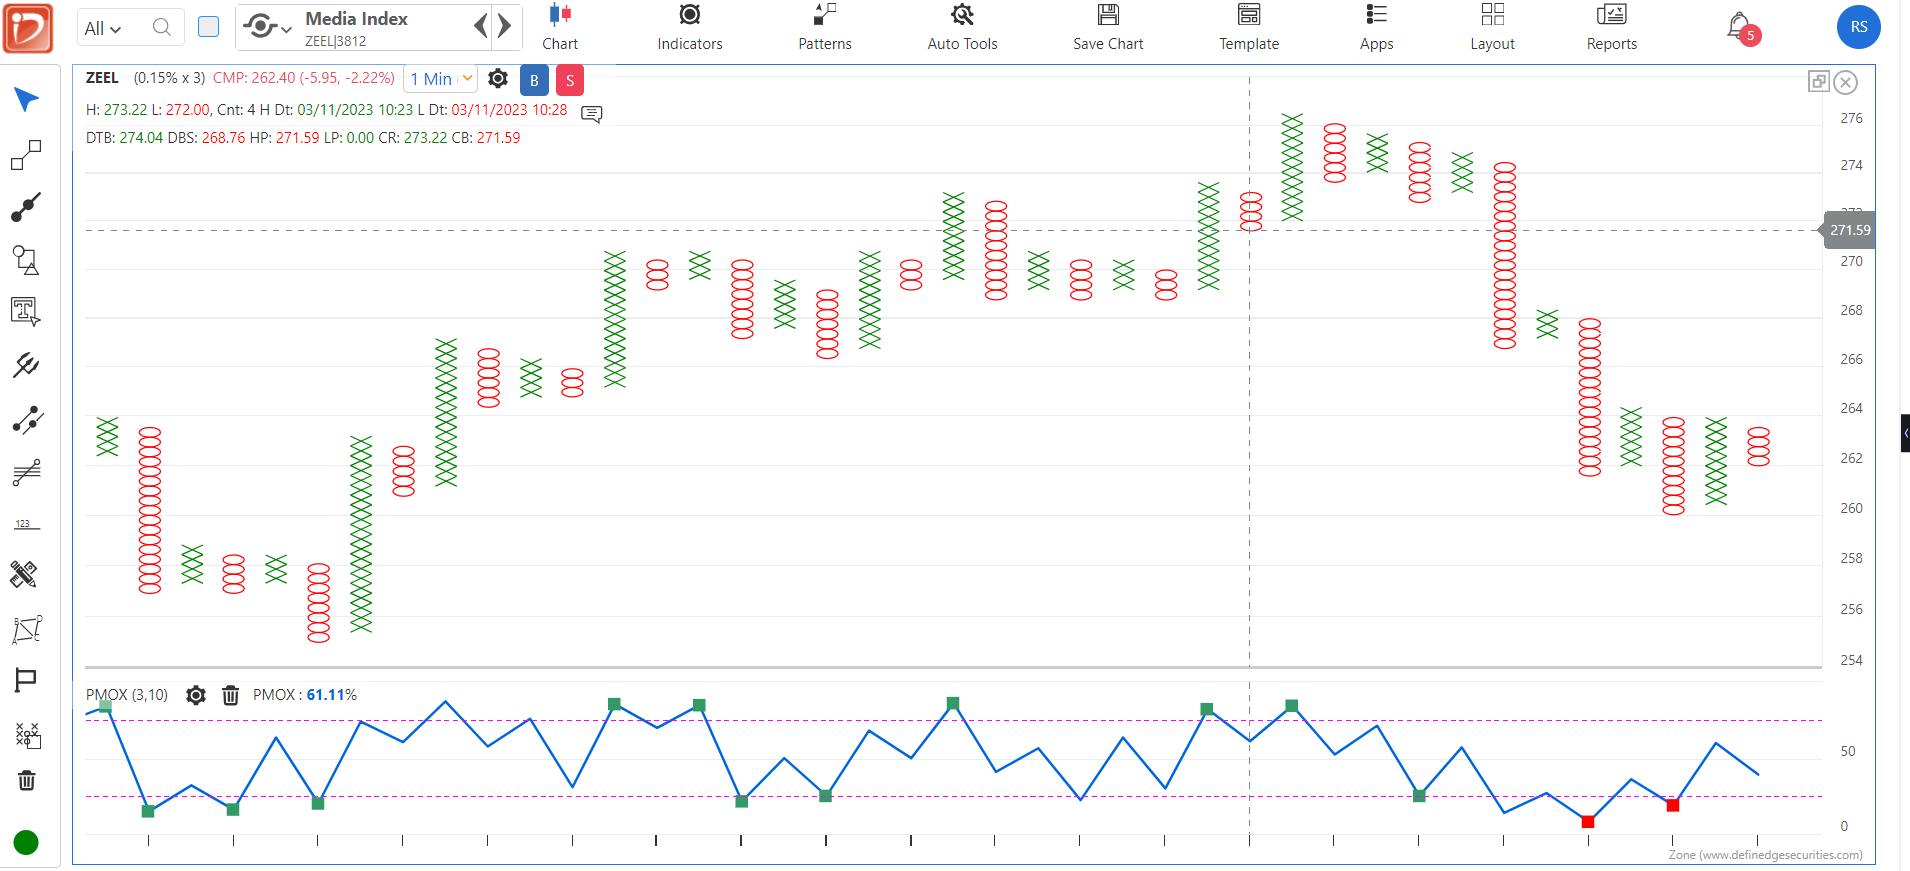
Selling Options in extreme zone is rewarding. Media Breadth is 90% DT% is 20%( Lack of momentum). Zeel is below MAST. PMOX is bearish. Selling calls if the price goes below 260 will make sense.
-
When the upper band is rising, numerator is outperforming the denominator. When the lower band is falling, the numerator is underperforming the denominator. When the ratio chart is moving between the flat bands , it means that the relative performance is at par.
-
- No. The price can be anywhere between the upper and lower bands. Not necessarily showing 240 day high at the last candle.
- Price is bullish if it is above middle band and vice versa.
- No as it will be a breakout above mentioned no of bricks which can be below previous top.
-
- The range is shrinking similar to triangle formation , inside bars formation.
2.Consolidation in a tight range
3.high volatility. Broadening patterns. - Last 20 brick Price high low
- The range is shrinking similar to triangle formation , inside bars formation.
-
This is really helpful sir. Next release should.have straddle charts, RS charts and Breadth scanners. It will be a complete app then. If u can add.buzzer in the app,it will be cherry on the top. I am not apologetic about my asks as definedge team has always over delivered on our expectations

-
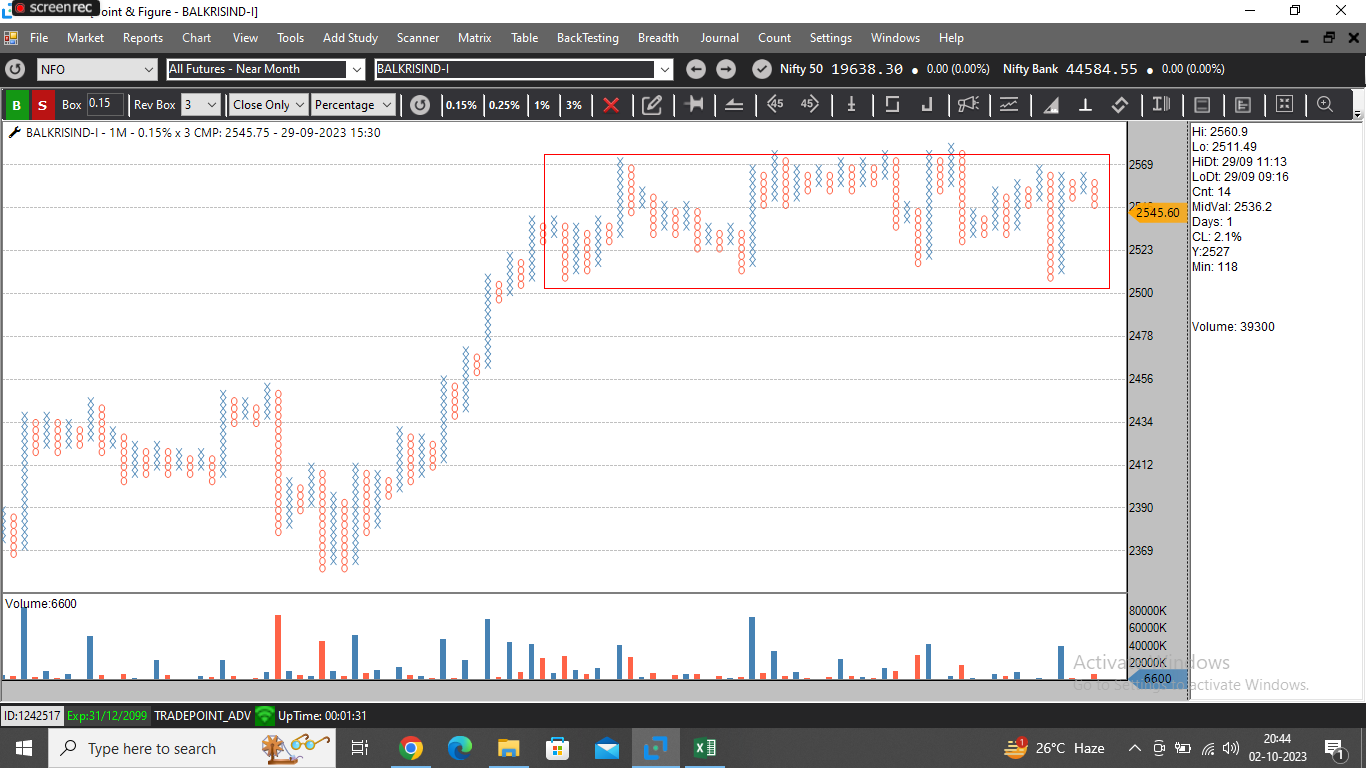
Balkrishna Industries - The price is consolidating in 2.8% range from last 15 days. It has given weak breakouts for a couple of times but the price did not fall below the low of the range. Interestingly, a variation of selling climax will be triggered if the price breaks out above 2465. During this period, 1% breadth for Auto sector has fallen from overbought zone to below mid level (bearish). I will wait for Auto breadth to cross 50 level and wait for balkrishna futures cross 2580 and will trade a FT with mast L2 as a sl.with pricing going above 2580, it will also be a cup and handle formation.
The confirmations on breadth and price are awaited as the RS is already positive for the stocks. Let's see what happens. -
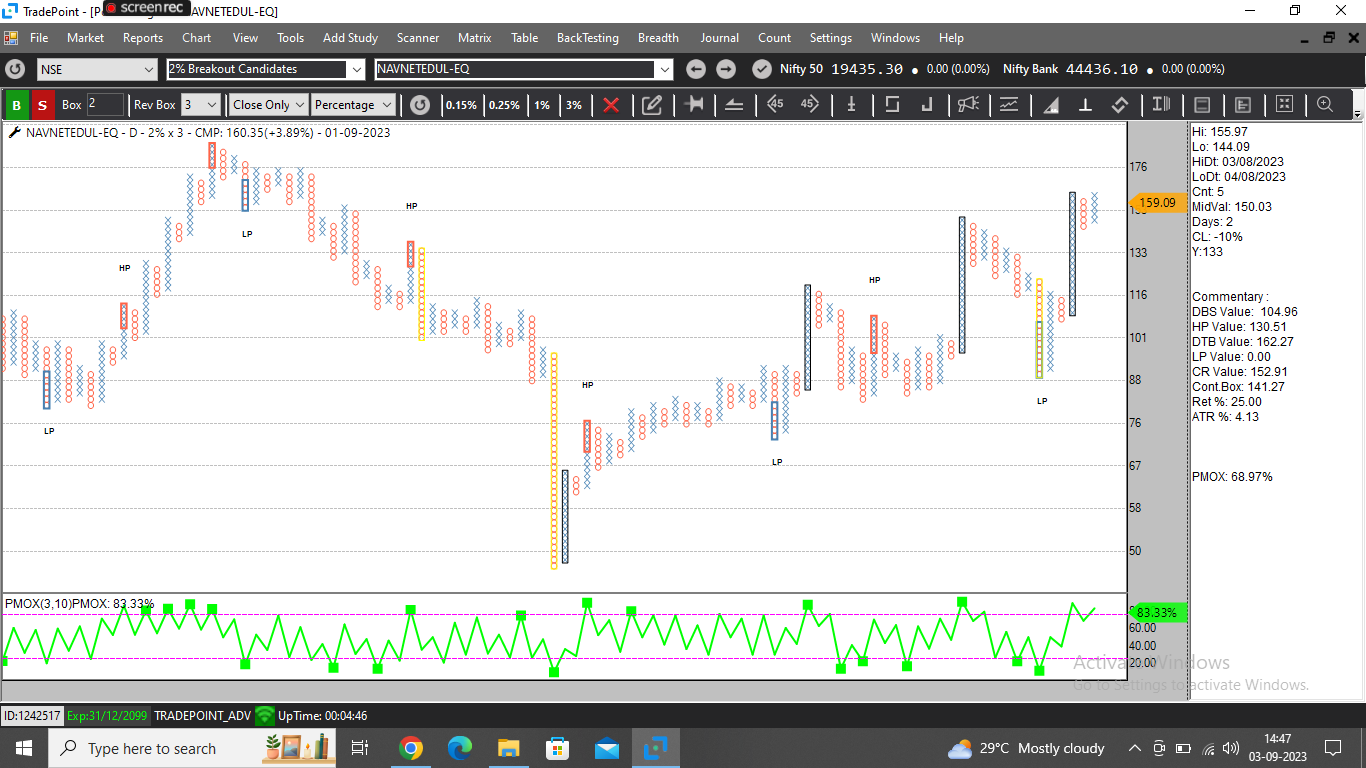
Navneet looks good with a DTB at 163 and SL at 141.
-
@Lalsinh Parmar my pleasure
-
@Prasad Udgirkar thank you sir
-
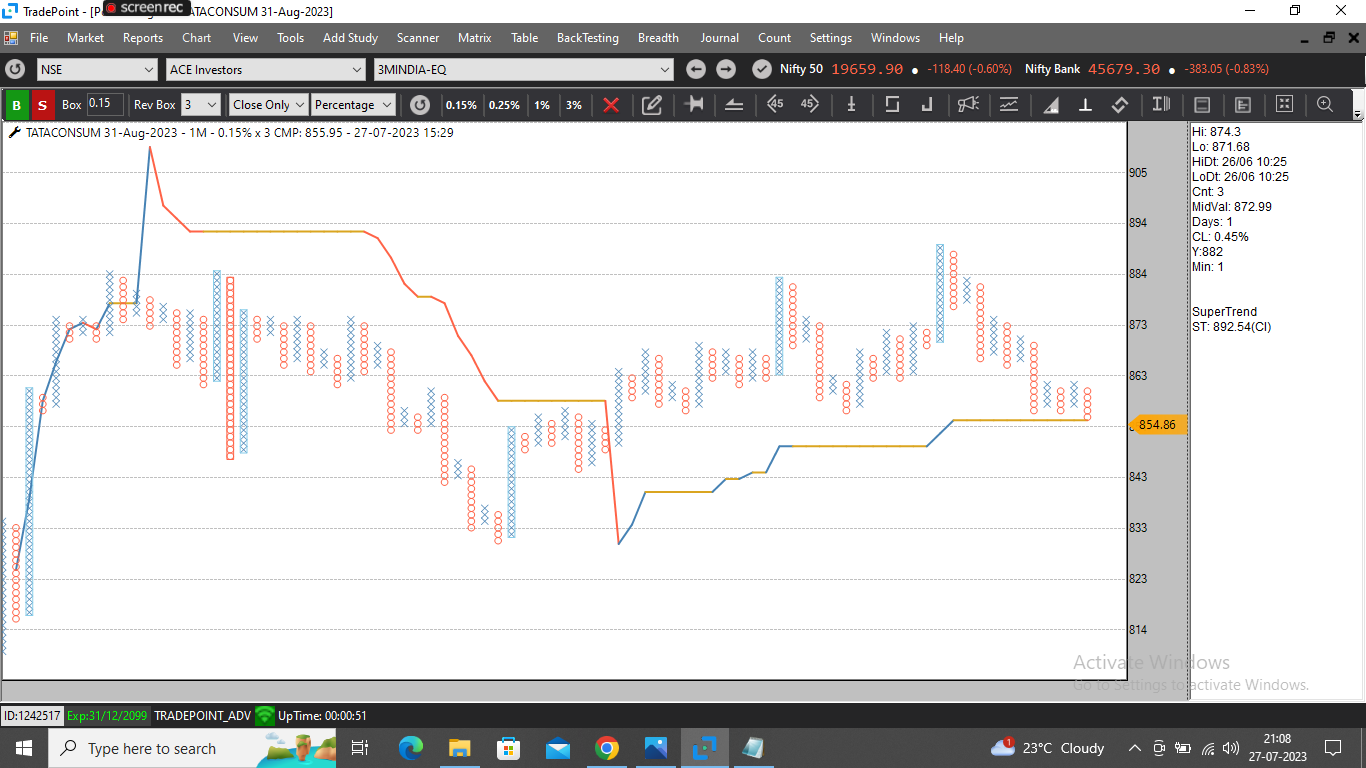
TATACONSUMER Aug Future chart has trigger a TBS signal near Supertrend support line. the price has negated previous 2 Anchor columns. There is no buy signal after the bullish anchor column and continuation sell signals are generated.
It can be traded with MAST indicator as L2 signal if the MAST cloud turns bearish.
-
@RAGUNATH_AG thanks buddy.
-
@Prasad Udgirkar thank you sir.
-
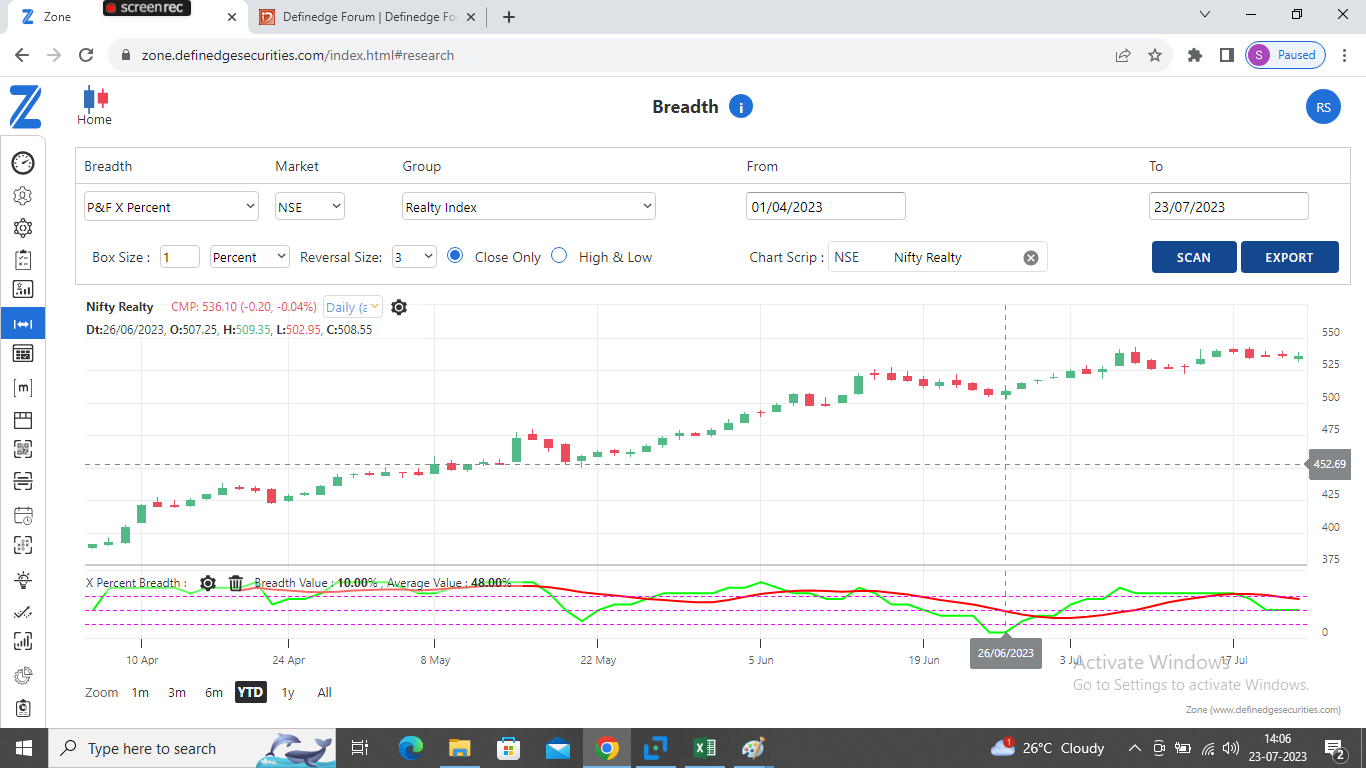
Interesting observations on the reality index. The breadth was oversold 26th June. But the RS chart was positive which is a rare phenomenon.
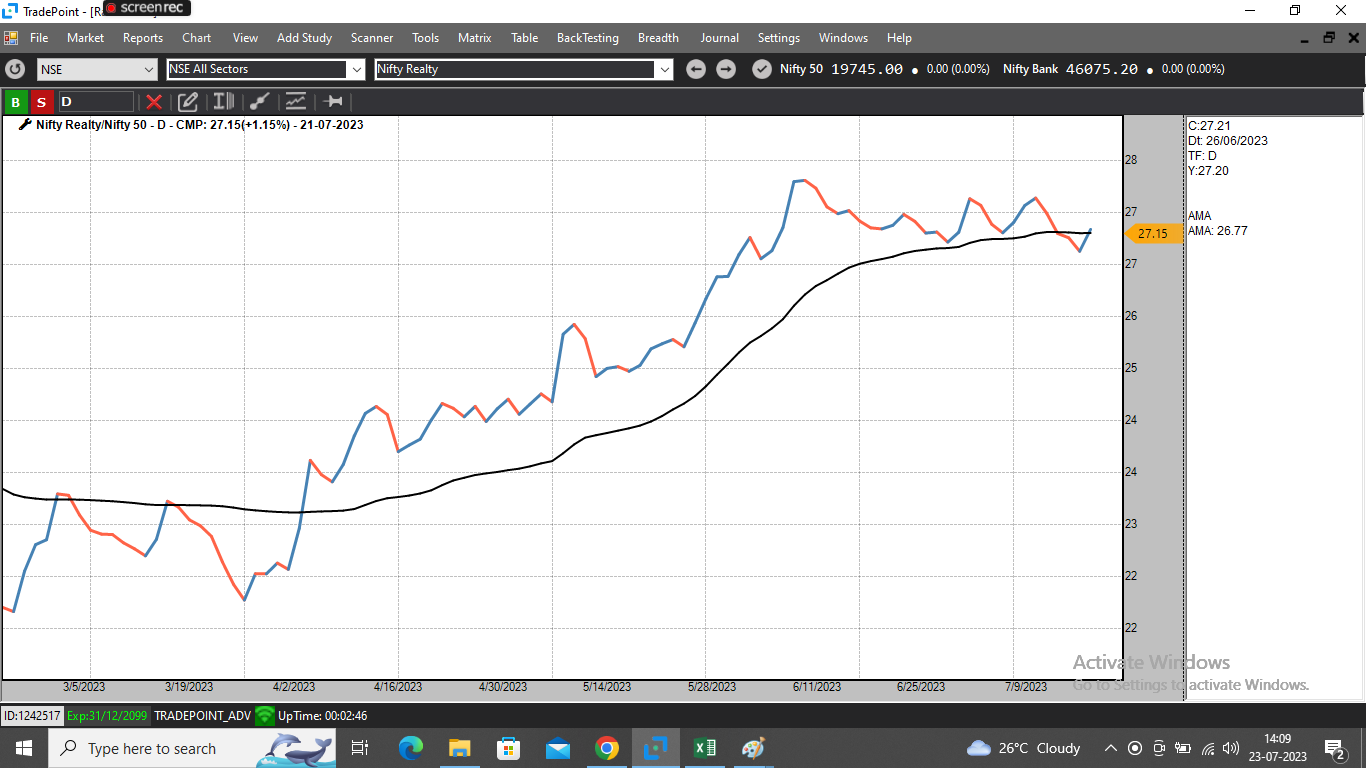
The price was in column of O. Interesting that helped the disparity to cool down.
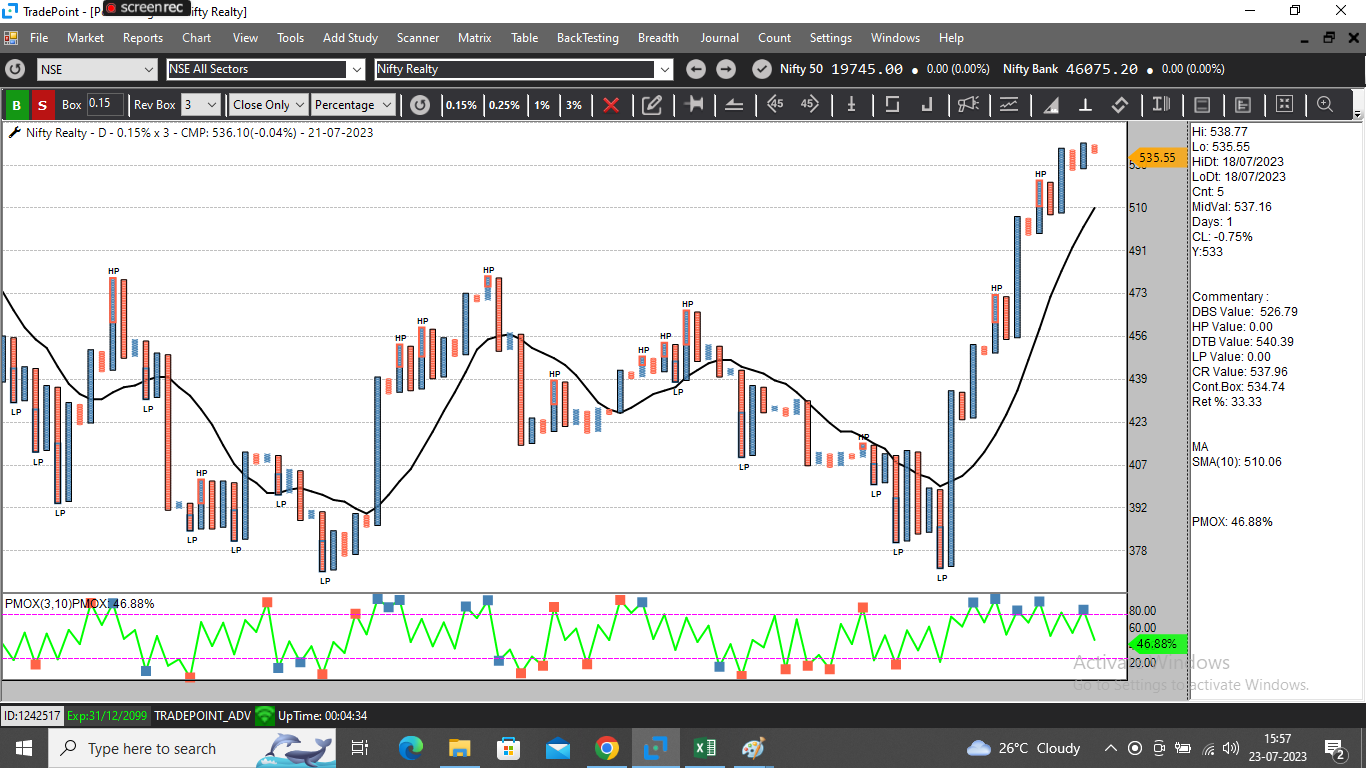
The breadth on ATR% on 5% is zero indicating low volatility and a smooth trend ahead.
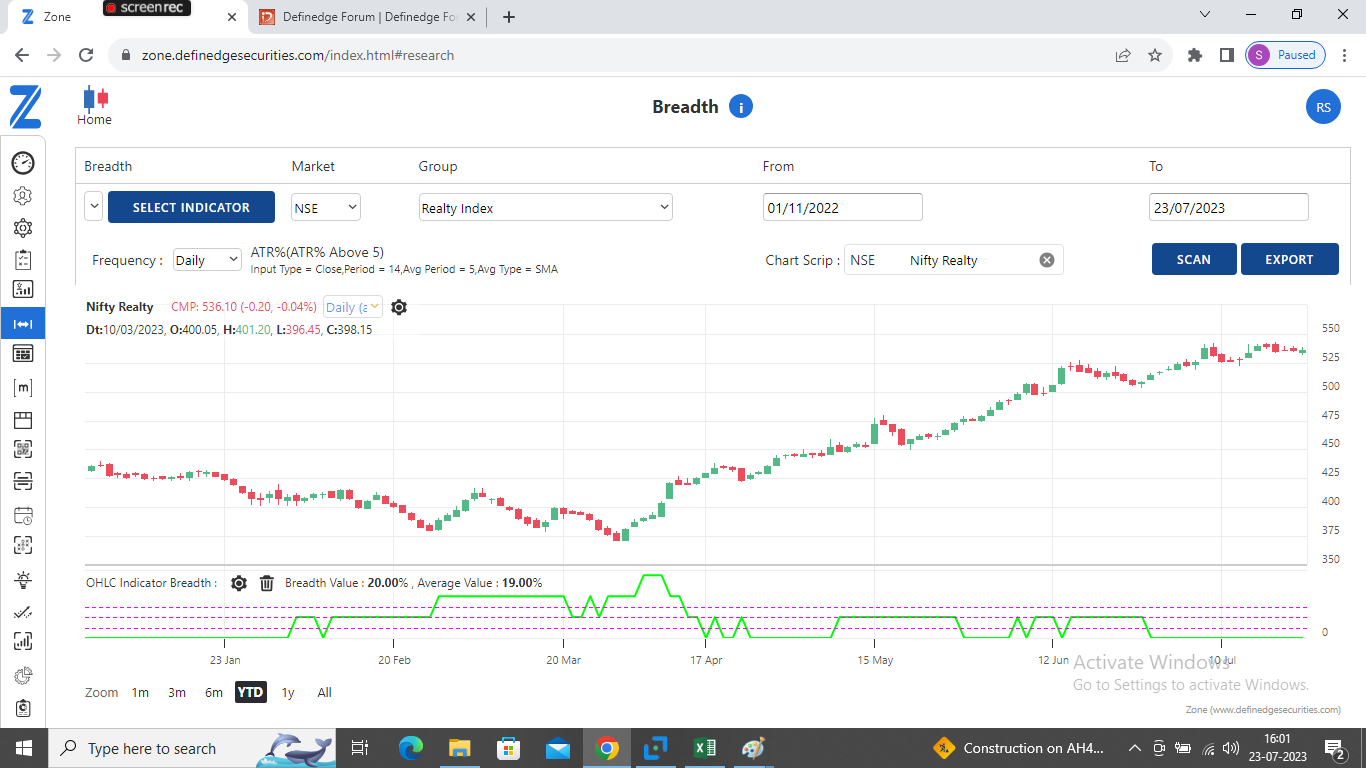
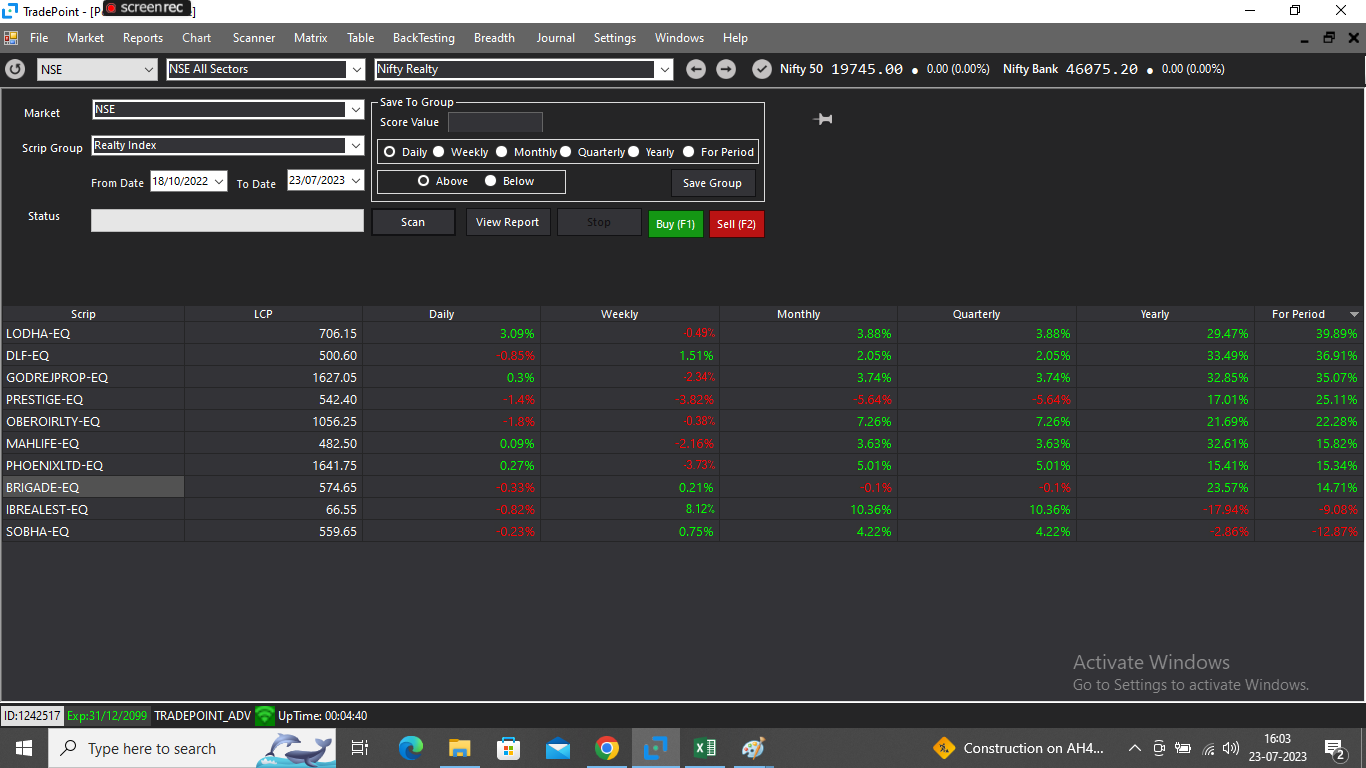
The Performance Table for realty index is as below. These stocks can be part of your watchlist and long trades can be initiated as per your system.
-
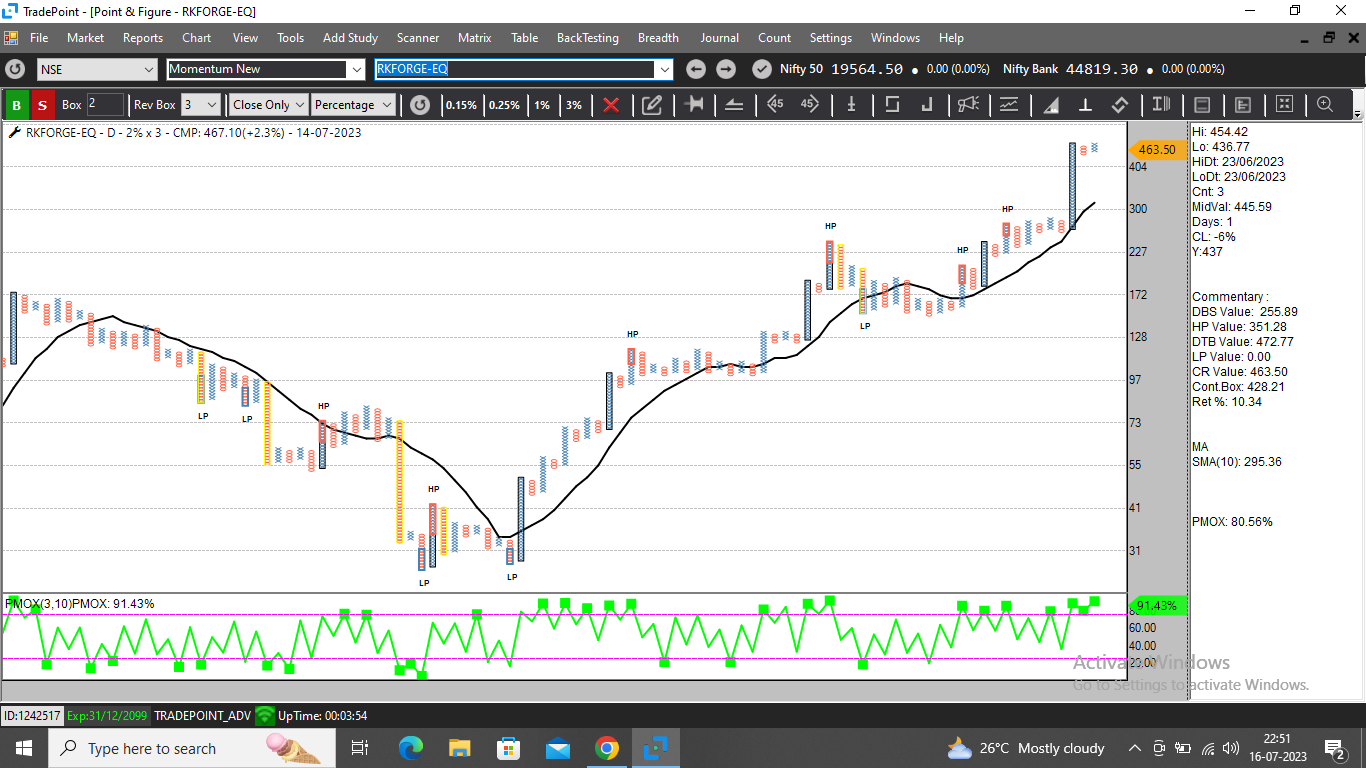
RKforge is an outperformer. a DTB at 473 with a SL at 428 is offering an affordable entry.
-

There is negative divergence on Nifty IT chart where price is rising but the ration line is falling. In PnF chart also Price is above moving average with a DTB but the RS chart is below moving average. It is a caution for any long entries for this sector.
The price may keep rising for few sessions and may fall if the RS does not improve. Any bearish signal on price chart below moving average can be a good trade in such scenario. -


there is a climax pattern in 3% daily tf. Bearish anchor column is negated by a bullish anchor column with higher volumes. A follow through at 193 will confirm the pattern. Stop-loss is affordable. I will enter above 200 as it will be a turtle breakout (26 weeks) on OHLC chart. -
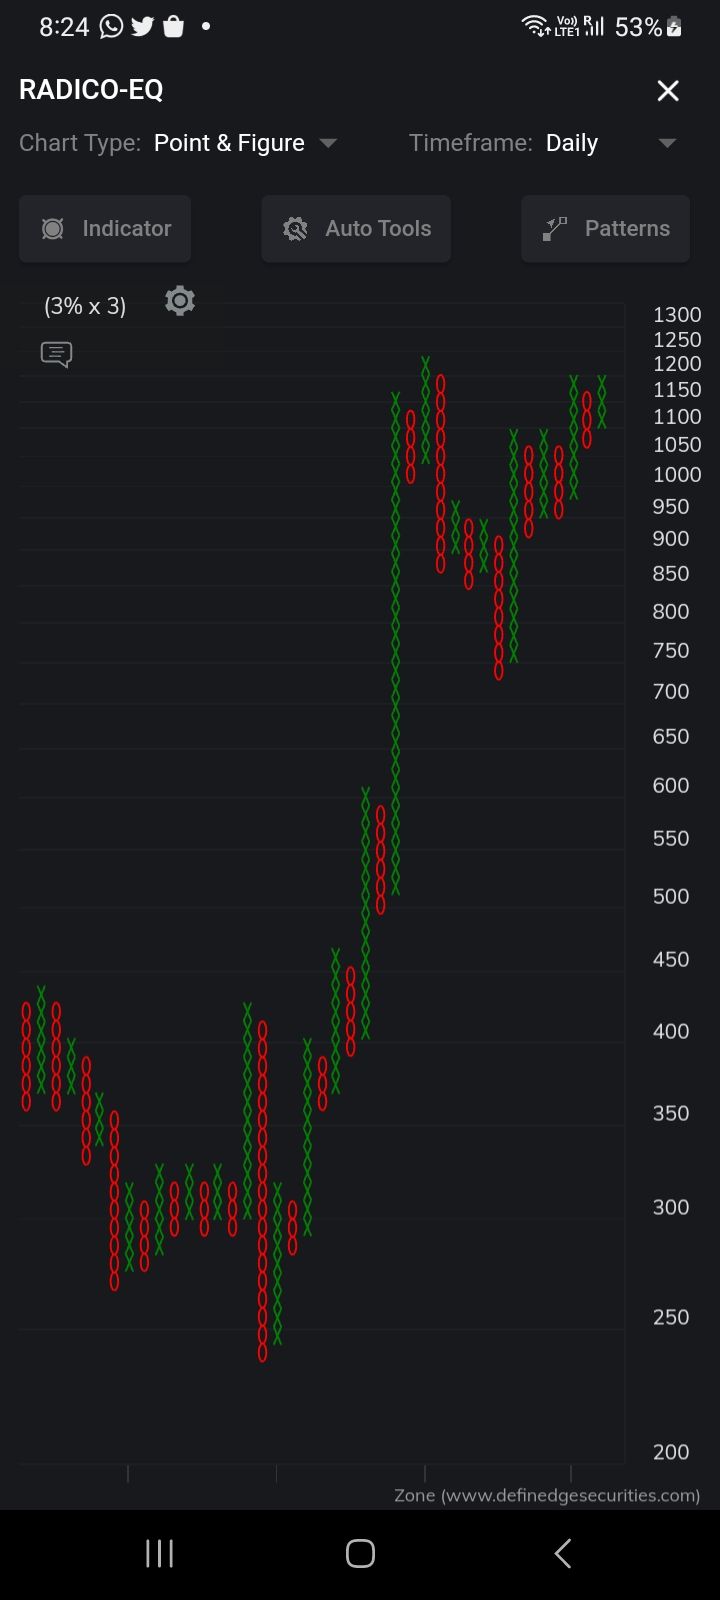 bolded text
Radico is outperforming Nifty50 and Nifty 500. A DTB at 1241 can be traded with a SL at 1070.
-
Nice Chart Prasiddh
-
@Prashant Shah This is a very important video. People generally like videos about new strategies or any indicators. But what you discussed in the video is about most important aspect which is spoken less about. If you would have noticed, you were explaining the concepts with a lot of passion. You have put in a lot of heart in explaining this as you wanted everyone to follow this thing for sure. I can relate to what you explained. Thank you having a video on trading psychology.
-
@Prashant Shah Thank you Sir
-

Elecon is outperforming the Nifty 50 and Nifty 500 universe. To the left of the chart, you can see 2 ACs. The first AC is followed by 4 column triangle breakout. Now there is an anchor column FT with a probable & affordable DTB. Entry 593 Stop-loss 511.
-
On 3%, it is a dtb on daily tf.
-


The AMMA and AMA indicators are indicating that it is outperforming Nifty 50. The Price has moved away from the AMA and the ratio line has also moved away from AMMA. There is a DTB triggered on 3%.
Entries can be planned at the CMP with a flat % as the current SL is more than 20%. Or one can wait for a small retracement and take a position on a DTB.
One can also switch to smaller box size and take entry on an affordable DTB. -
@Prashant Shah sir, I faced this issue and I am really happy about it because I thought that I have made it just by learning the charts and few systems. But the truth is that the technical analysis is necessary but not the ultimate thing. Execution is the key. Trading Psychology is the important thing. I am lucky to have mentors like you. I started to execute few trades with a stop-loss and with ZERO emotional attachment. That went well and my conviction increased. I am trying to improve with every trade. Saarthi is a very good initiative to improve trading psychology and execution skills.
Options Liquid Futures Top 50 - Options ATM Group
Renko Charts for historical charts in Opstra
Optimization Over Maximization
Best Practice for Stop Loss on 1% x 3 Daily P&F Chart
Indicator Charts in Rzone
Swing Trading
Placing orders from the charts - Nice Feature introduced
RSI Divergence Conditions in the System builder
Time-Based Corrections: The Invisible Test of Patience
Login Problem in momentify when already logged in zone web in another tab
Renko | Long Options using DC, BI and Divergence
Renko | Long Options using DC, BI and Divergence
Renko | Long Options using DC, BI and Divergence
Renko | Nifty Short Options | Swing Trading System
Most Trading Mistakes Start with One Thing: Attachment
Tick Charts in Zone terminal and Mobile App
Indicators Guide You. Execution Defines You.
Everything about Momentum Investing & Trading
Anchor Support Resistance breakout condition in the system builder
Everything about Momentum Investing & Trading
Need a MKLH video from Raju sir and AP sir
Uncertain Days, Consistent Discipline
Lets Execute the Trade - Banknifty 49300 PE Short
Lets Execute the Trade - Chola Fin March Future
Lets Execute the Trade - Chola Fin March Future
Lets Execute the Trade - MFSL March Future Long
Indicator Based Stoploss
Lets Execute the Trade - MFSL March Future Long
Lets Execute the Trade - Chola Fin March Future
Lets Execute the Trade - Banknifty 49300 PE Short
Lets Execute the Trade - Banknifty 49300 PE Short
Lets Execute the Trade - Banknifty 49300 PE Short
Lets Execute the Trade - Chola Fin March Future
Lets Execute the Trade - MFSL March Future Long
Lets Execute the Trade - Banknifty 49300 PE Short
Lets Execute the Trade - Banknifty 49300 PE Short
Lets Execute the Trade - Banknifty 49300 PE Short
Lets Execute the Trade - Banknifty 49300 PE Short
Lets Execute the Trade - MFSL March Future Long
Lets Execute the Trade - Chola Fin March Future
Lets Execute the Trade - Banknifty 49300 PE Short
Lets Execute the Trade - Banknifty 49300 PE Short
Lets Execute the Trade - Banknifty 49300 PE Short
Commodity: - NATURAL GAS
Lets Execute the Trade - Banknifty 49300 PE Short
Lets Execute the Trade - MFSL March Future Long
Lets Execute the Trade - Chola Fin March Future
Commodity: - NATURAL GAS
Lets Execute the Trade - Chola Fin March Future
Lets Execute the Trade - MFSL March Future Long
Lets Execute the Trade - Banknifty 49300 PE Short
Lets Execute the Trade - Banknifty 49300 PE Short
Lets Execute the Trade - Banknifty 49300 PE Short

Lets Execute the Trade - Banknifty 49300 PE Short
Promoters + Institutions Favourite Companies = Triple Boost
Lets Execute the Trade - MFSL March Future Long
Promoters + Institutions Favourite Companies = Triple Boost
Lets Execute the Trade - Chola Fin March Future
Lets Execute the Trade - Banknifty 49300 PE Short
Lets Execute the Trade - Banknifty 49300 PE Short

Lets Execute the Trade - Banknifty 49300 PE Short
Trading with Probability: Follow the System, Not Predictions
Need an option in the Auto trader to define the initial Stoploss in terms of indicator condition
Lets Execute the Trade - Banknifty 49300 PE Short
Lets Execute the Trade - Chola Fin March Future
Trading with Probability: Follow the System, Not Predictions
Need an option in the Auto trader to define the initial Stoploss in terms of indicator condition
Identify the patterns that trigger your negative emotions to avoid over trading / revenge trading
Identify the patterns that trigger your negative emotions to avoid over trading / revenge trading
Sector Momentum Analysis
Are you a trend follower ? if yes then this post is for you
Baadal Kyun Garajata Hai
Analysis And Execution
Analysis And Execution
Smart Indicator: D Smart line
Doing Beats Knowing
Doing Beats Knowing
Doing Beats Knowing
Doing Beats Knowing
The Dillema of Pyramiding
The Dillema of Pyramiding
The Dillema of Pyramiding
Nifty IT View - Price,RS,Breadth
Selling Options when breadth is in extreme zone - Zeel 260 CE
Q&A Thread: Donchian Channel
Q&A Thread: Donchian Channel
Q&A Thread: Donchian Channel
Launching Scanners on the Definedge Zone Mobile Application
Balkrishna Indutries Oct Fut
Navneet Education Ltd
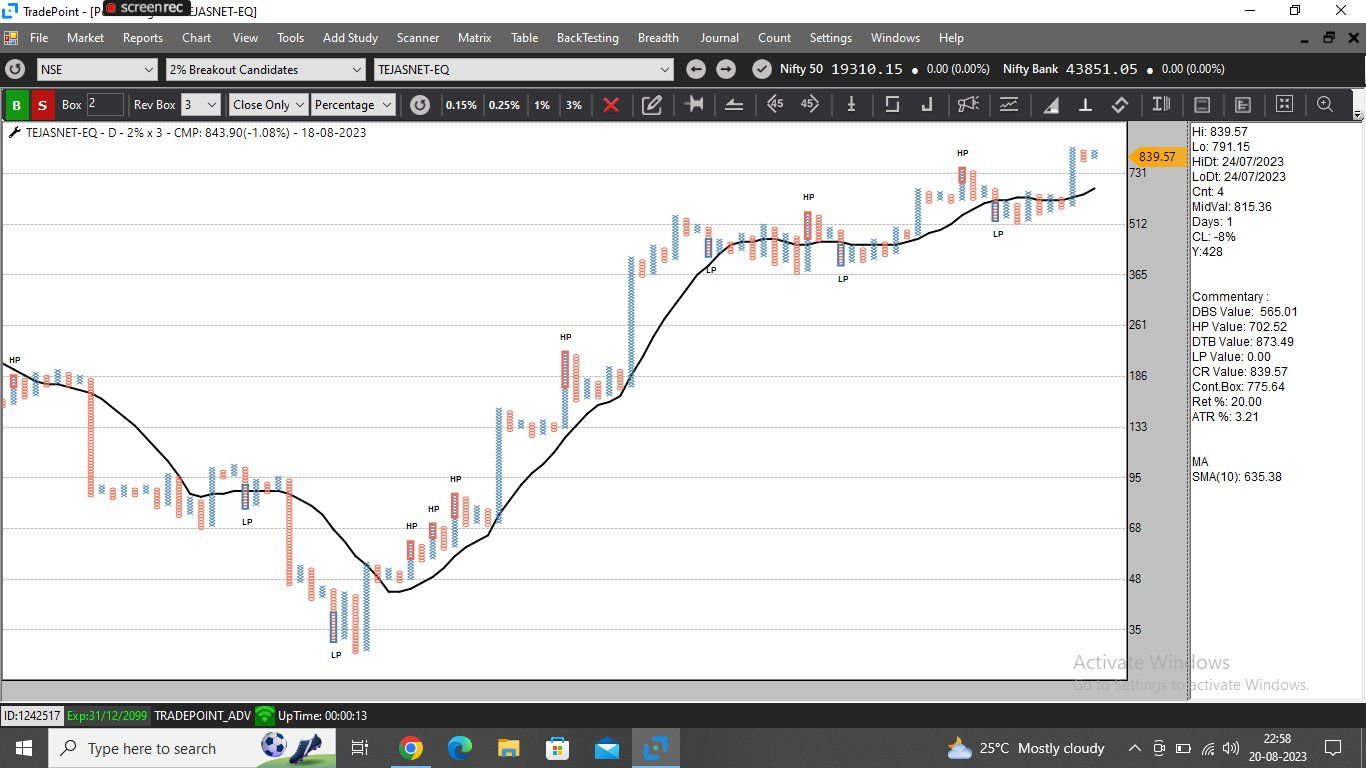
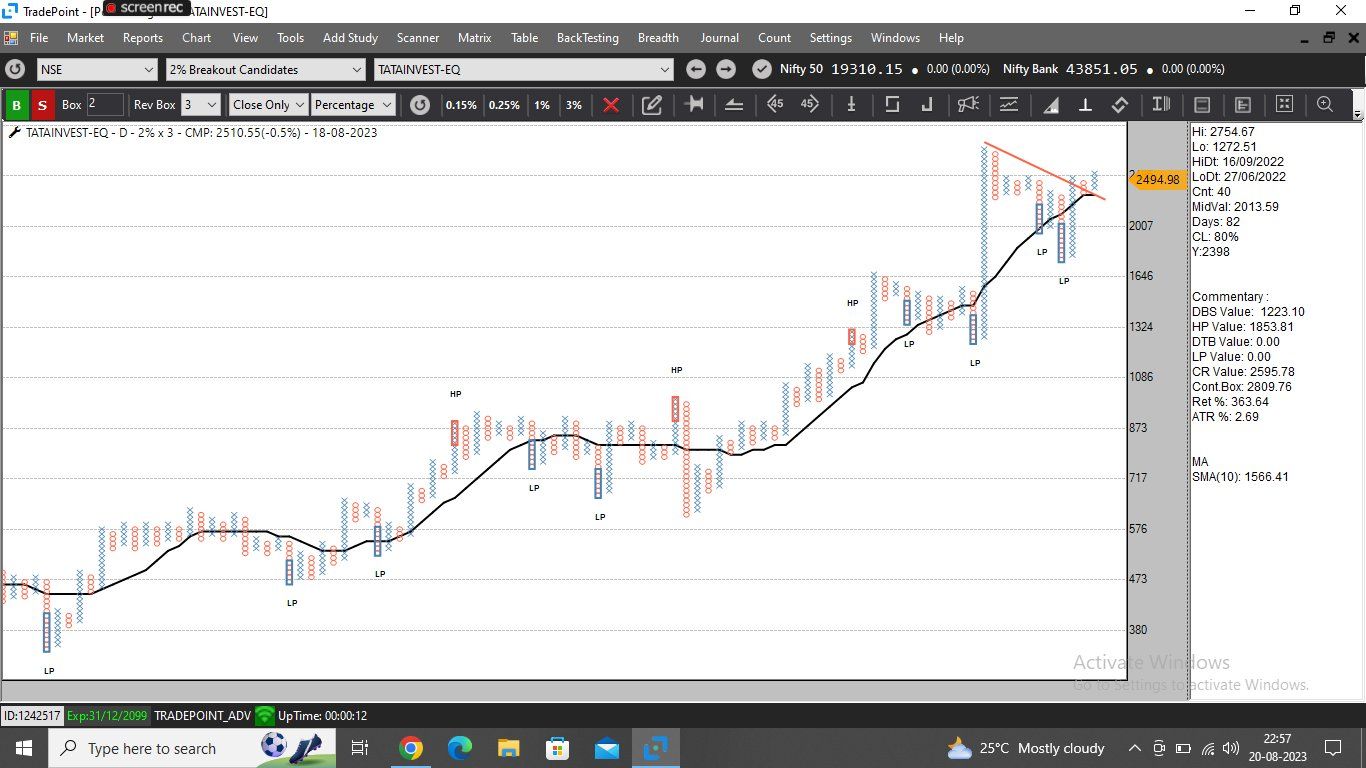
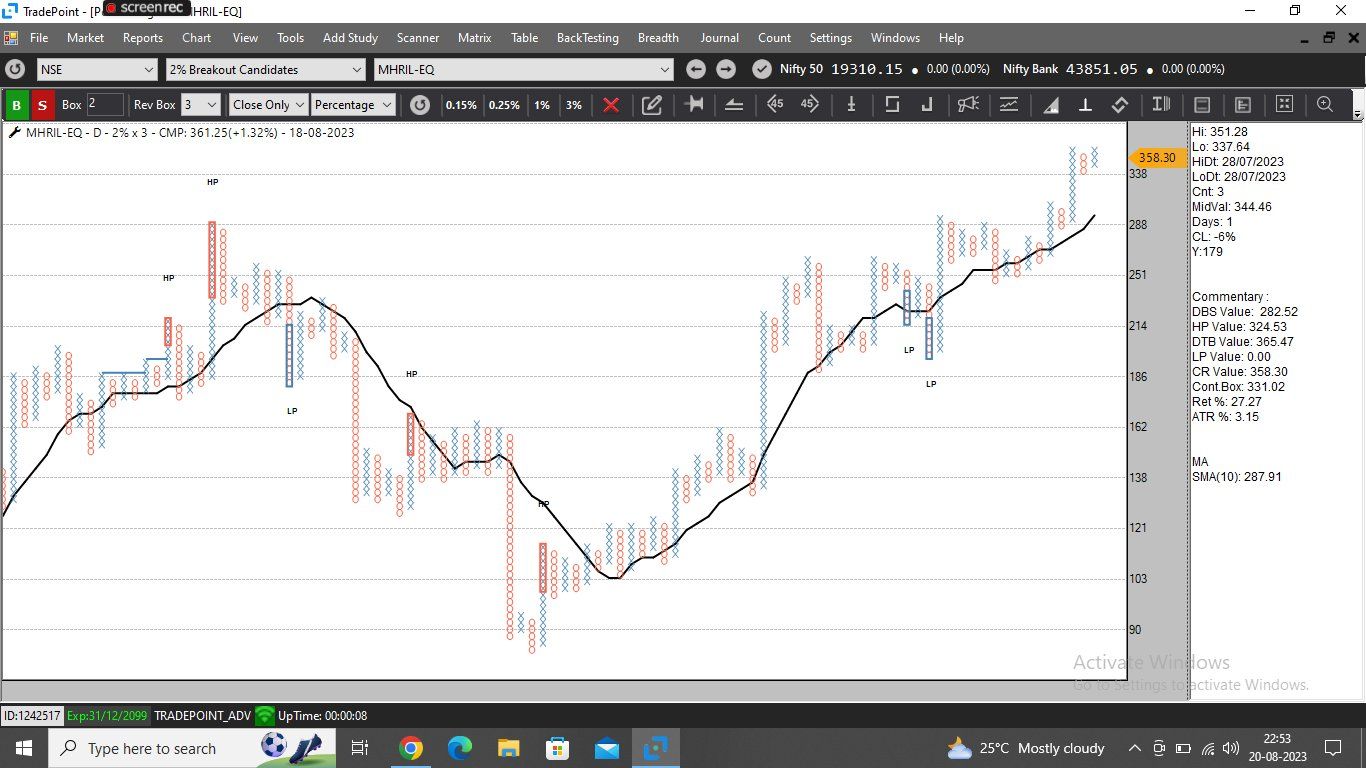
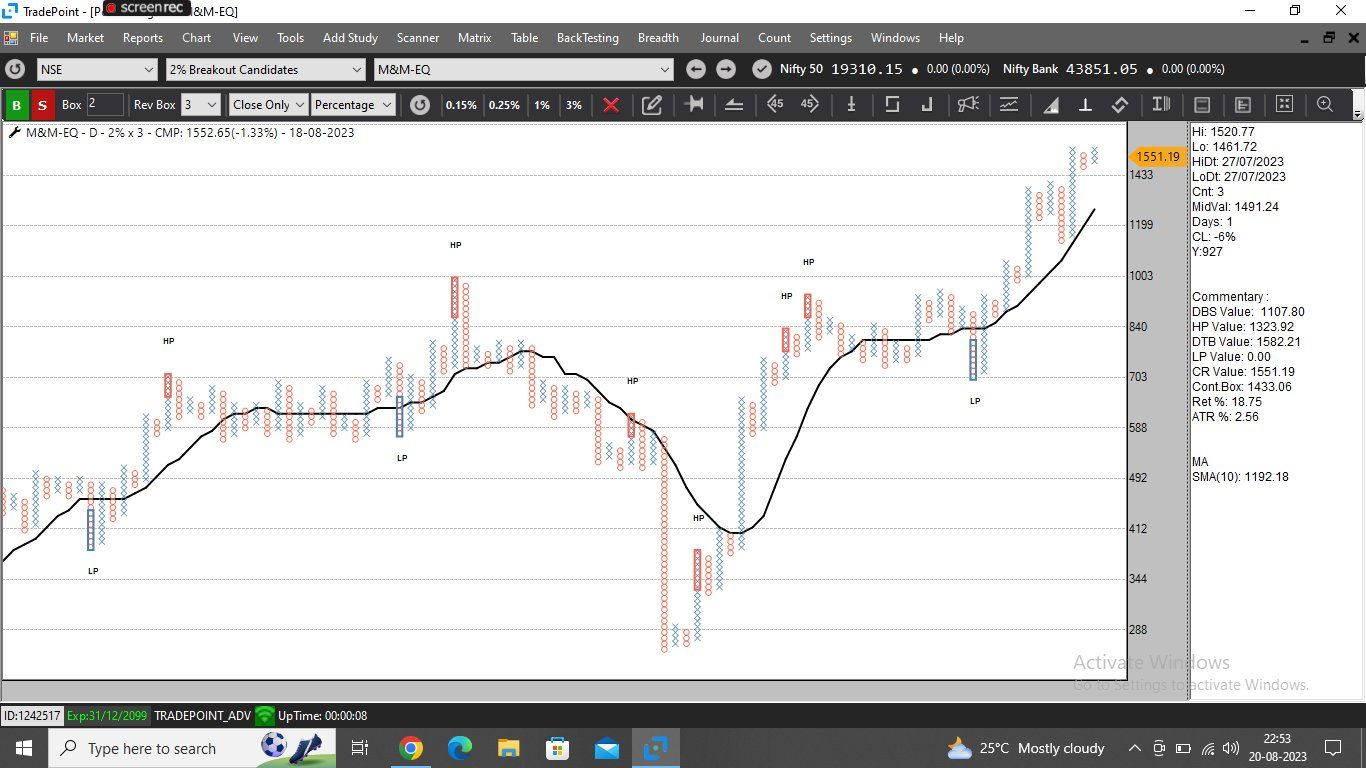
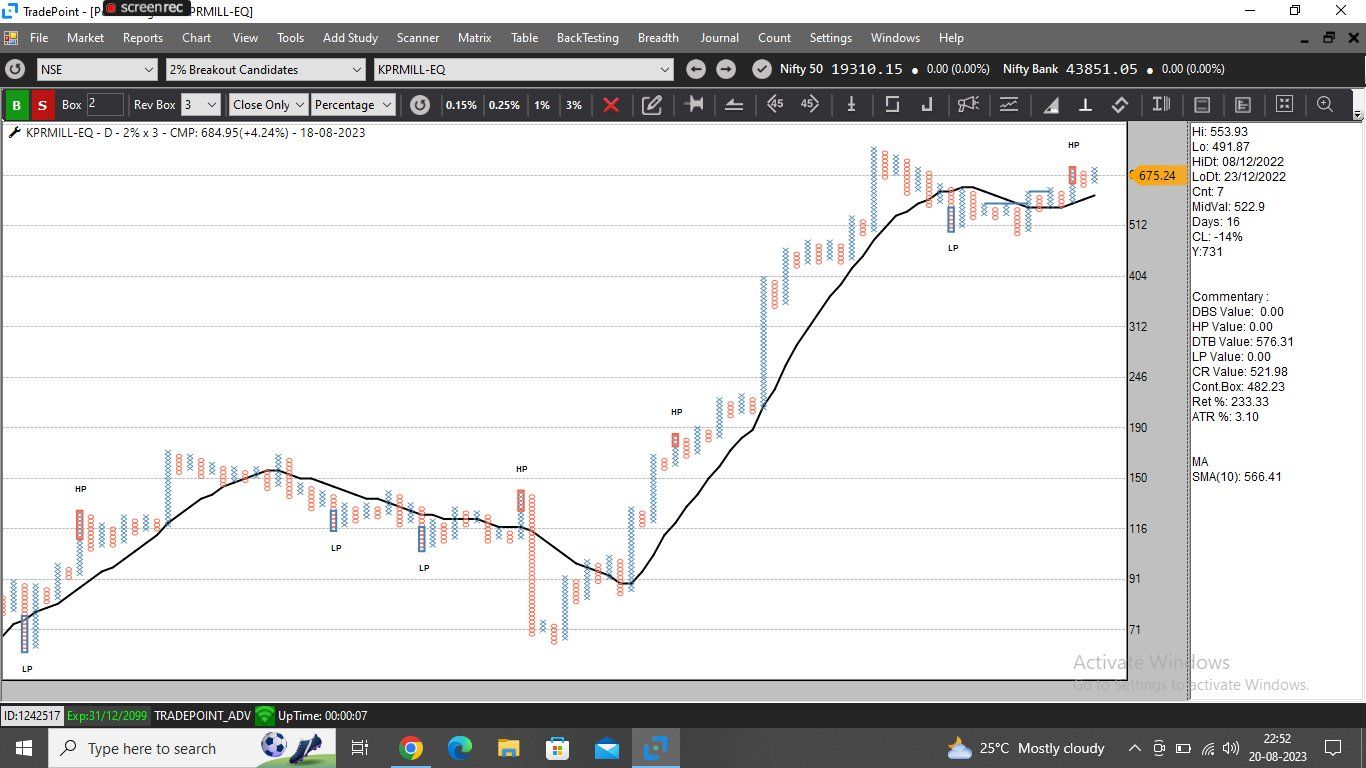
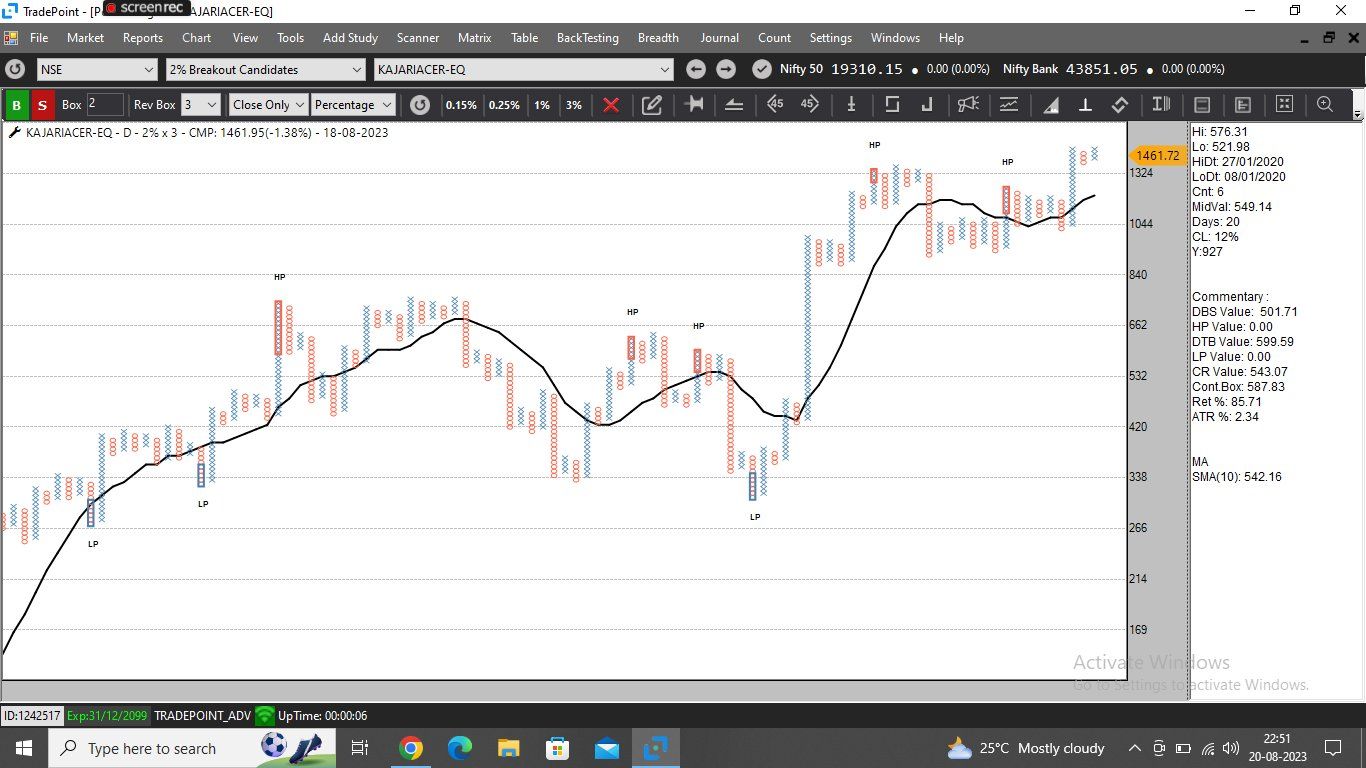
Breakout Candidates on 2% EOD charts with affordable entry
Breakout Candidates on 2% EOD charts with affordable entry
Breakout Candidates on 2% EOD charts with affordable entry
Tata Consumer Aug Future Bearish View
Interesting observations on Realty Index Breadth
Interesting observations on Realty Index Breadth
Interesting observations on Realty Index Breadth
RK Forge
RS Negative Divergence - Nifty IT
KOPRAN
Radico
Jupiter Wagons Ltd - JWL is looking attractive on the chart
The most important aspect of trading that every trader should be aware of
Avoid the common mistake of early exiting profitable trades
Elecon
KK's Corner
JSL
Avoid the common mistake of early exiting profitable trades