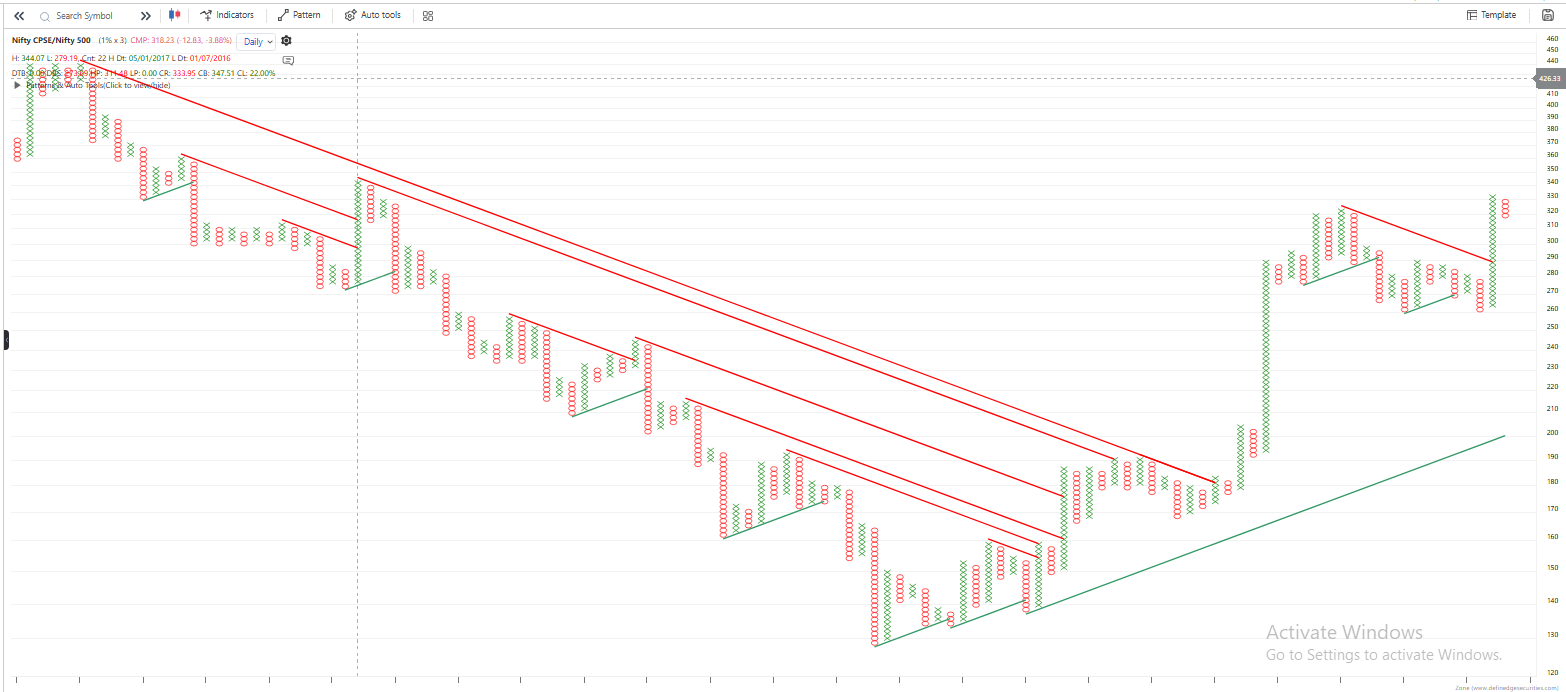
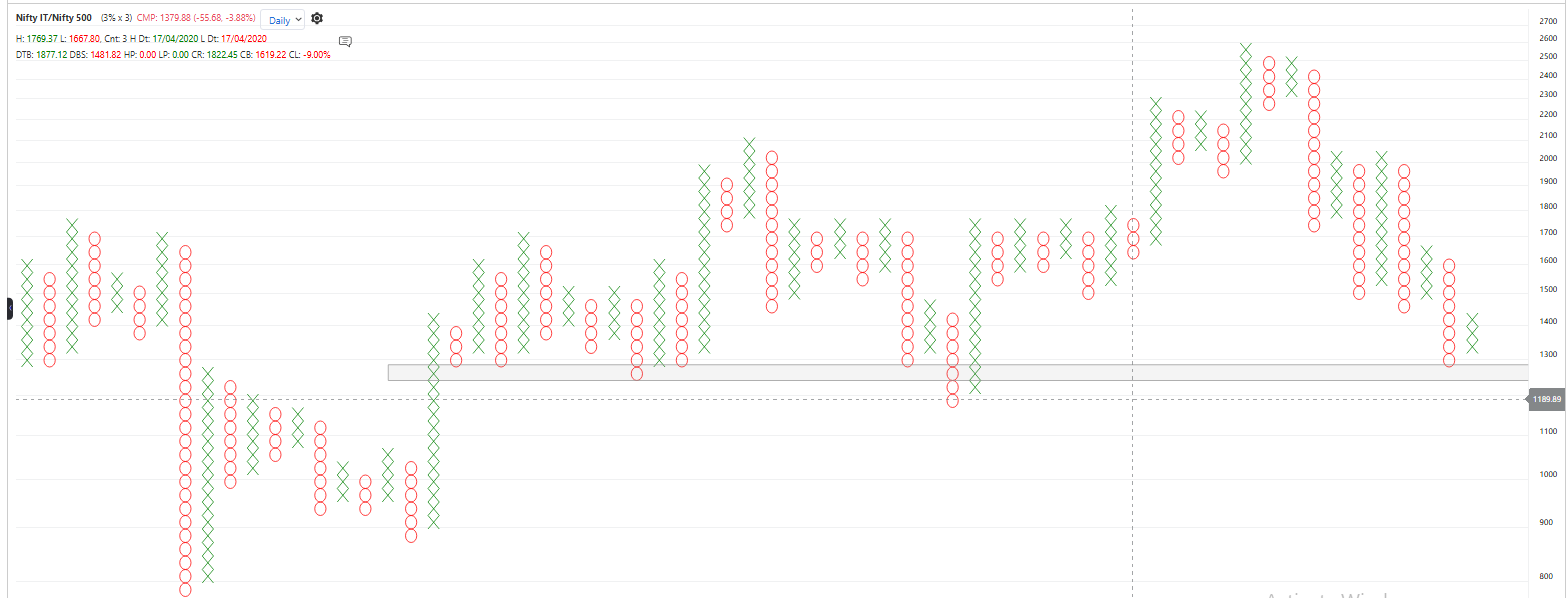
Looking at the relative strength of Nifty IT vs Nifty 500, the ratio is currently approaching an important support zone.
Historically, this level has acted as a base where the sector either stabilizes or begins to outperform. This makes the current setup interesting from a risk-reward perspective, especially if we start seeing supporting signals internally.
Strength Within the Sector
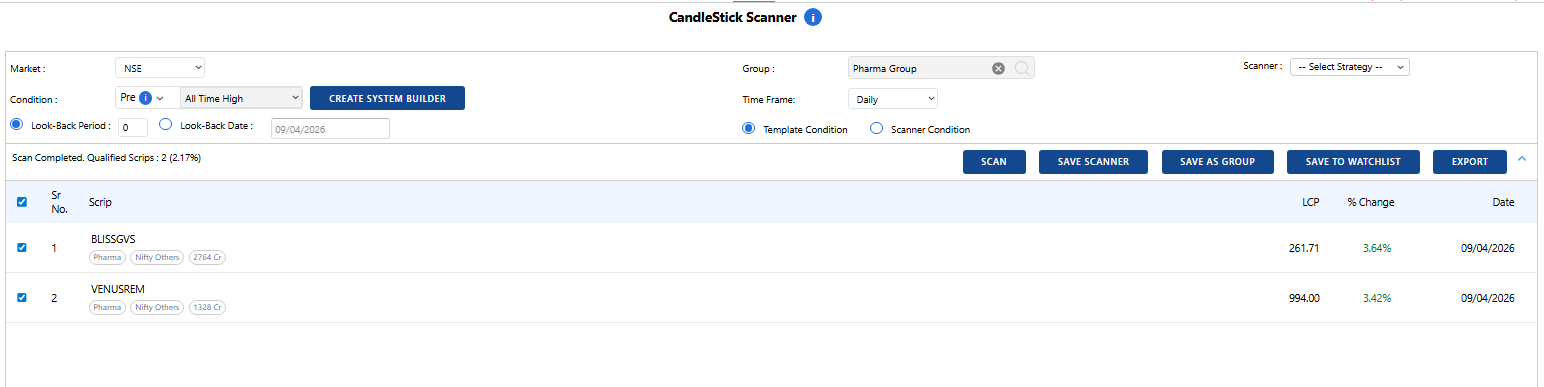
Finding the stocks which have shown good performance during this time using RSI in weekly time frame could help us find the potential stocks with good strength. To validate this, we can use the Indicator Digger in RZone with a weekly setup, focusing on RSI, specifically looking for stocks where the RSI is above 50 along with a rising RSI, and also where it is crossing above its moving average. This helps in identifying strength and improving momentum on the upside.
To avoid potential fakeouts, we can only consider stocks with RSI values higher than 55, ensuring that the momentum is more decisive and not just marginally bullish.
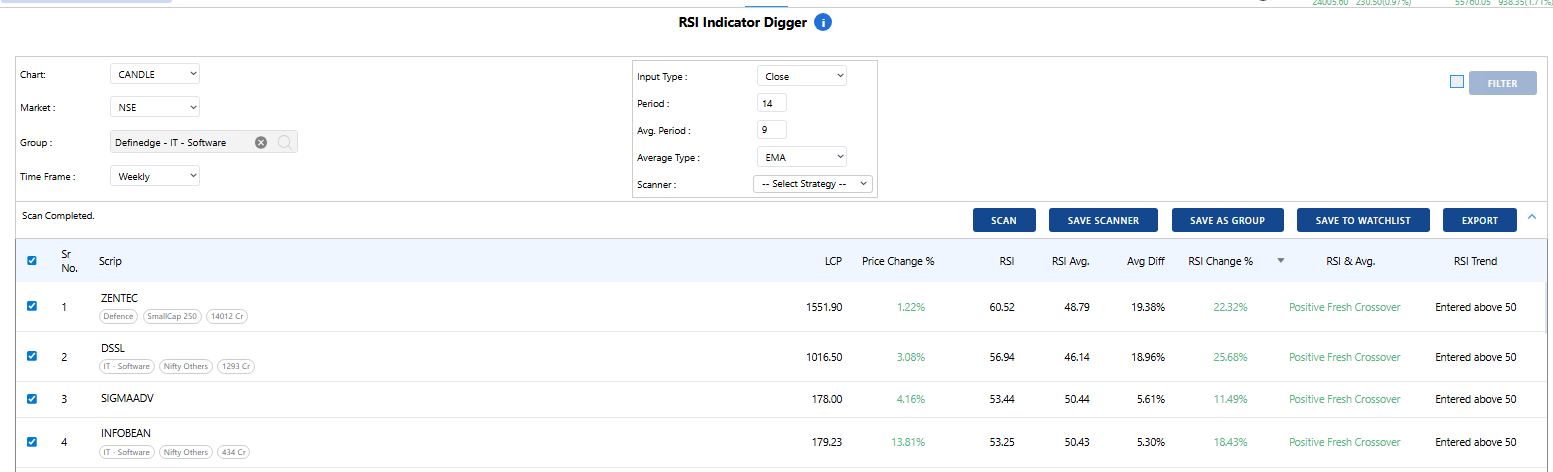
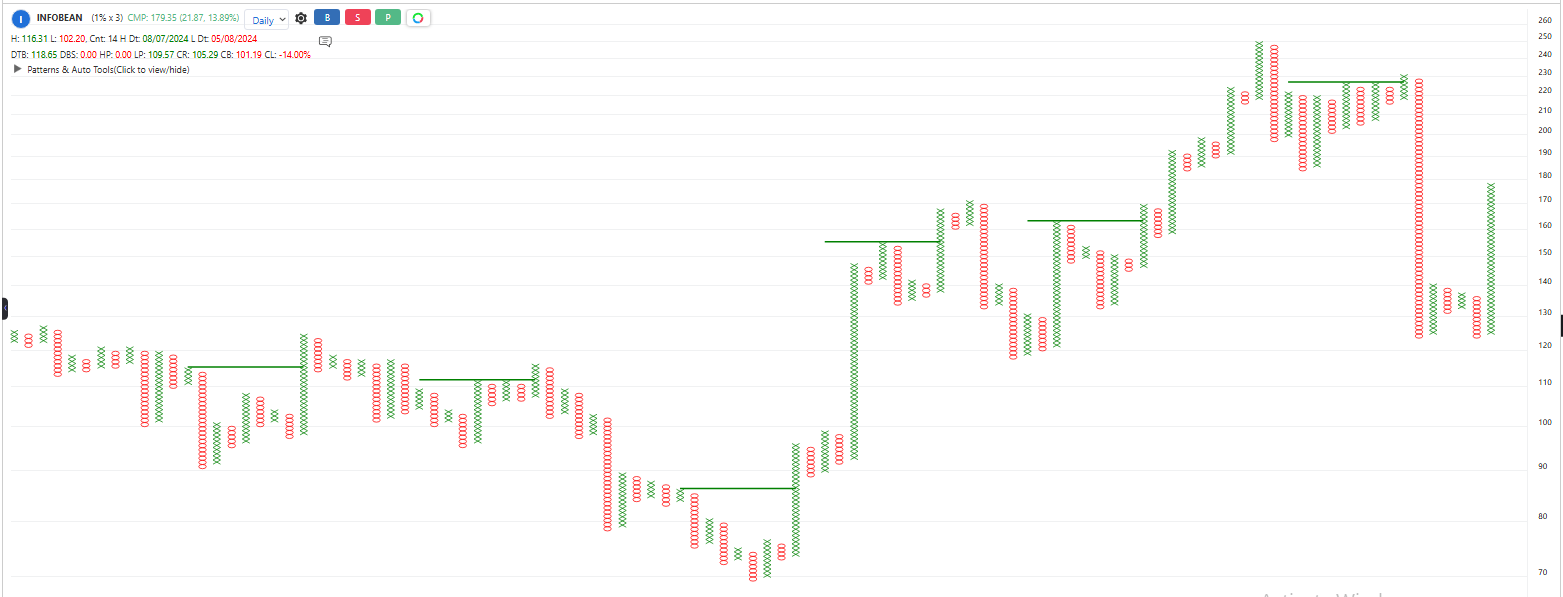
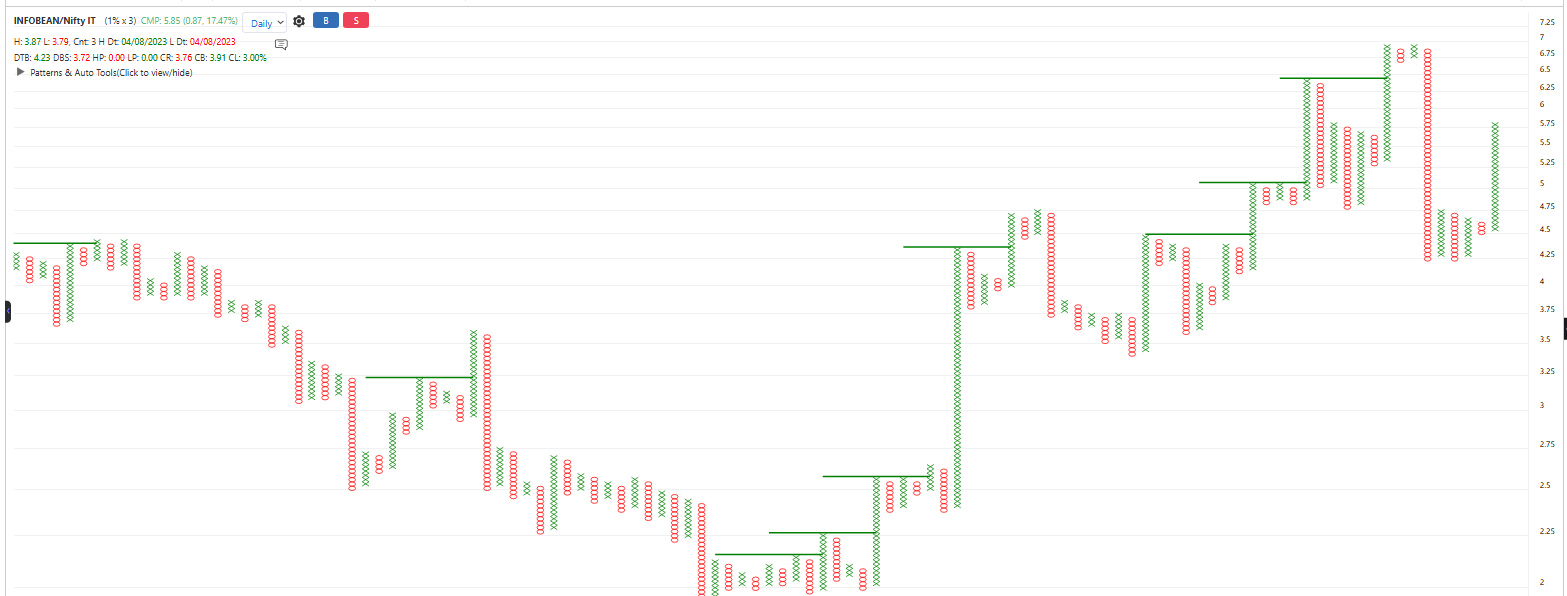
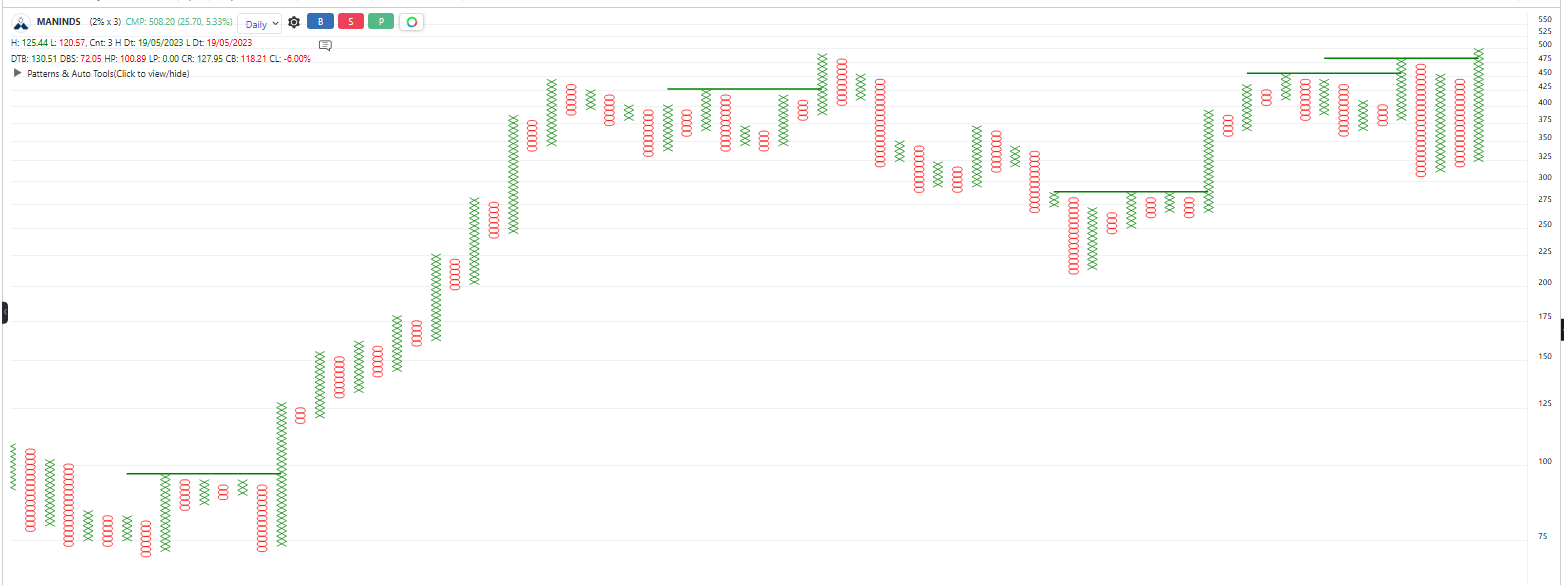
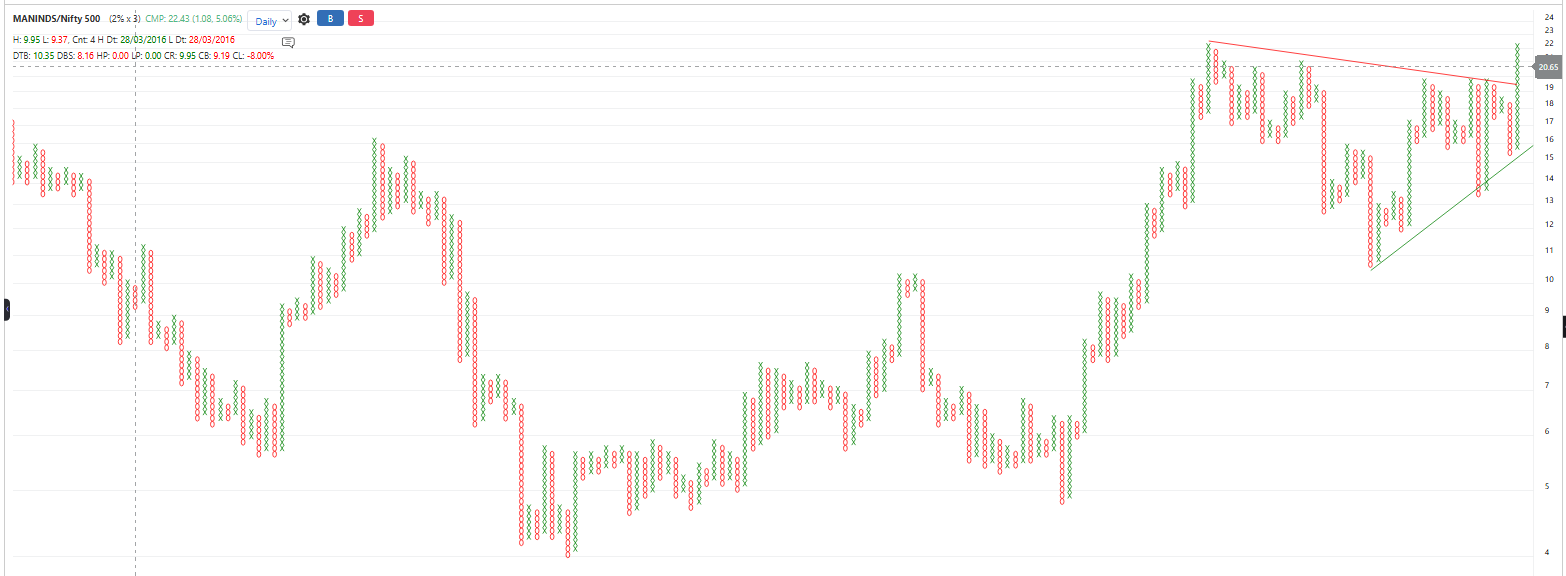
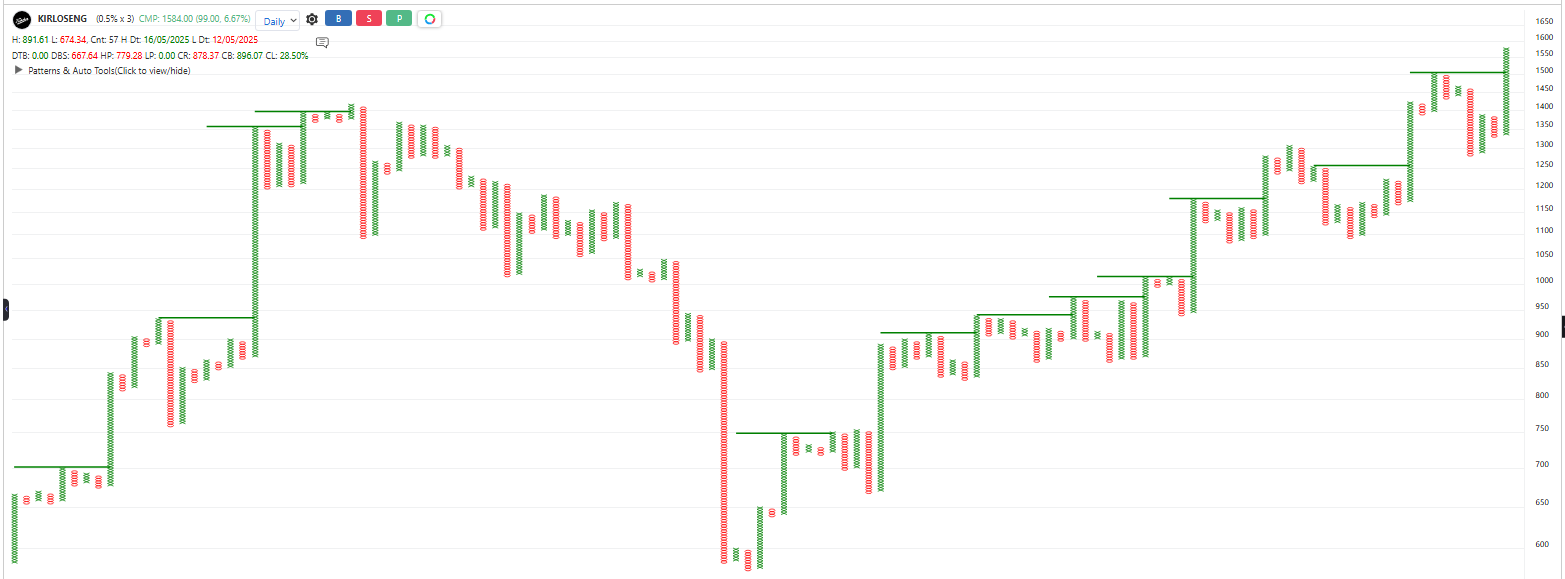
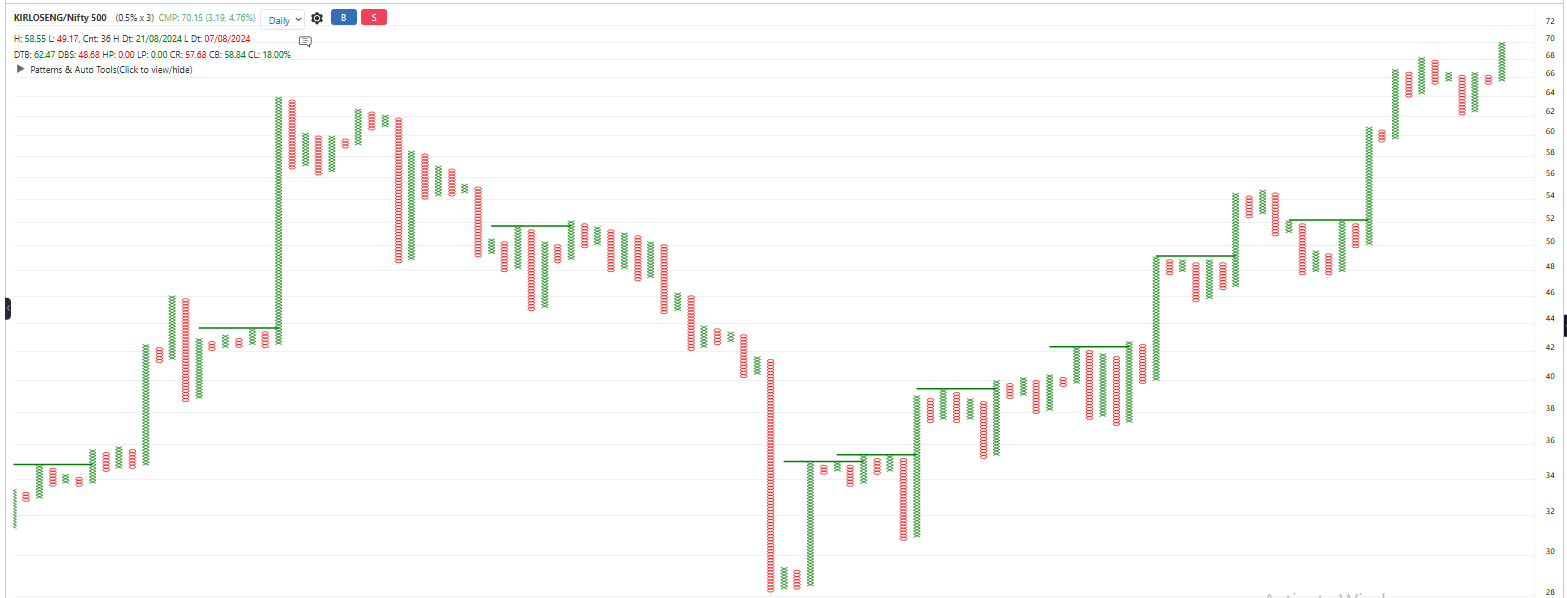
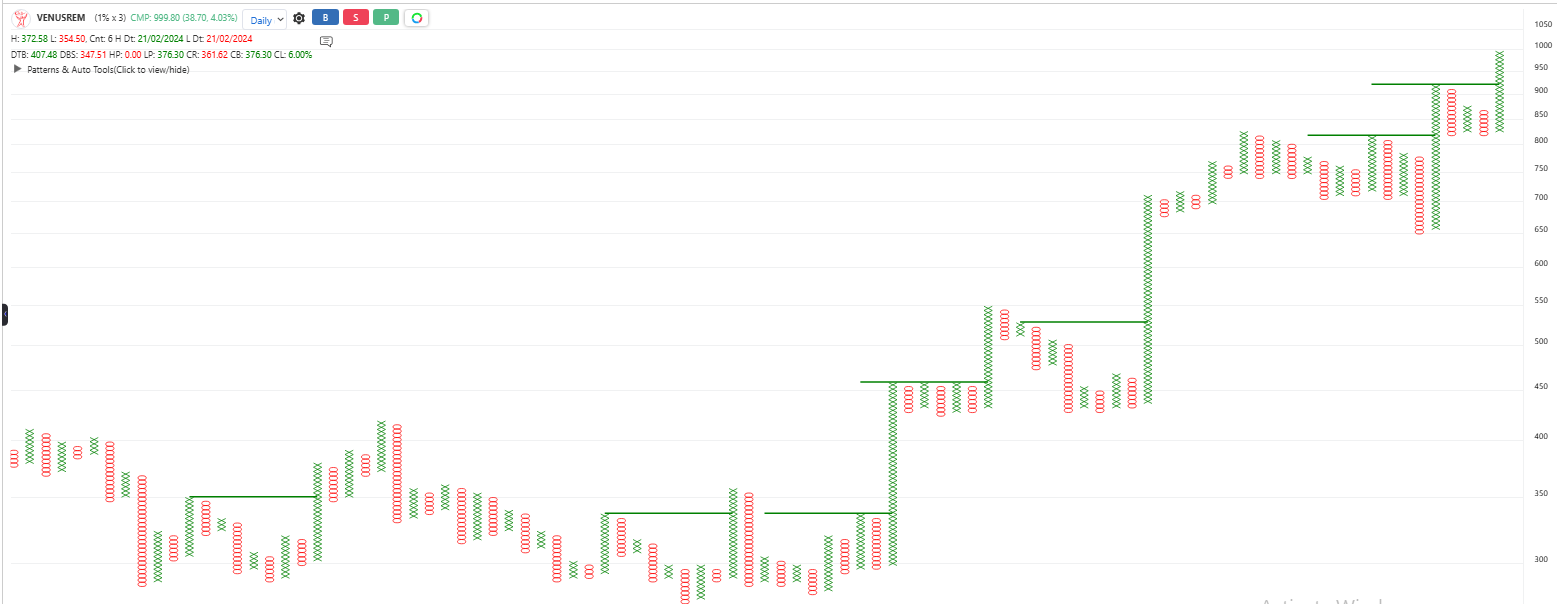
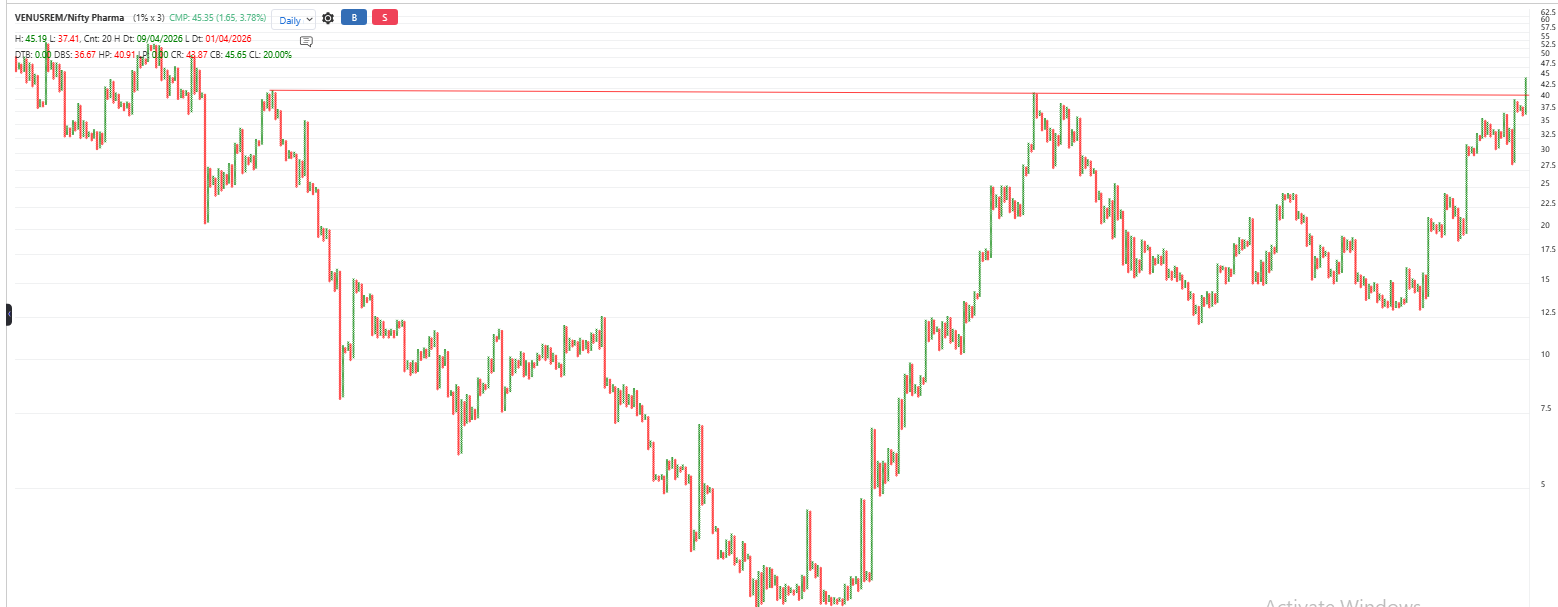
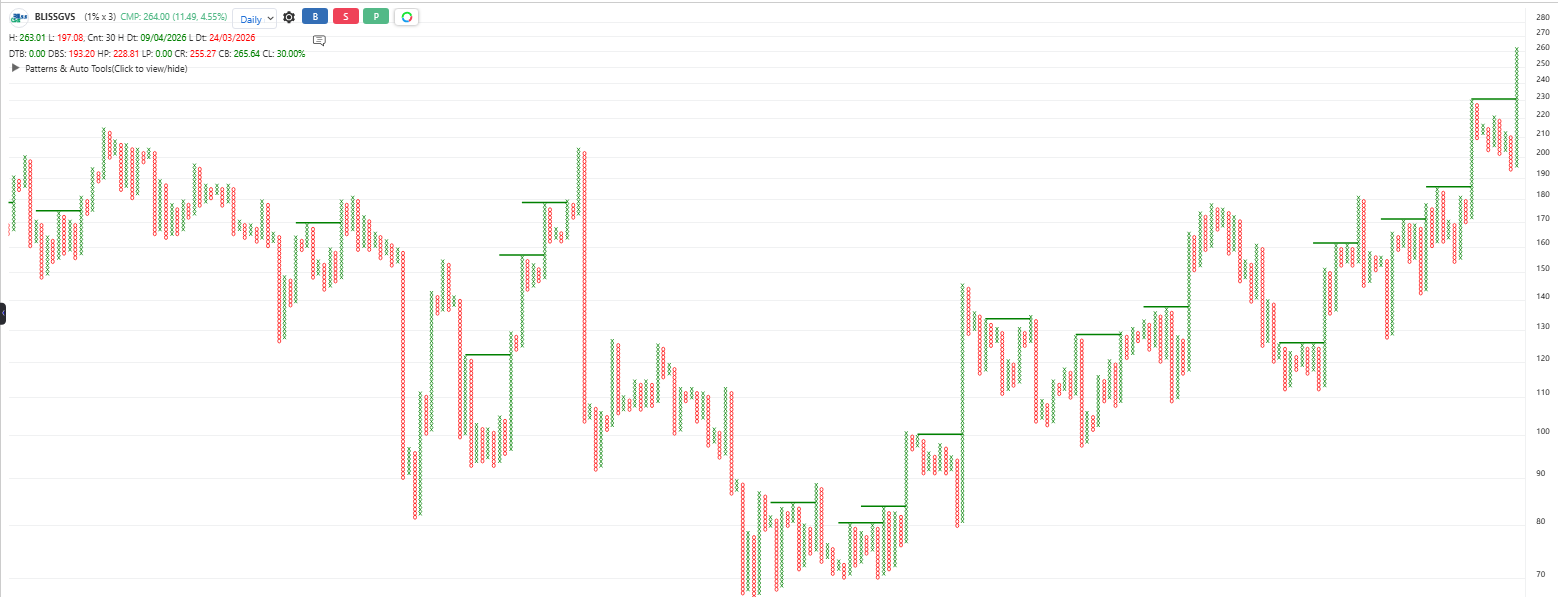
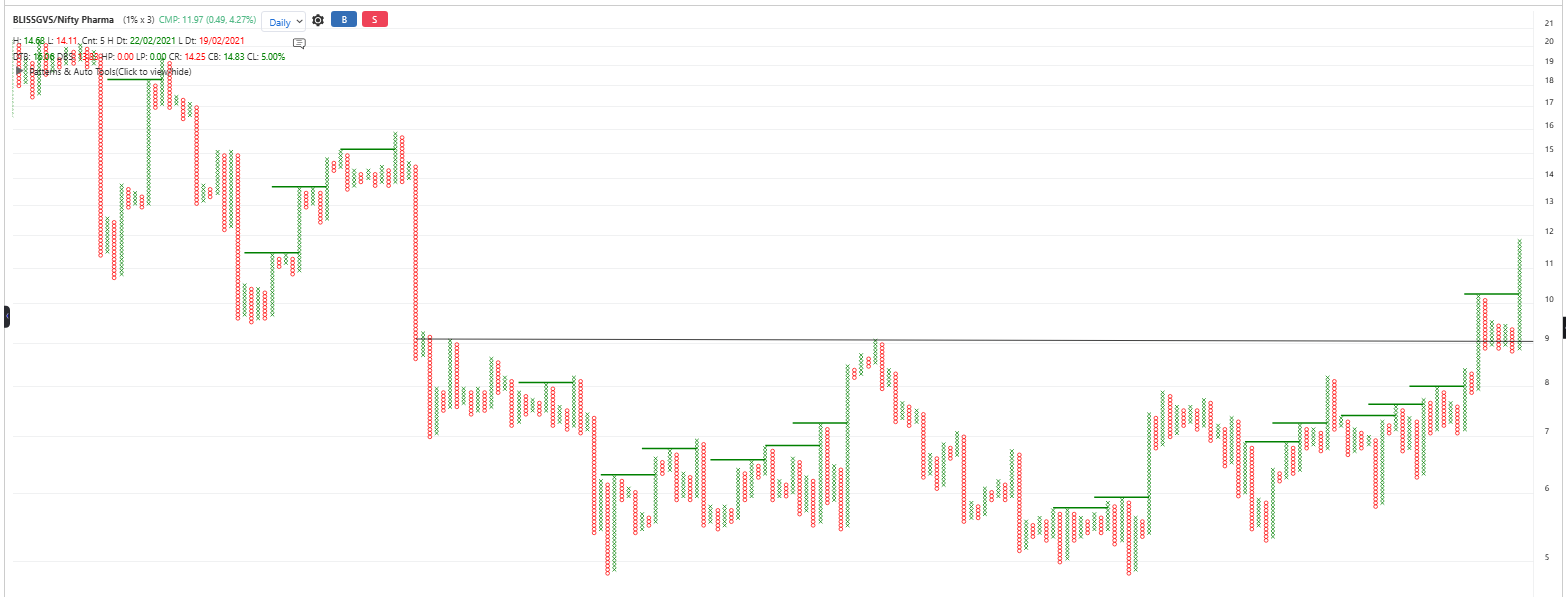
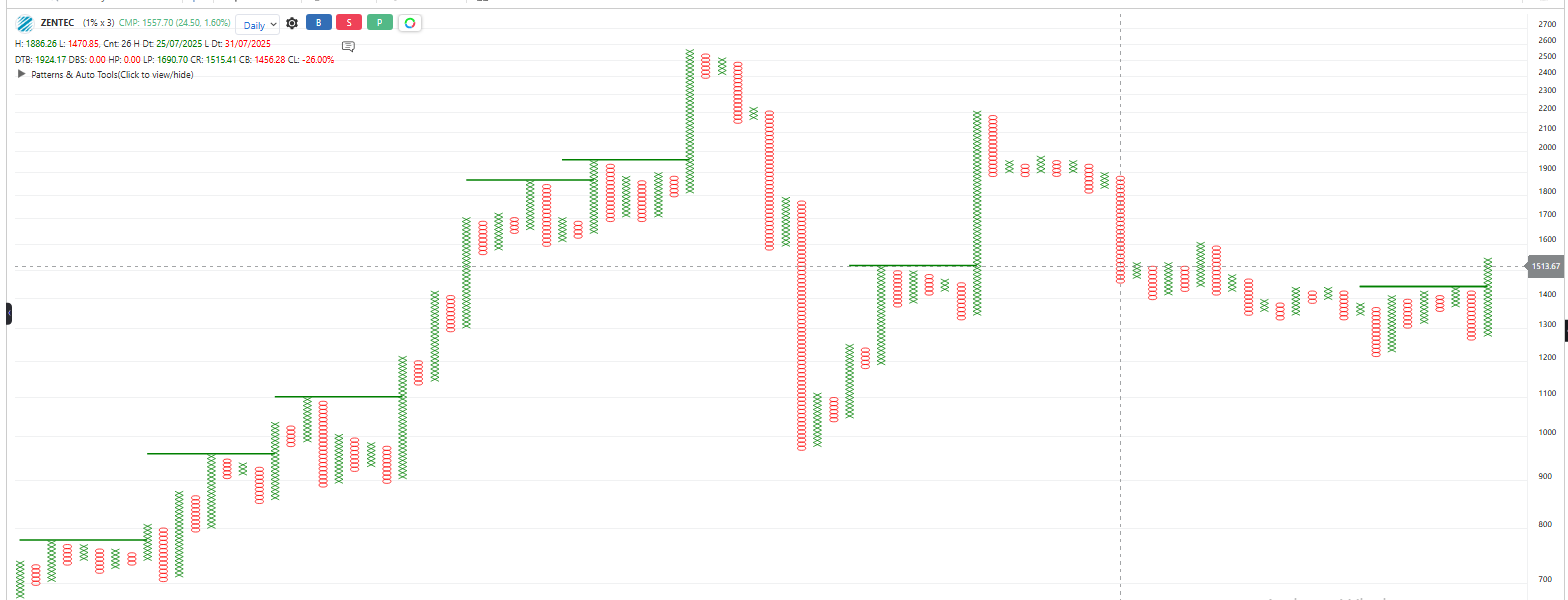
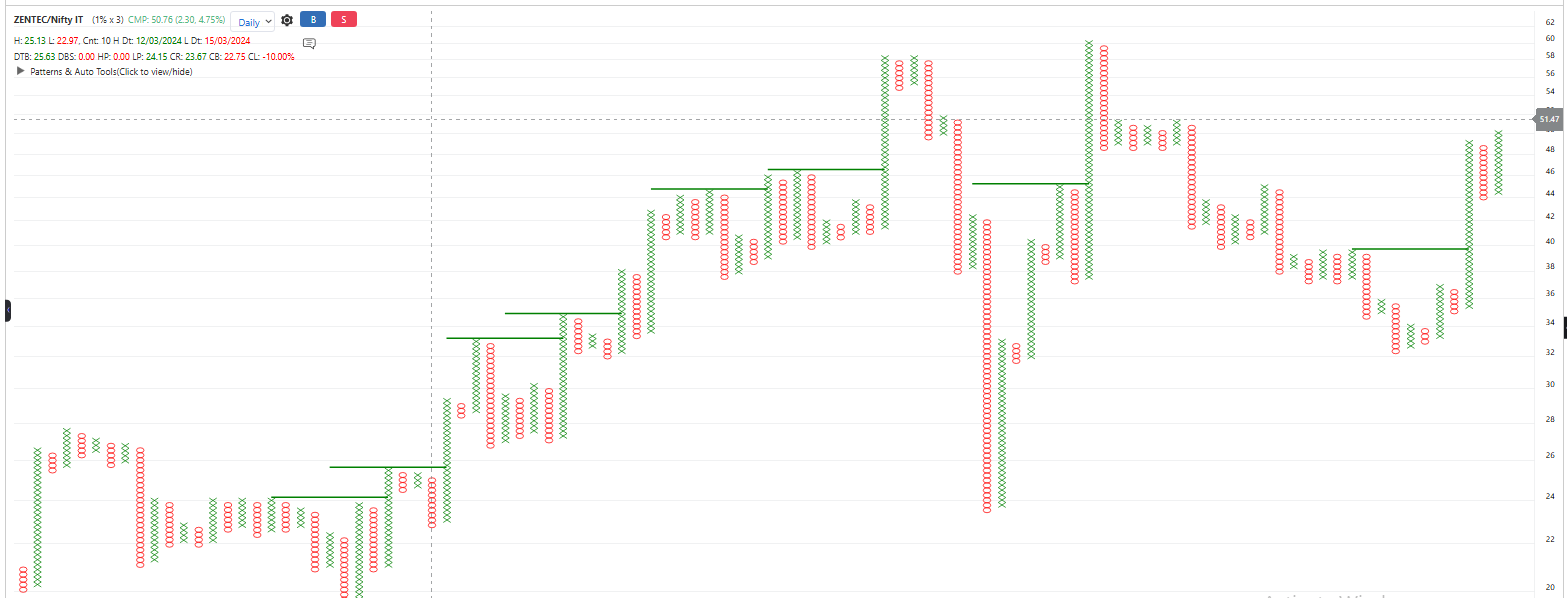
Here are the first four stocks in this list with their price charts and Relative Strength Ratio Chart.
ZENTEC
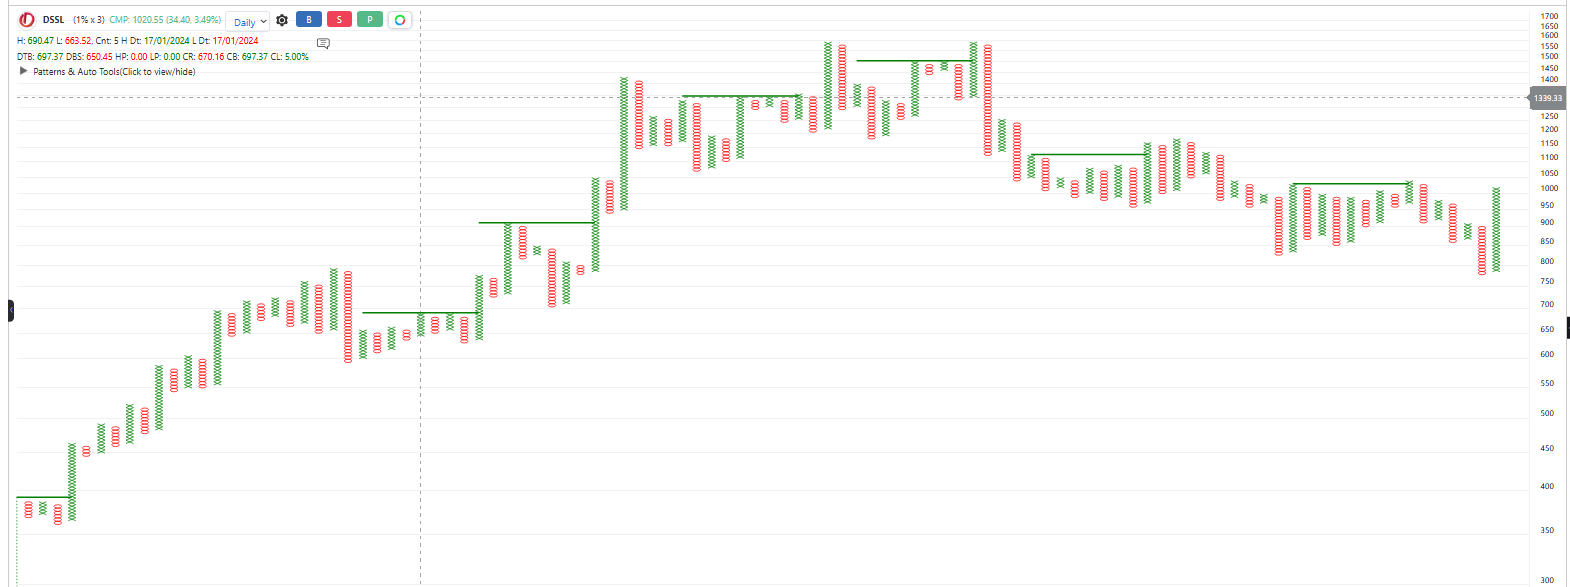
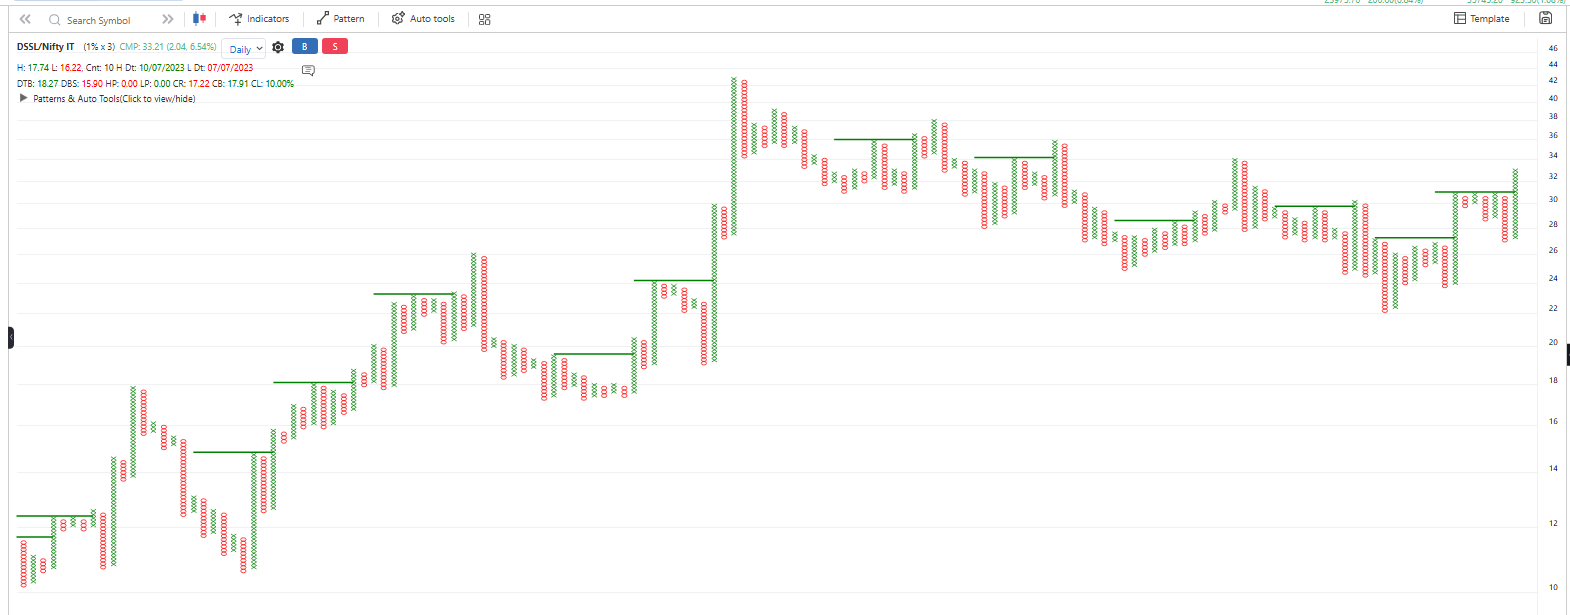
DSSL
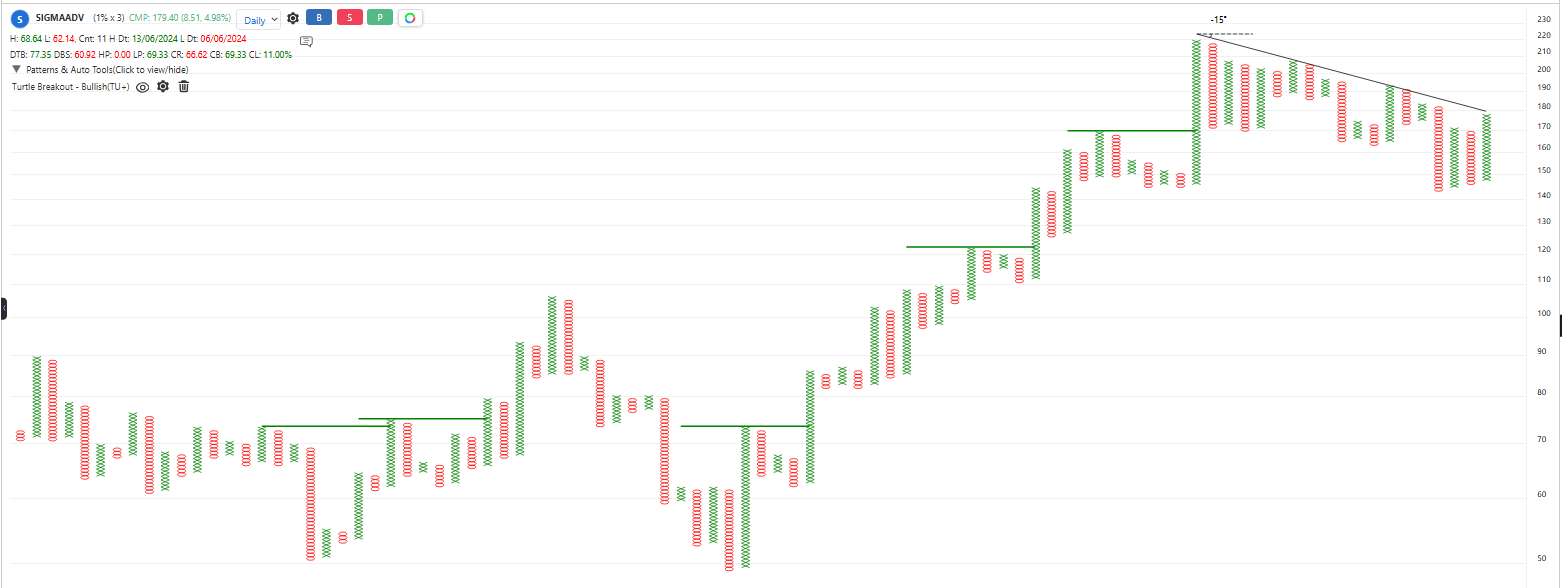
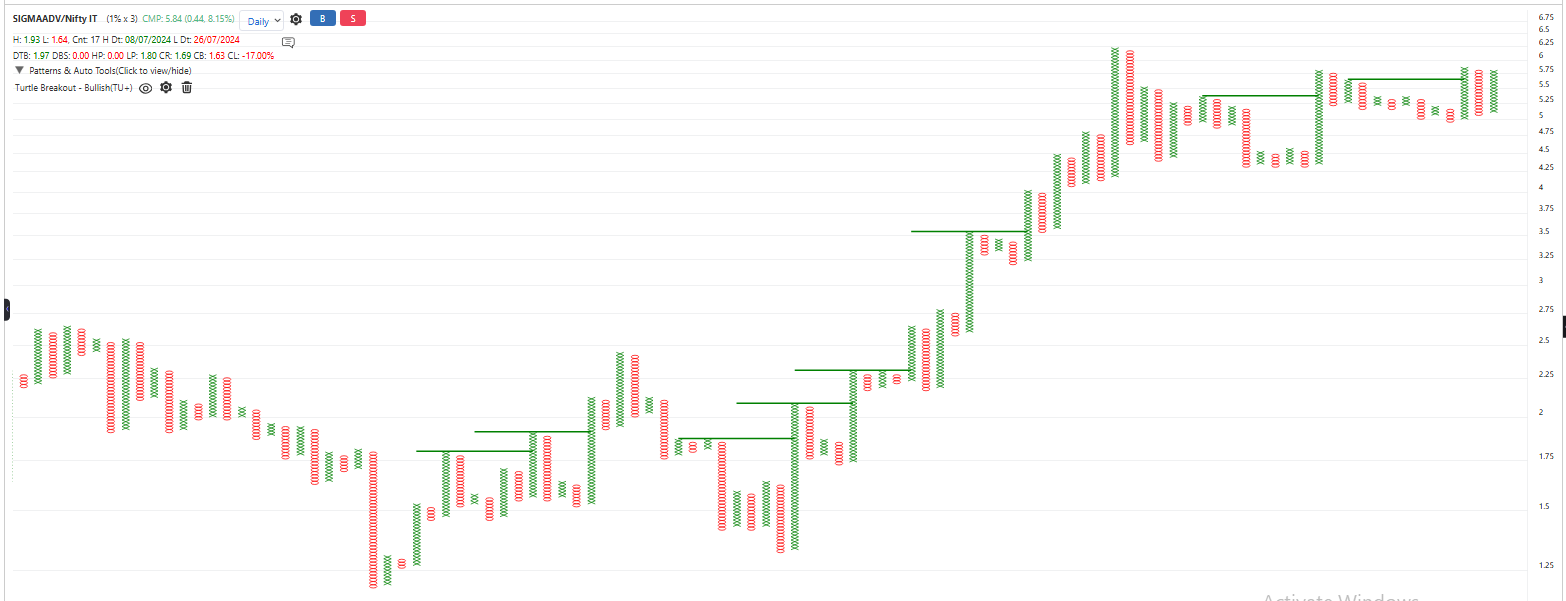
SIGMAADV
INFOBEANS