Updates:
-
March 2026 onwards, I changed the capital per lot from 3.5 lacs to 3.3 lacs. The system's performance and my improvement in execution gave me the confidence to increase slight leverage. Actual margin required per lot is ~2.2 lacs, so this is still a good buffer.
-
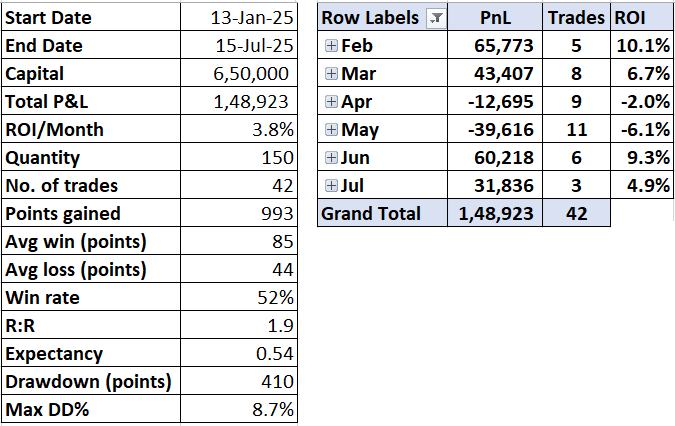
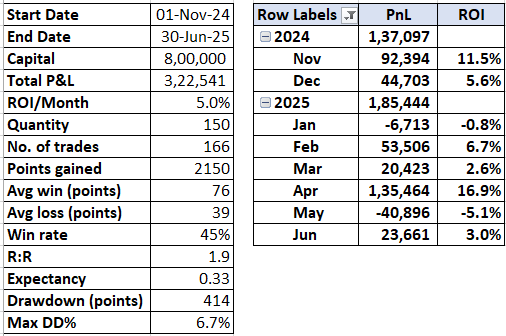
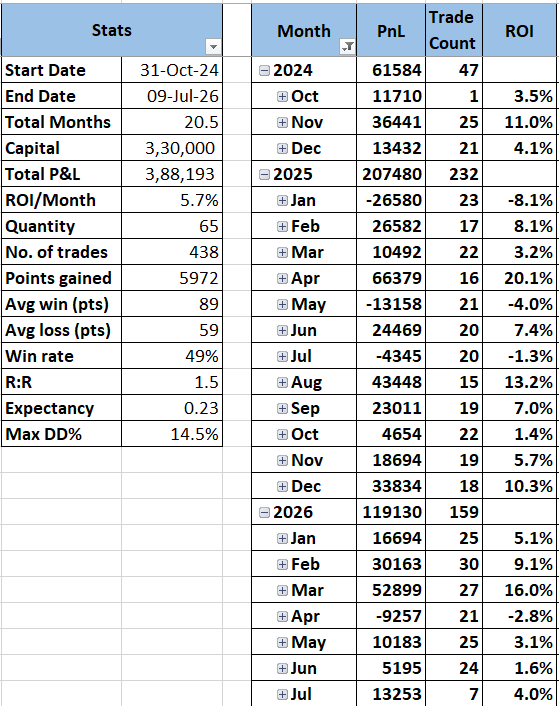
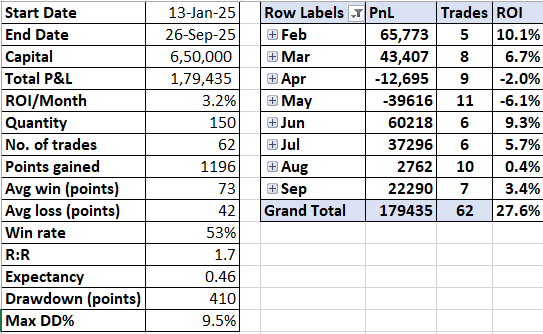
The last 3 months' performance (Apr-Jun) looks average, nothing major. However, the numbers don't tell the real story. System has been in a drawdown since mid-April; no new equity curve high. Time DD hurts a lot more than one can ever imagine and the current period has been one of longest since I started. Test of patience.
Some thoughts on DD:
One week in May and another in June saw DD touching 7%. Interestingly, if someone started trading this system fresh in April 2026, he would already have seen max DD of ~14%! In system trading, this phenomenon is widely known as start-date bias, curve dependency, or sequence of returns risk. The timing of when capital is deployed fundamentally shifts the percentage returns and trajectory of the equity curve. Not to mention the difference in psychological impact on two traders using the exact same strategy but starting at different times. The math is something like this:
Trader A (starts into DD): If a trader starts with 10 lacs and immediately hits a 50% drawdown, his capital shrinks to 5 lacs. To simply break even and return to 10 lacs, he now requires a 100% gain on the remaining capital.
Trader B (starts just when system is recovering from DD): If another trader starts with 10 lacs at the absolute bottom of that same drawdown, he skips the 50% loss completely. As the system recovers to its previous peak, he captures that 100% upward move, doubling the account to 20 lacs while Trader A is still sitting at zero net returns.
Alas, if only one could foresee the right time to enter/start a trading system ")
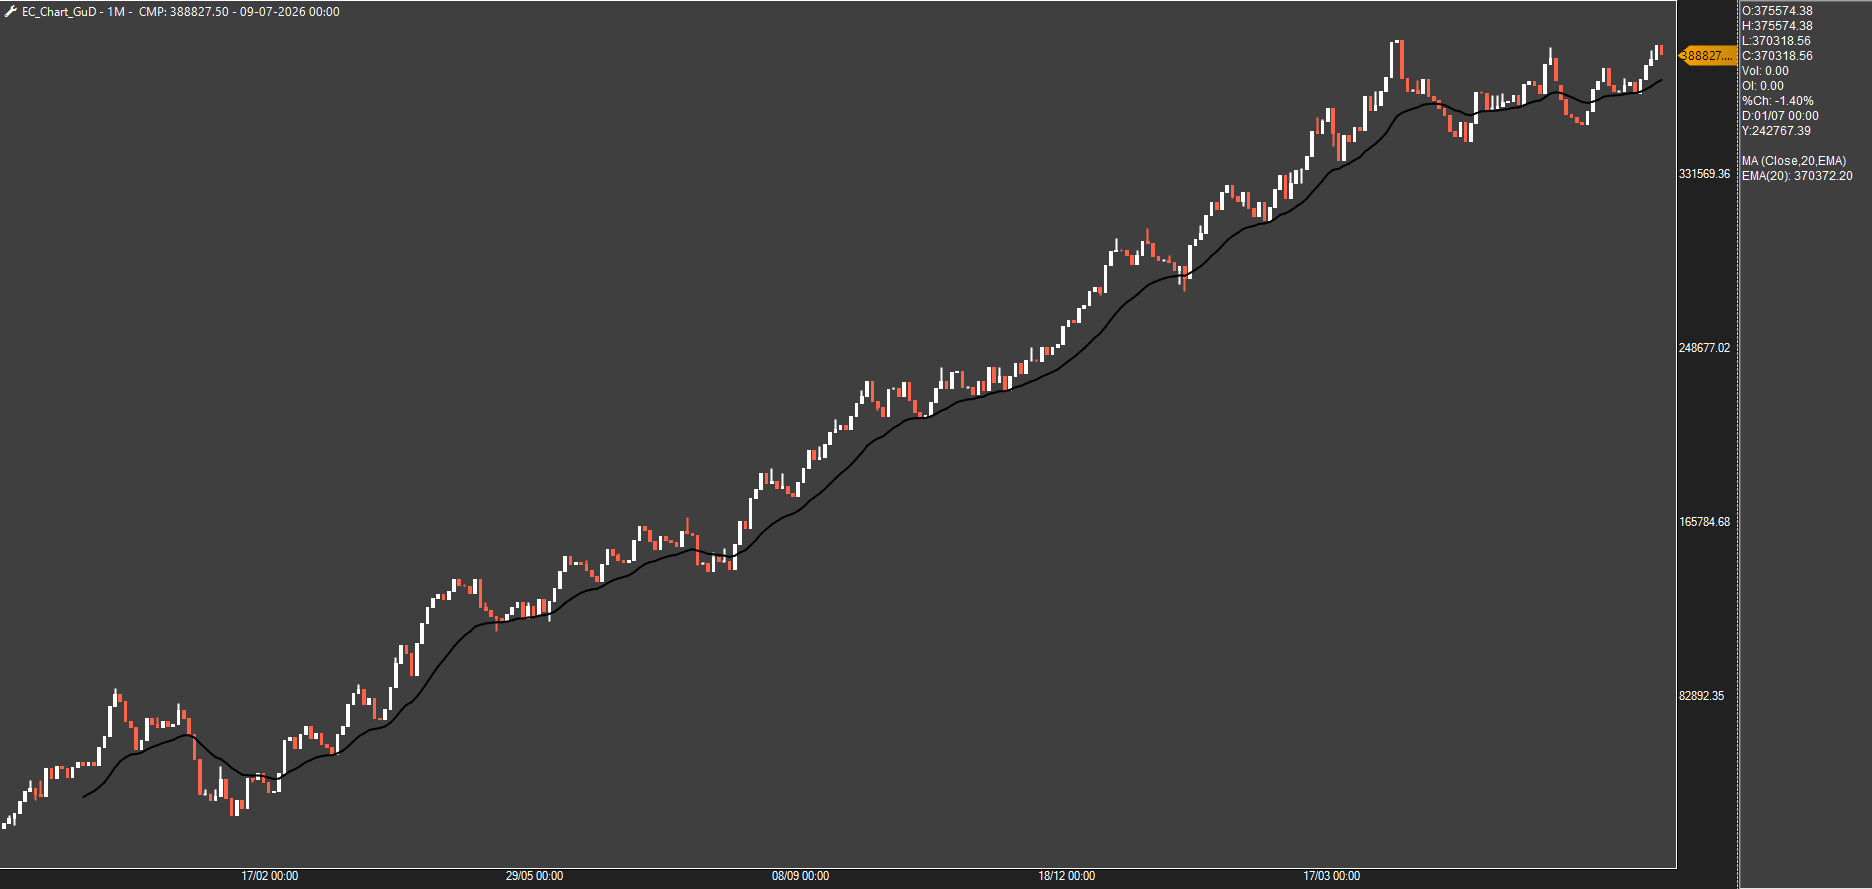
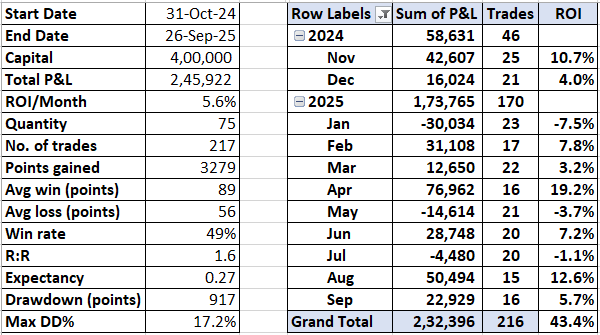
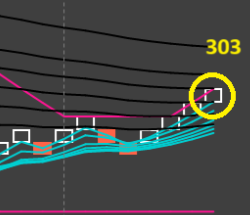
I can't foresee this, but I have started plotting the equity curve chart with a moving average in an attempt to identify areas that could signal possible peaks and troughs. Here's the chart (till date) for this system since Nov '24, currently trying to break out to new highs. I plan to increase my capital deployed to this system and will refer this chart to pick a good time for that.
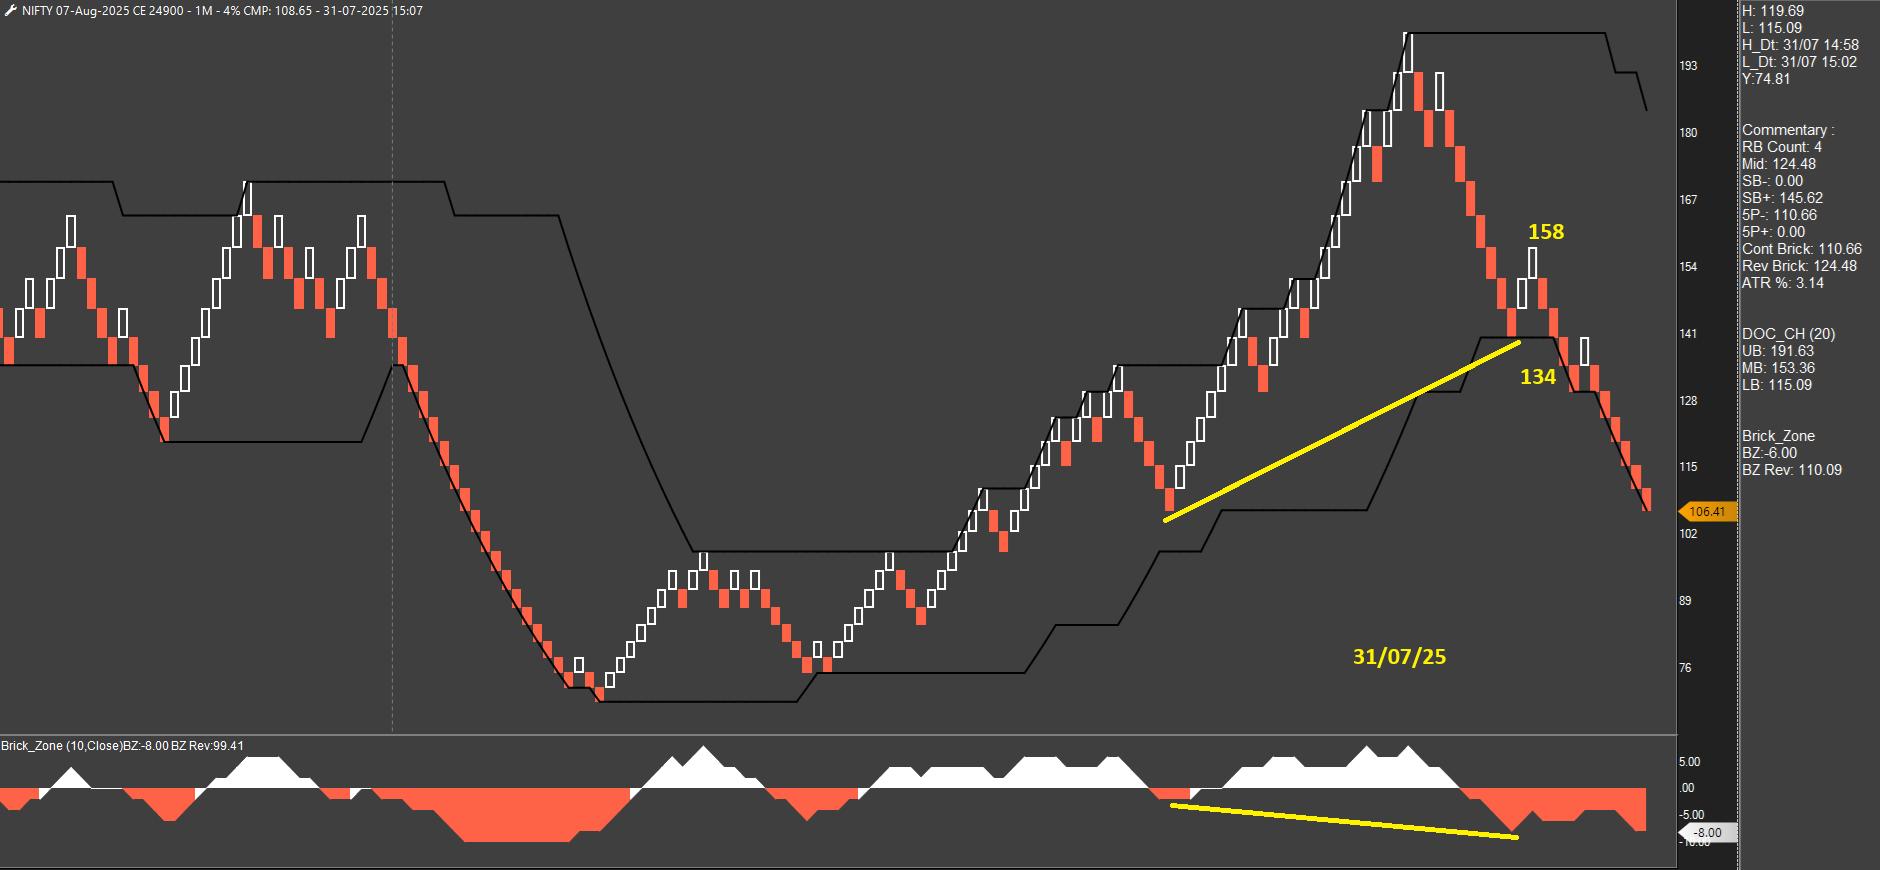
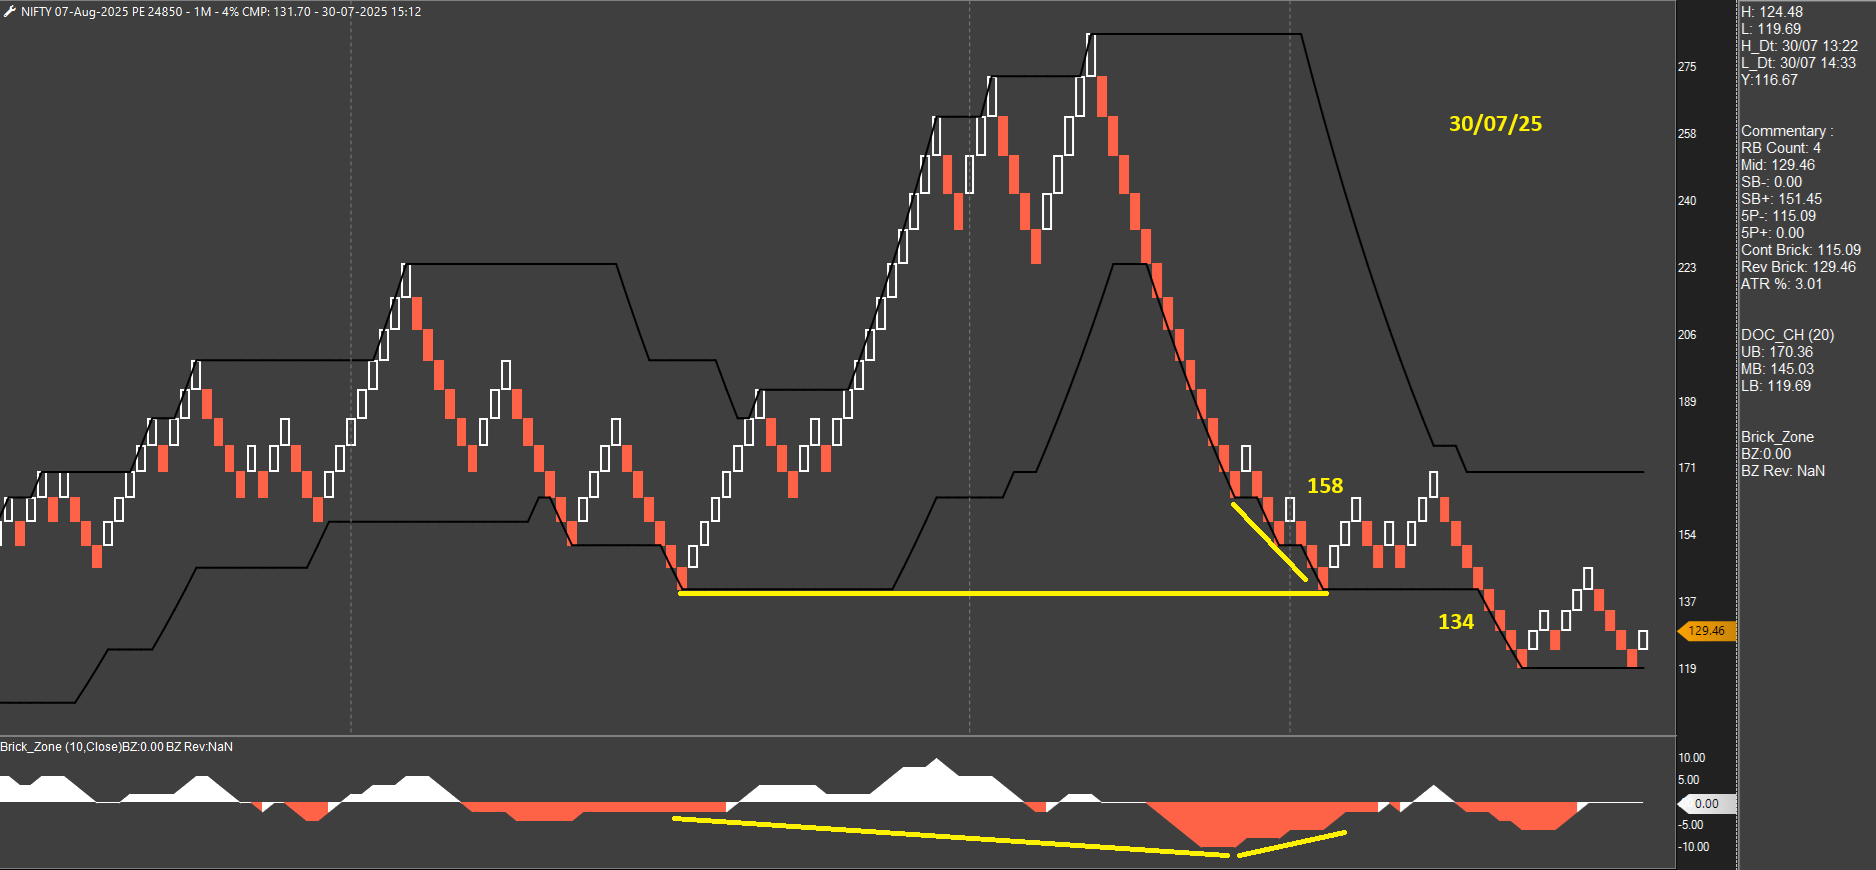
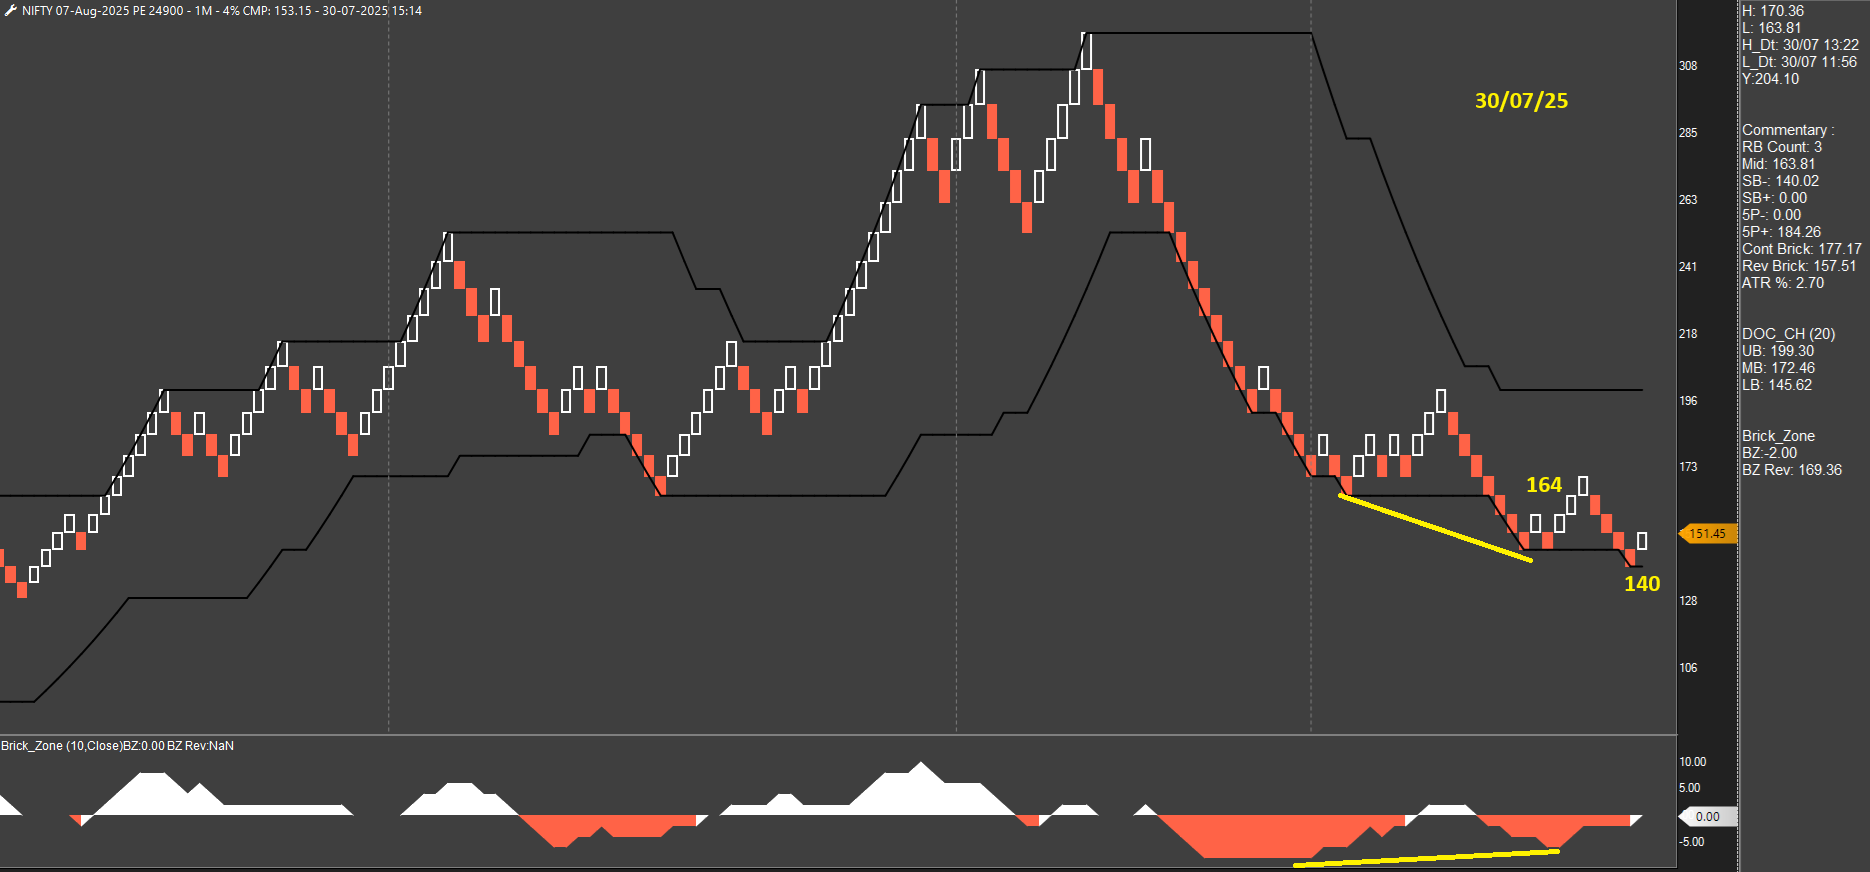
 Final update on this system - all rules, nuances, and my observations after trading for a month.
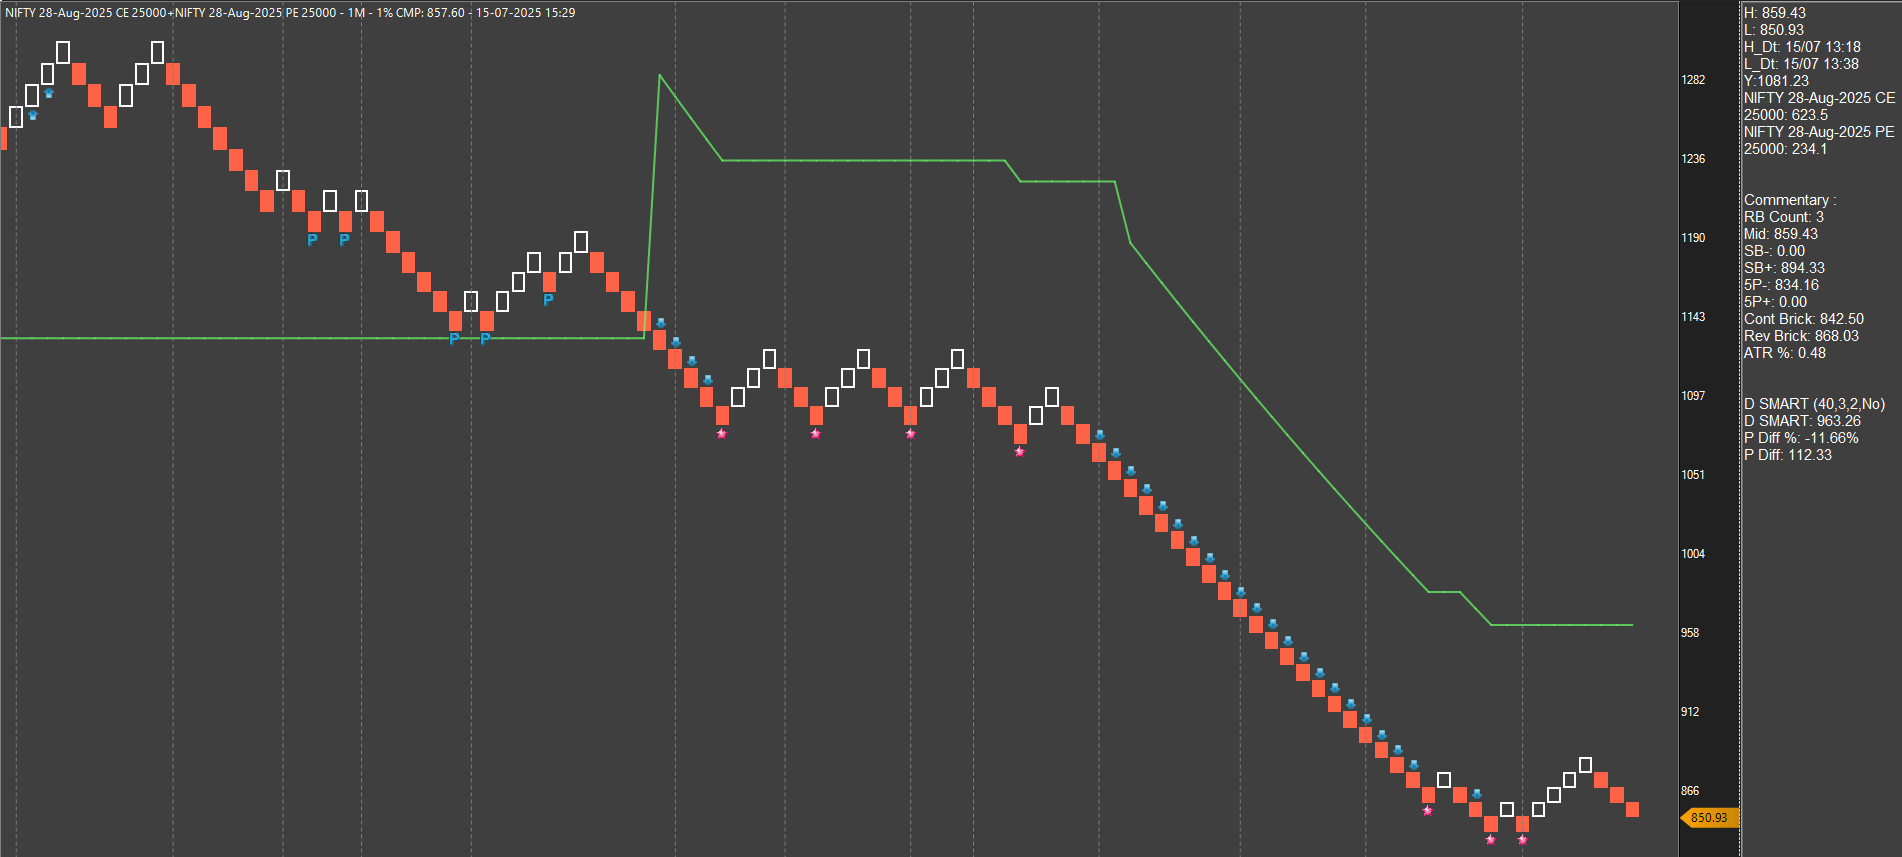
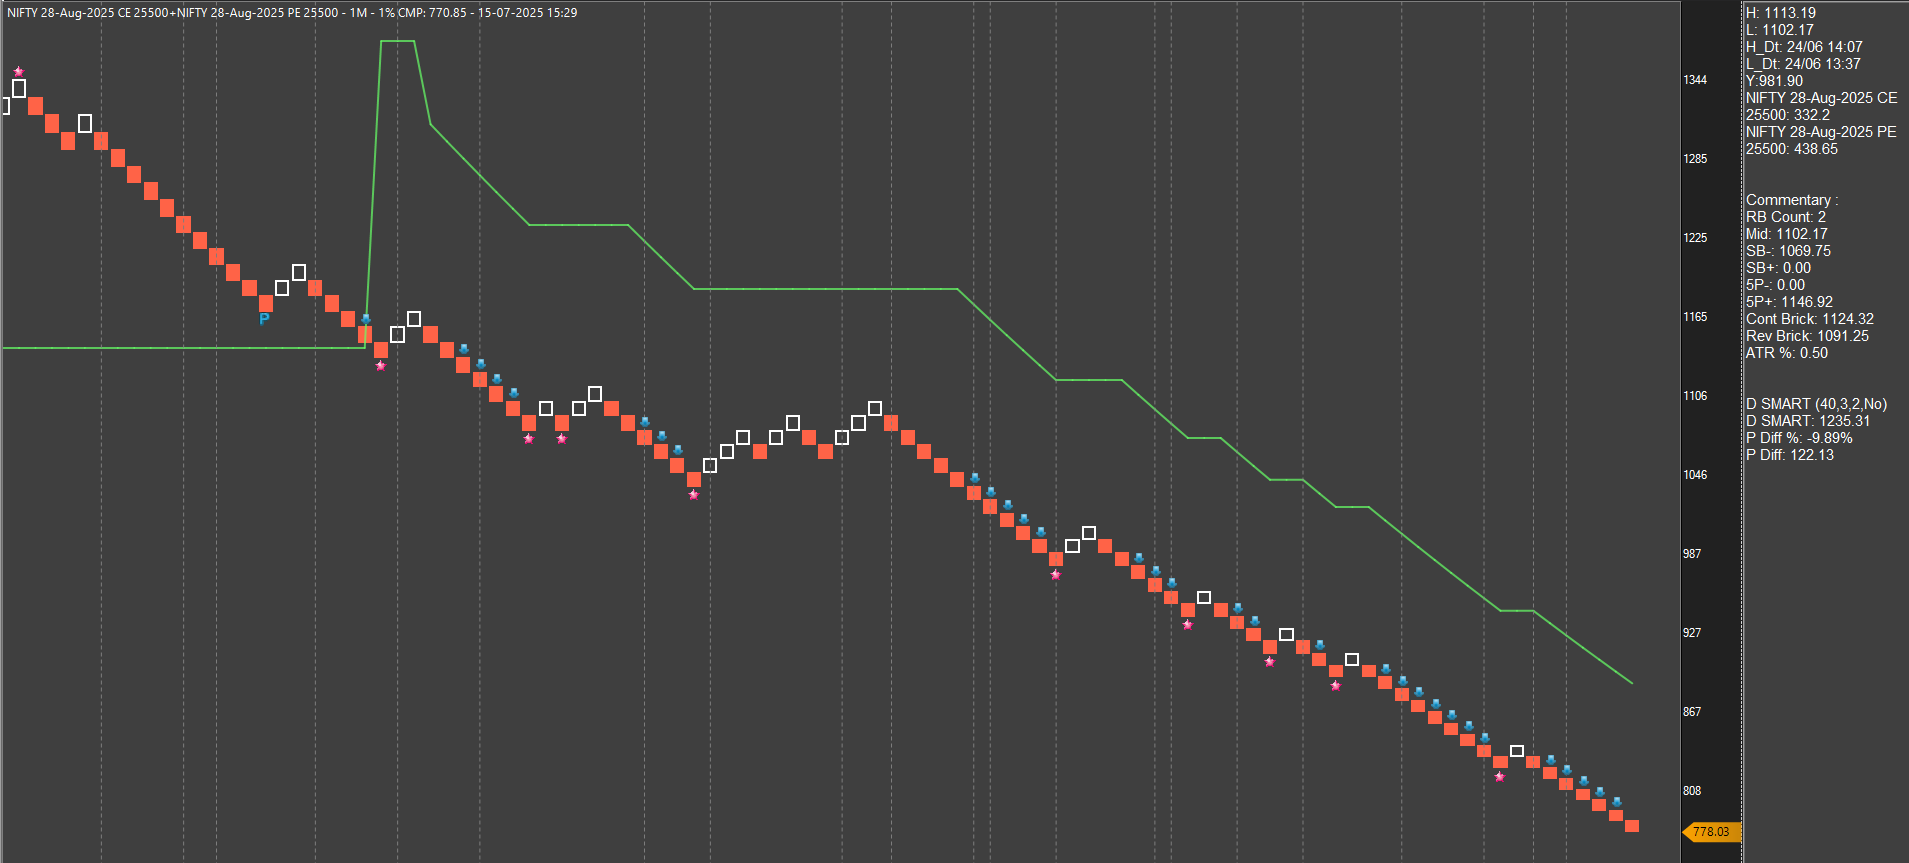
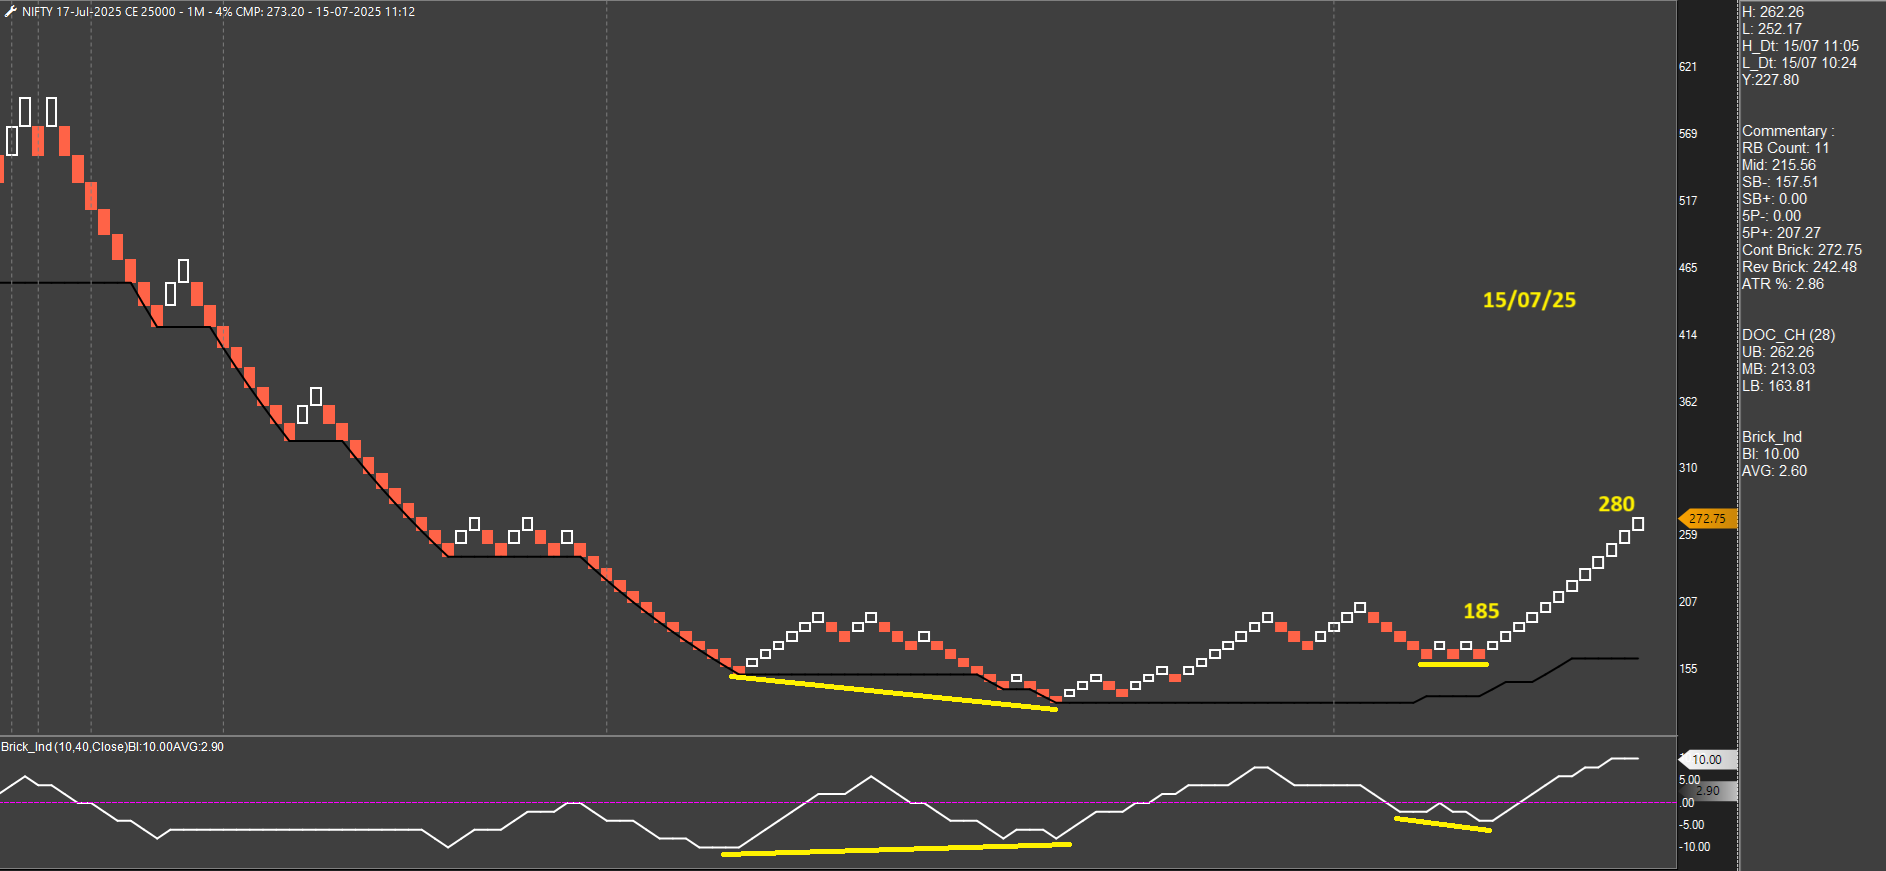
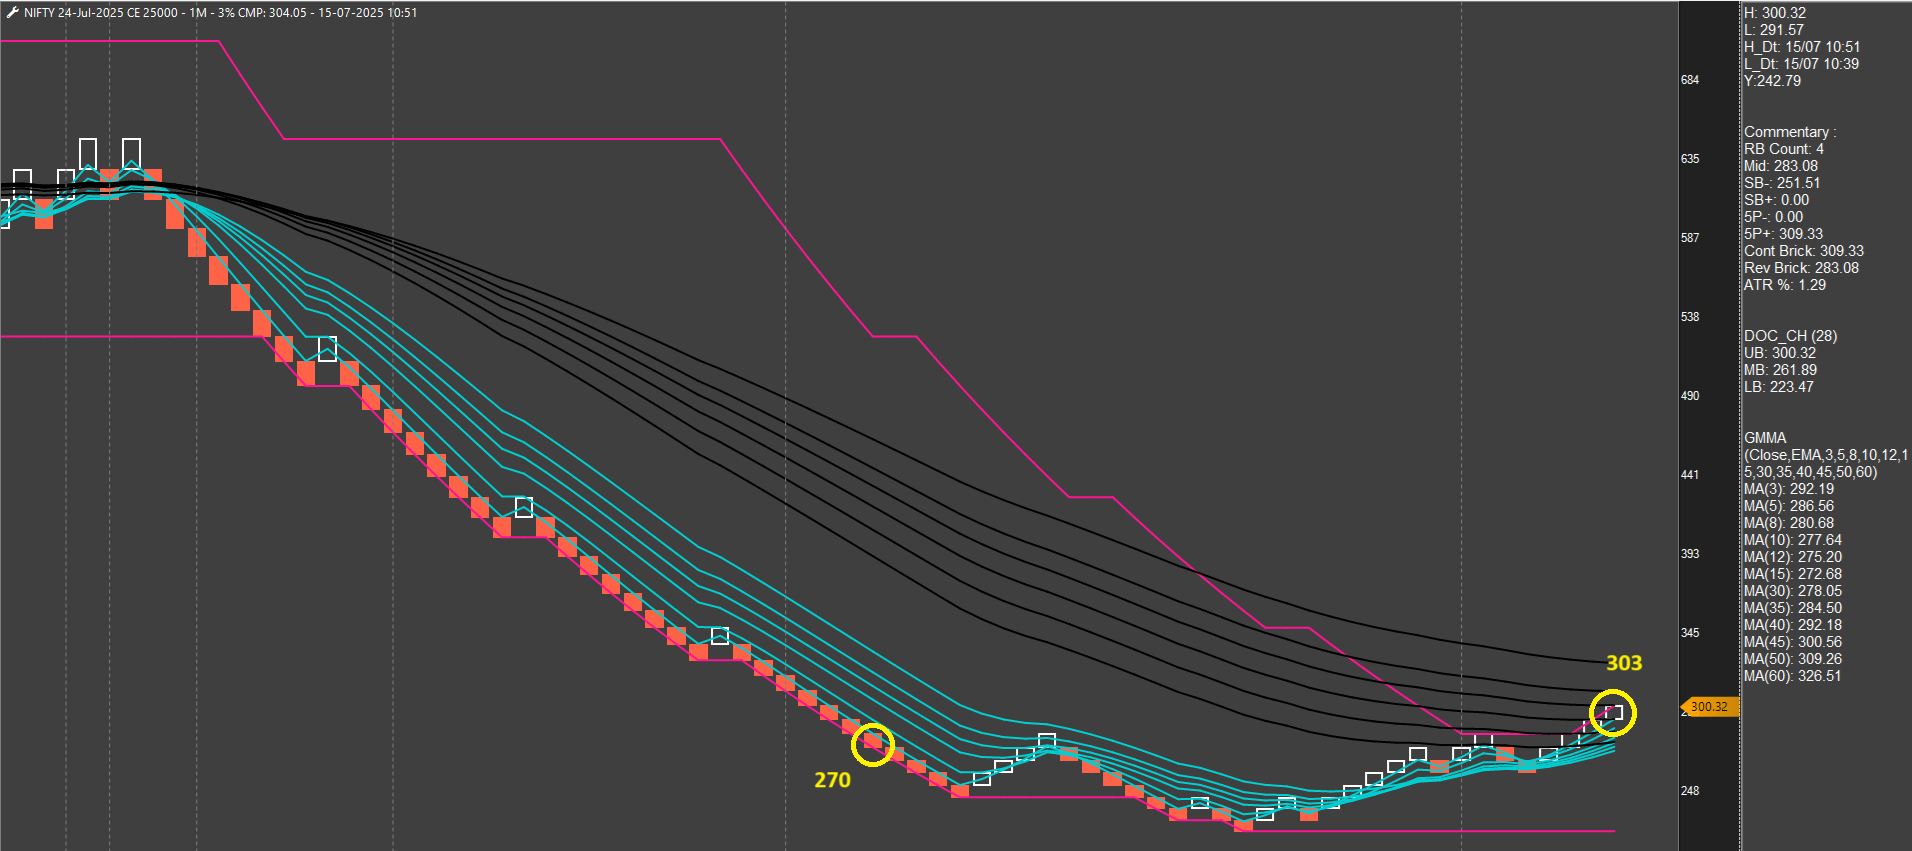
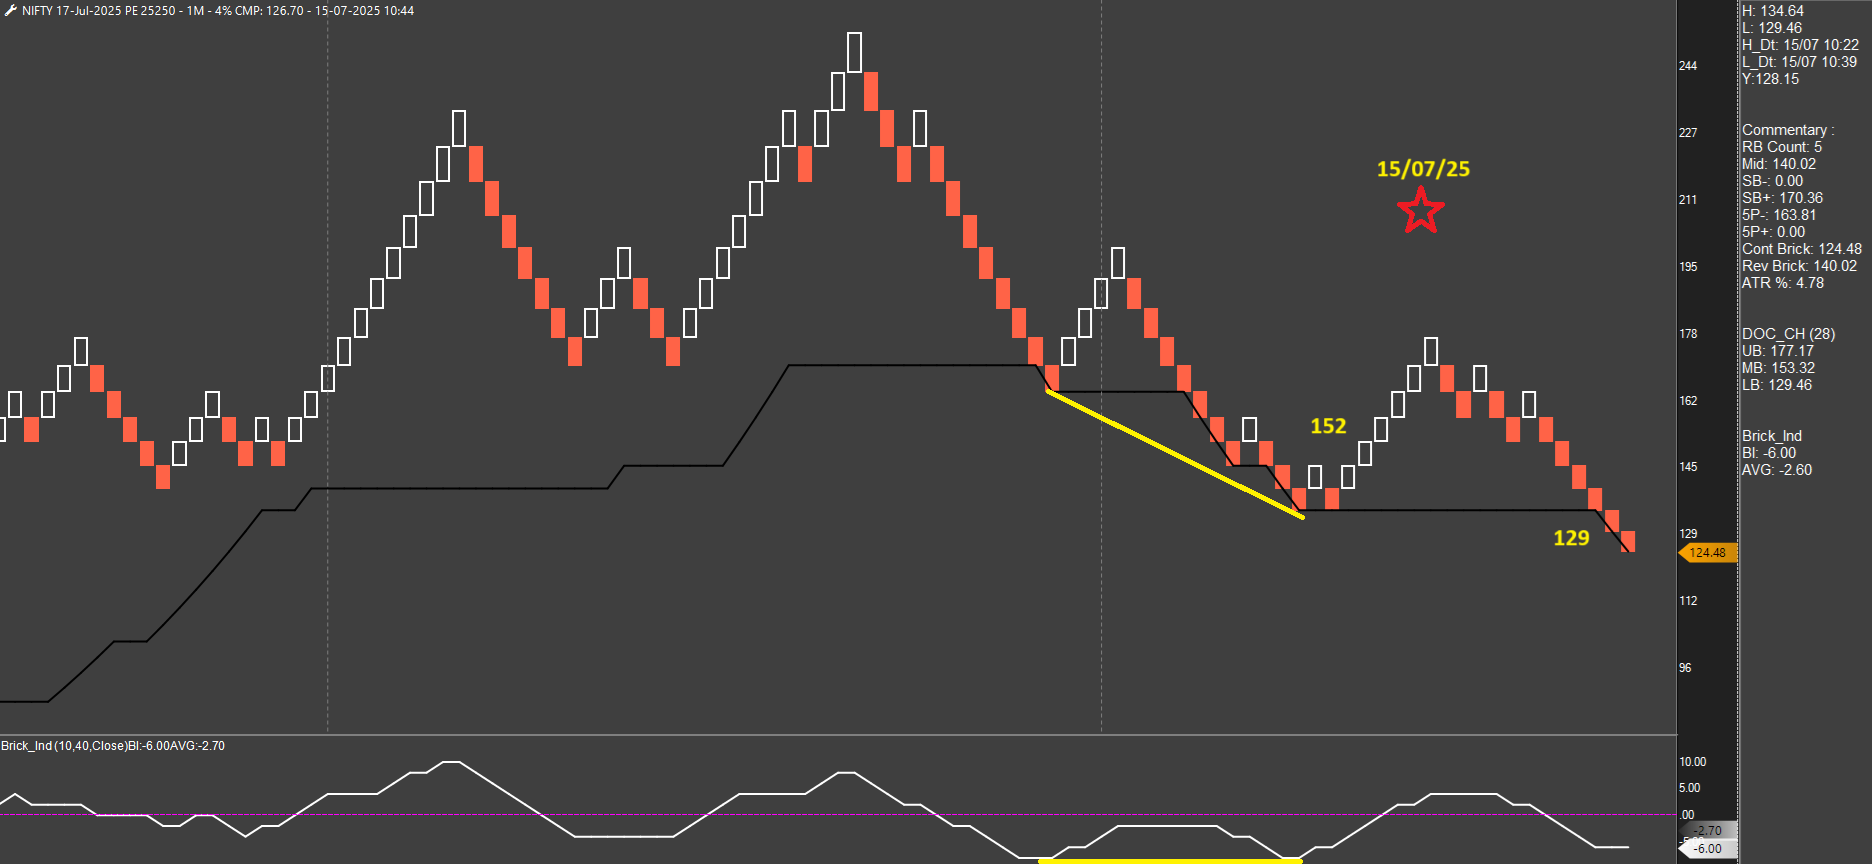
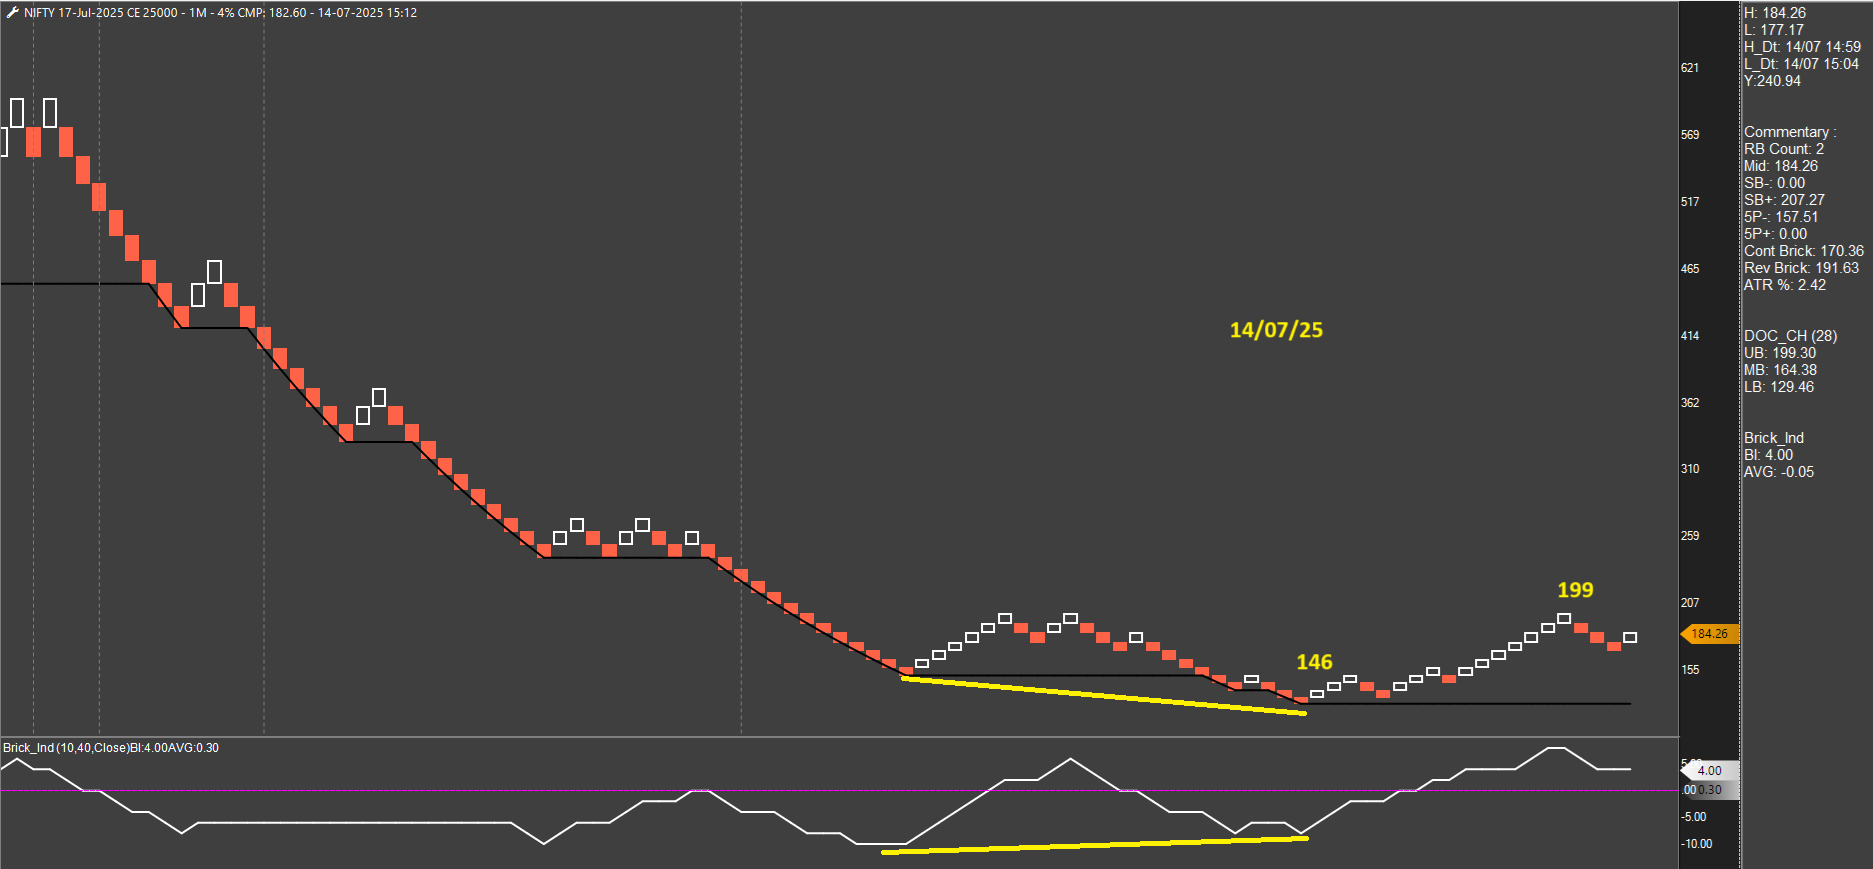
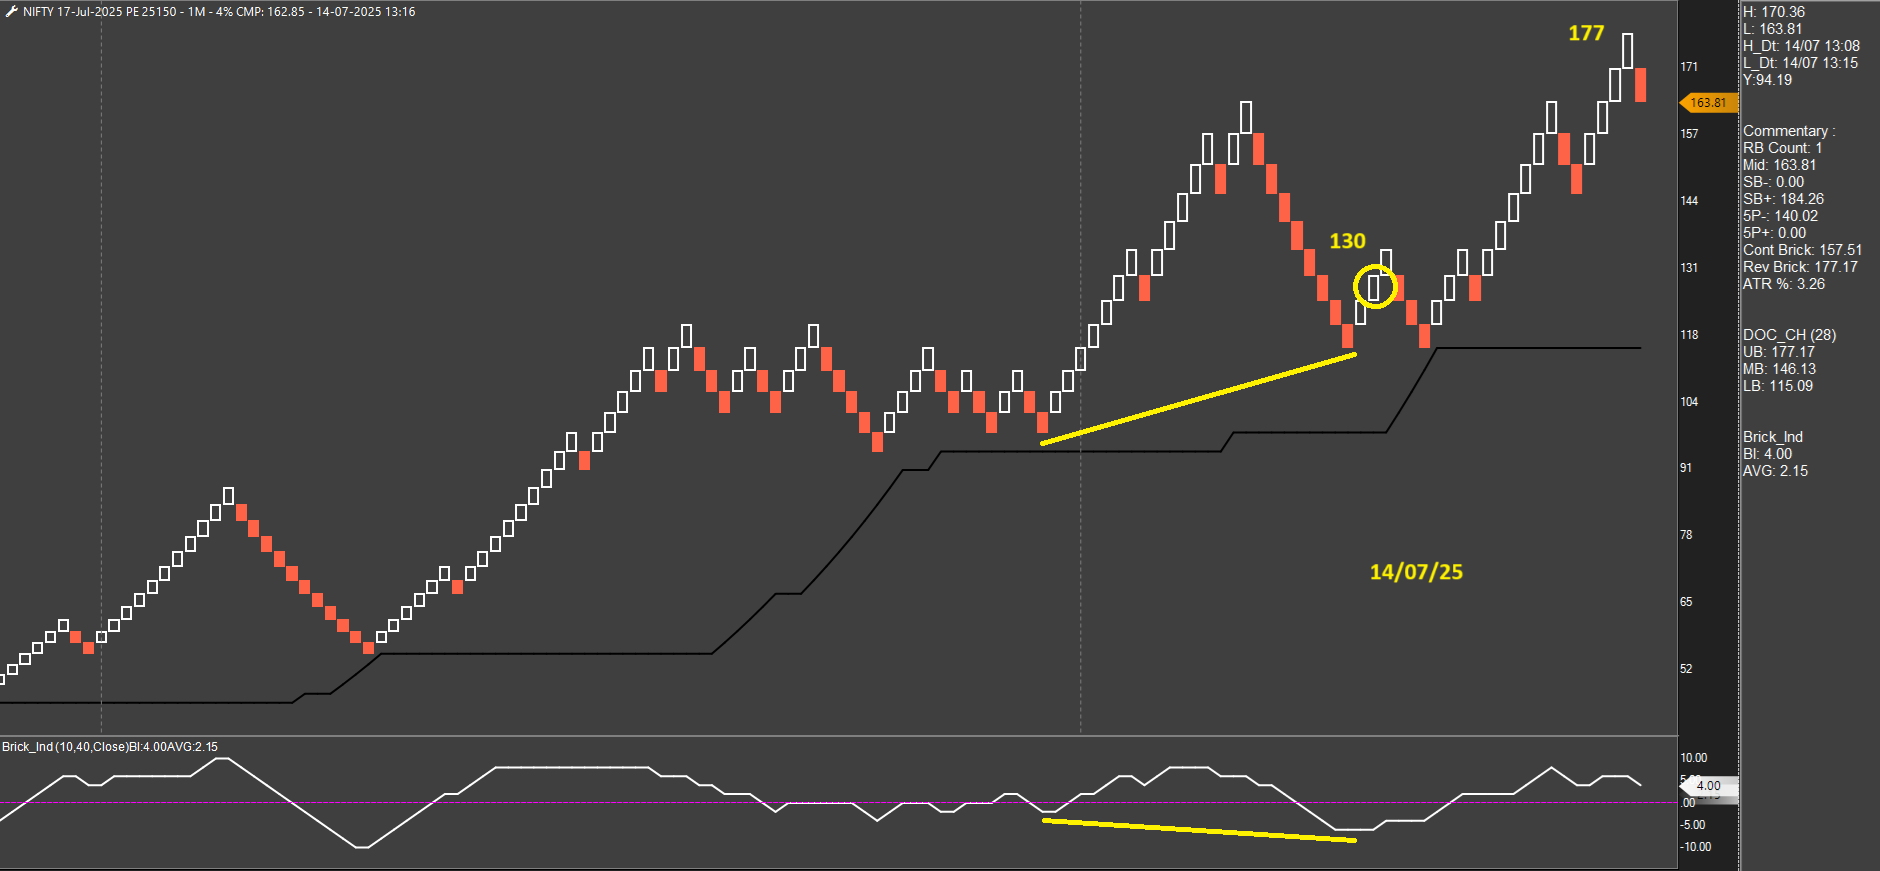
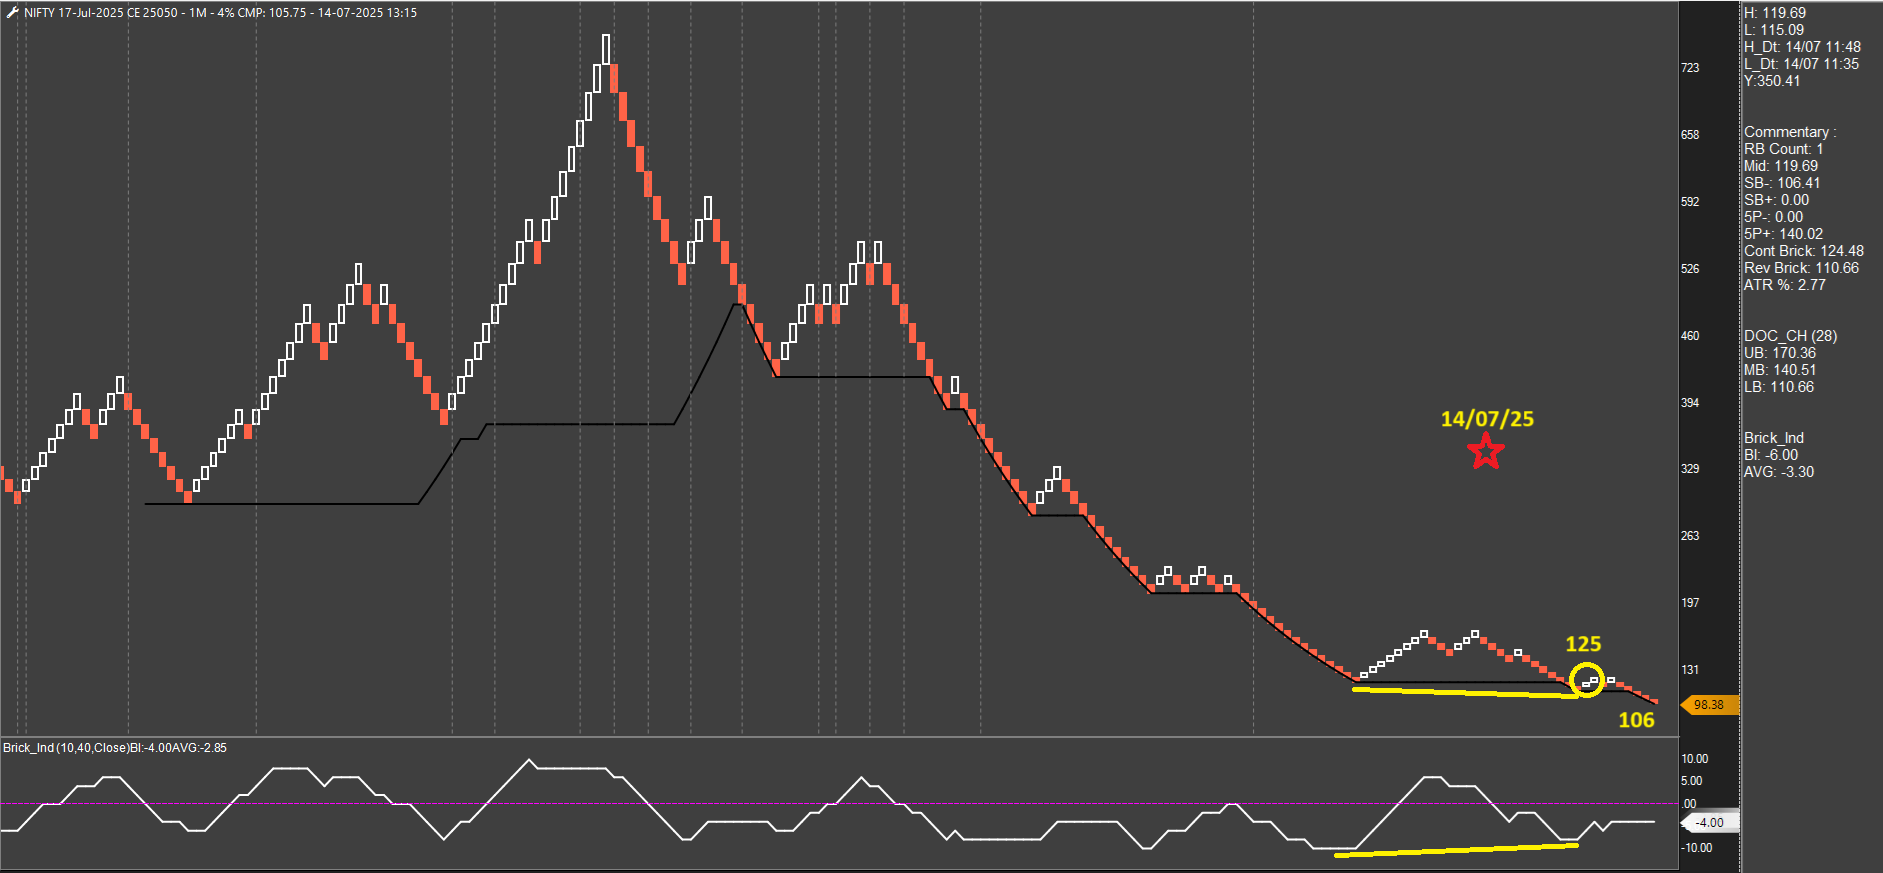
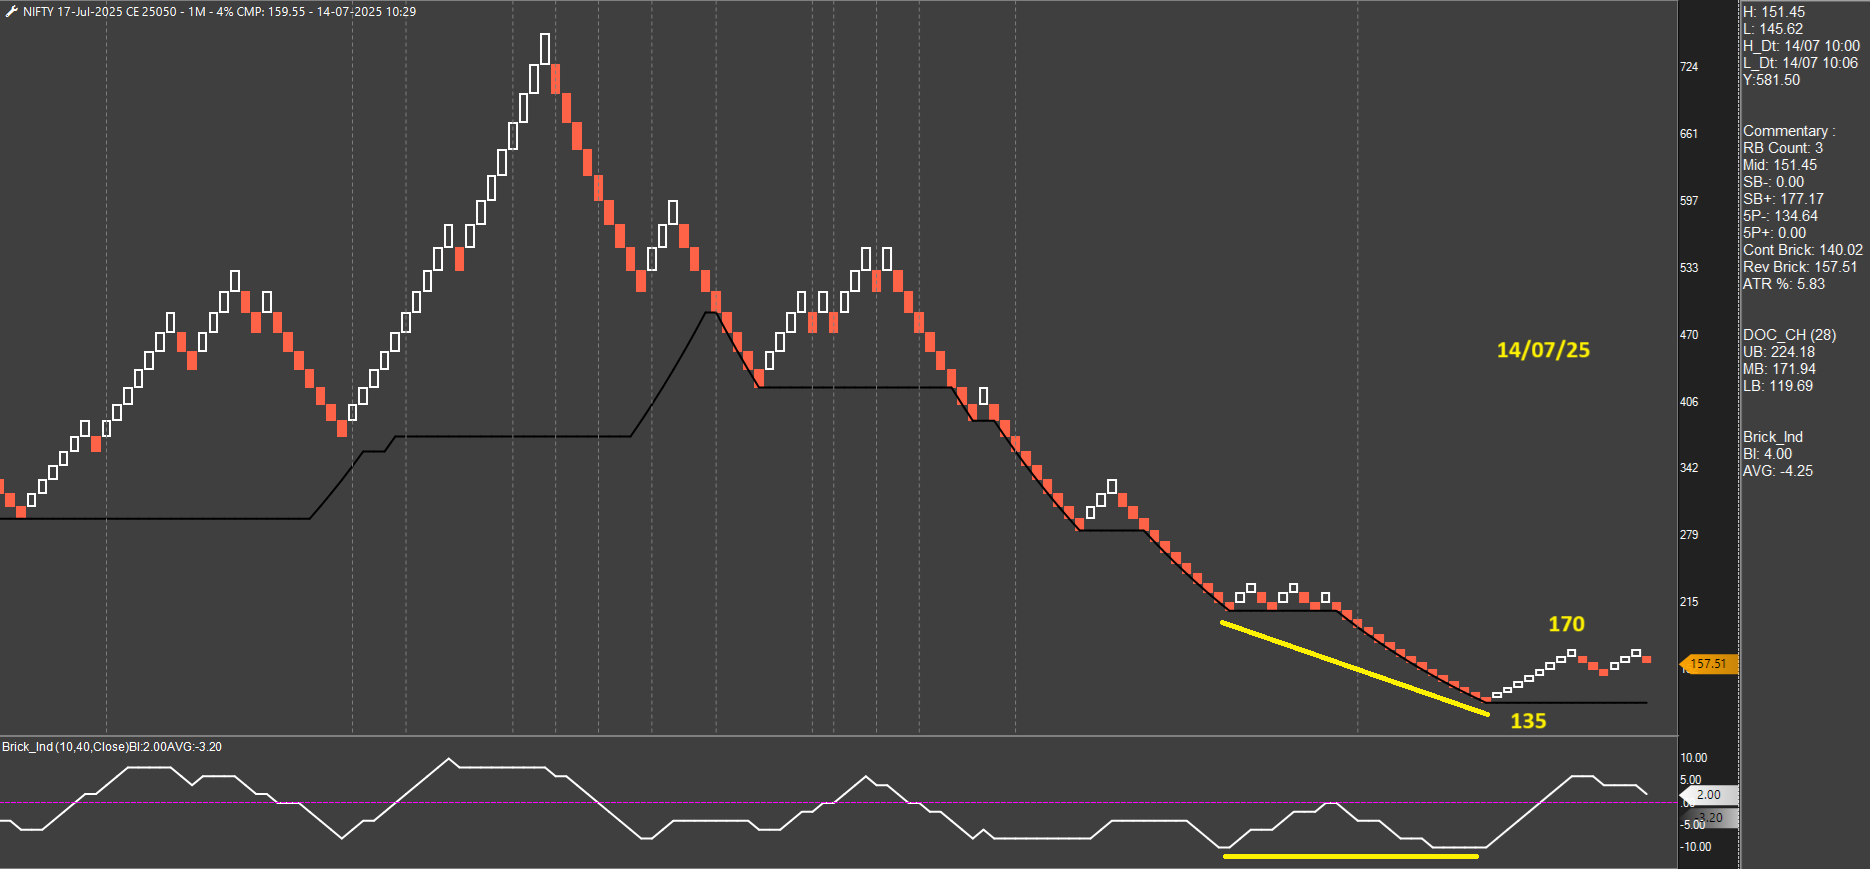
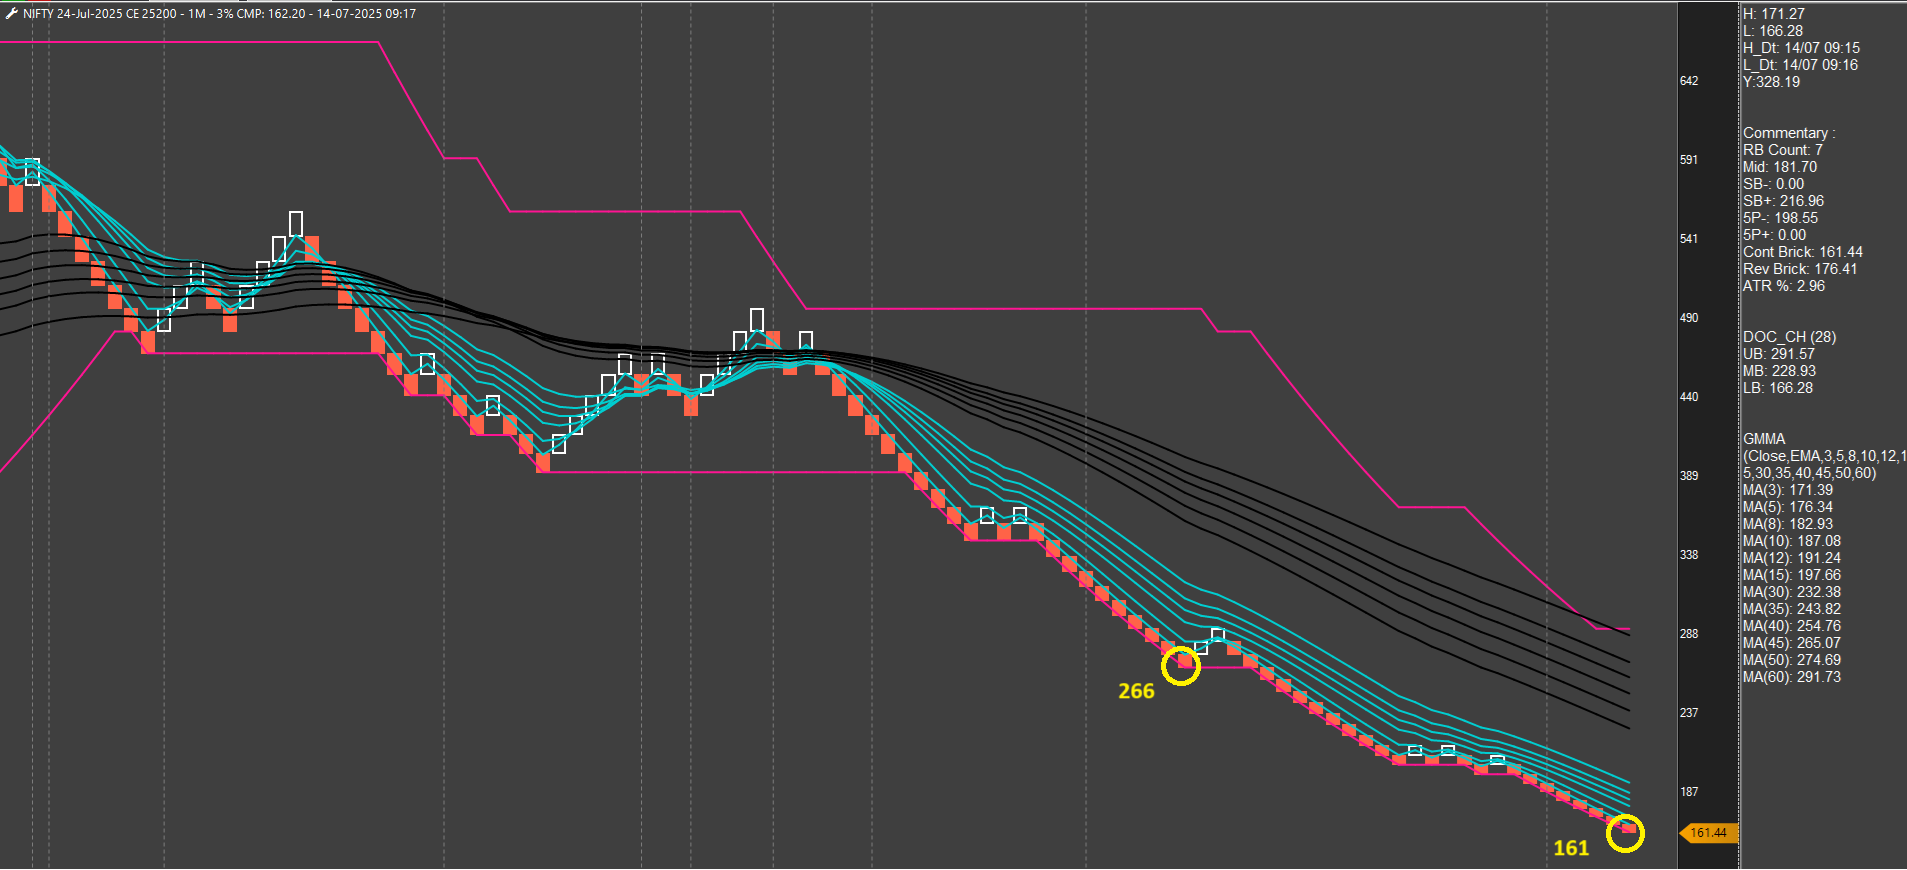
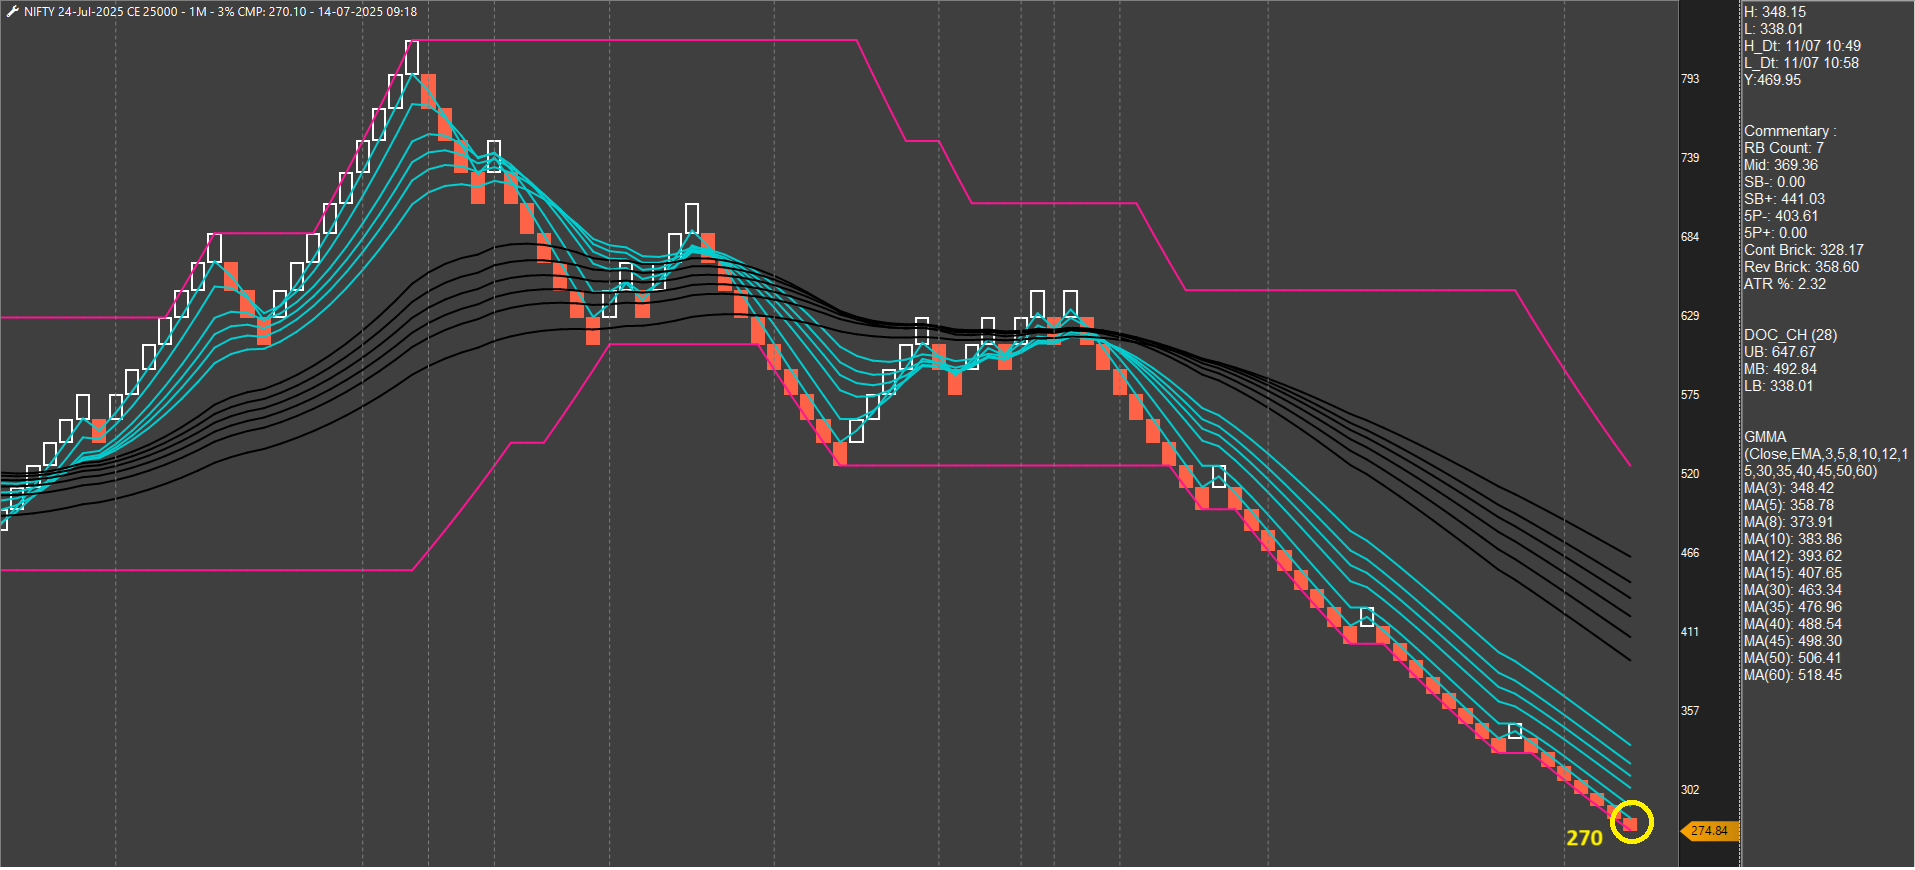
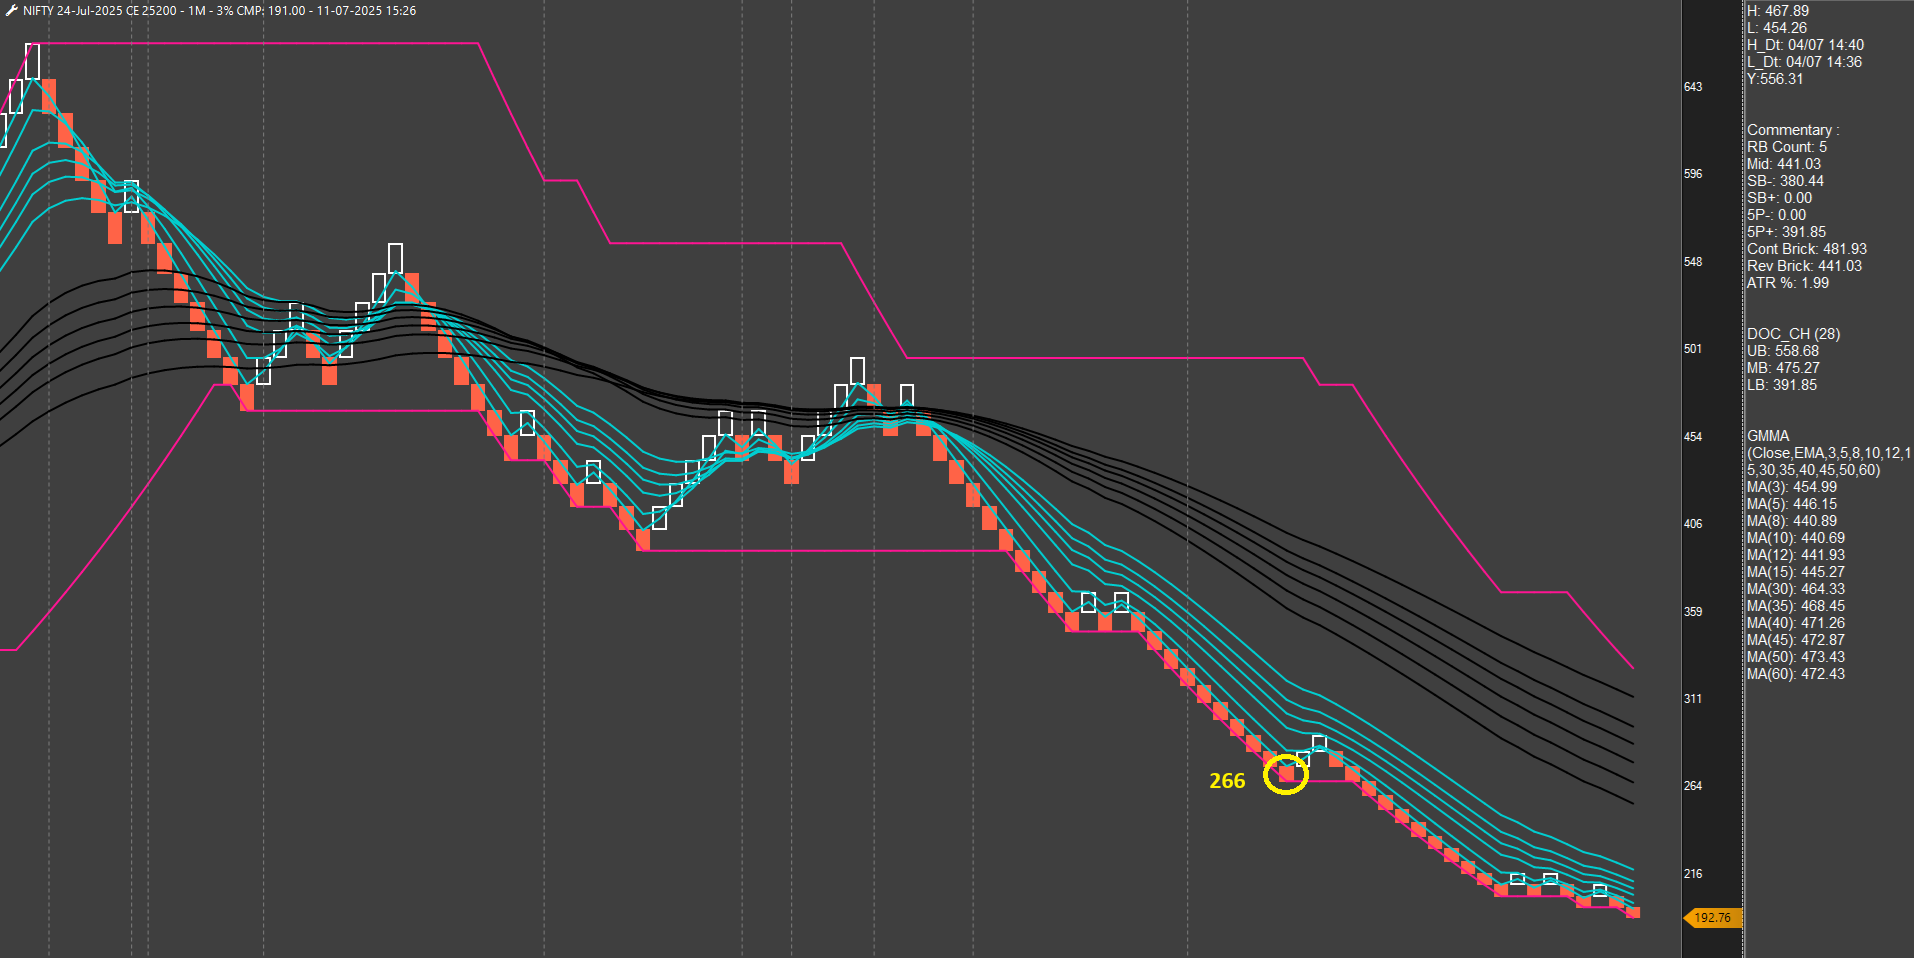
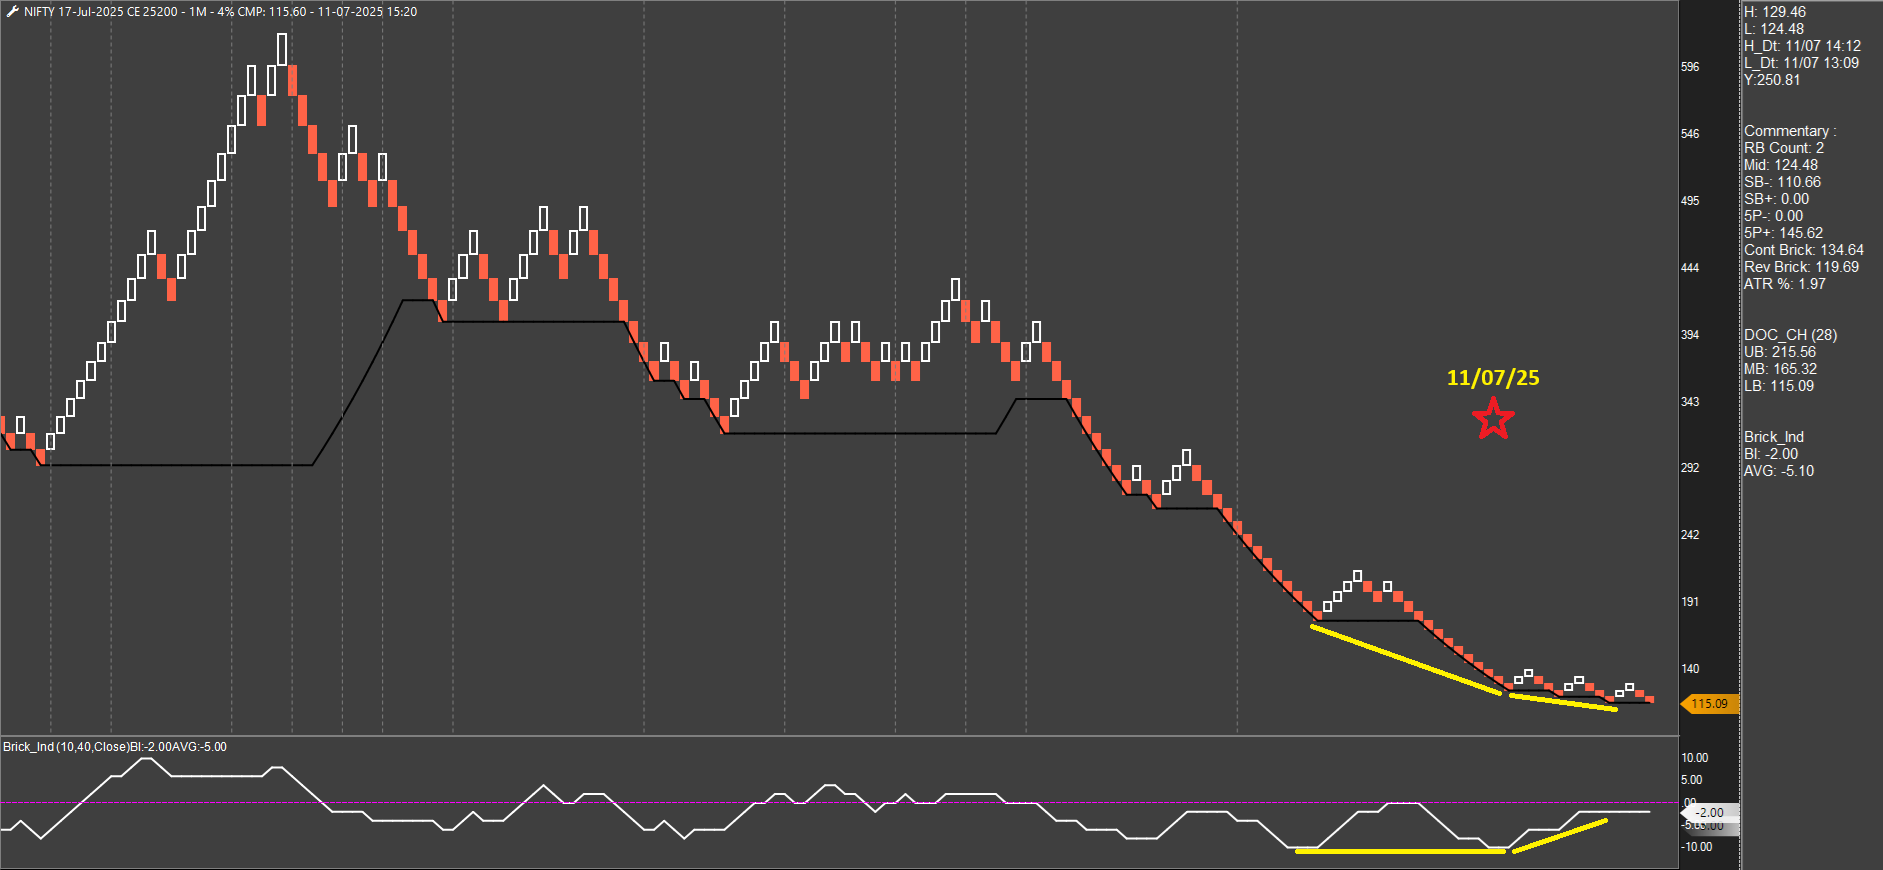
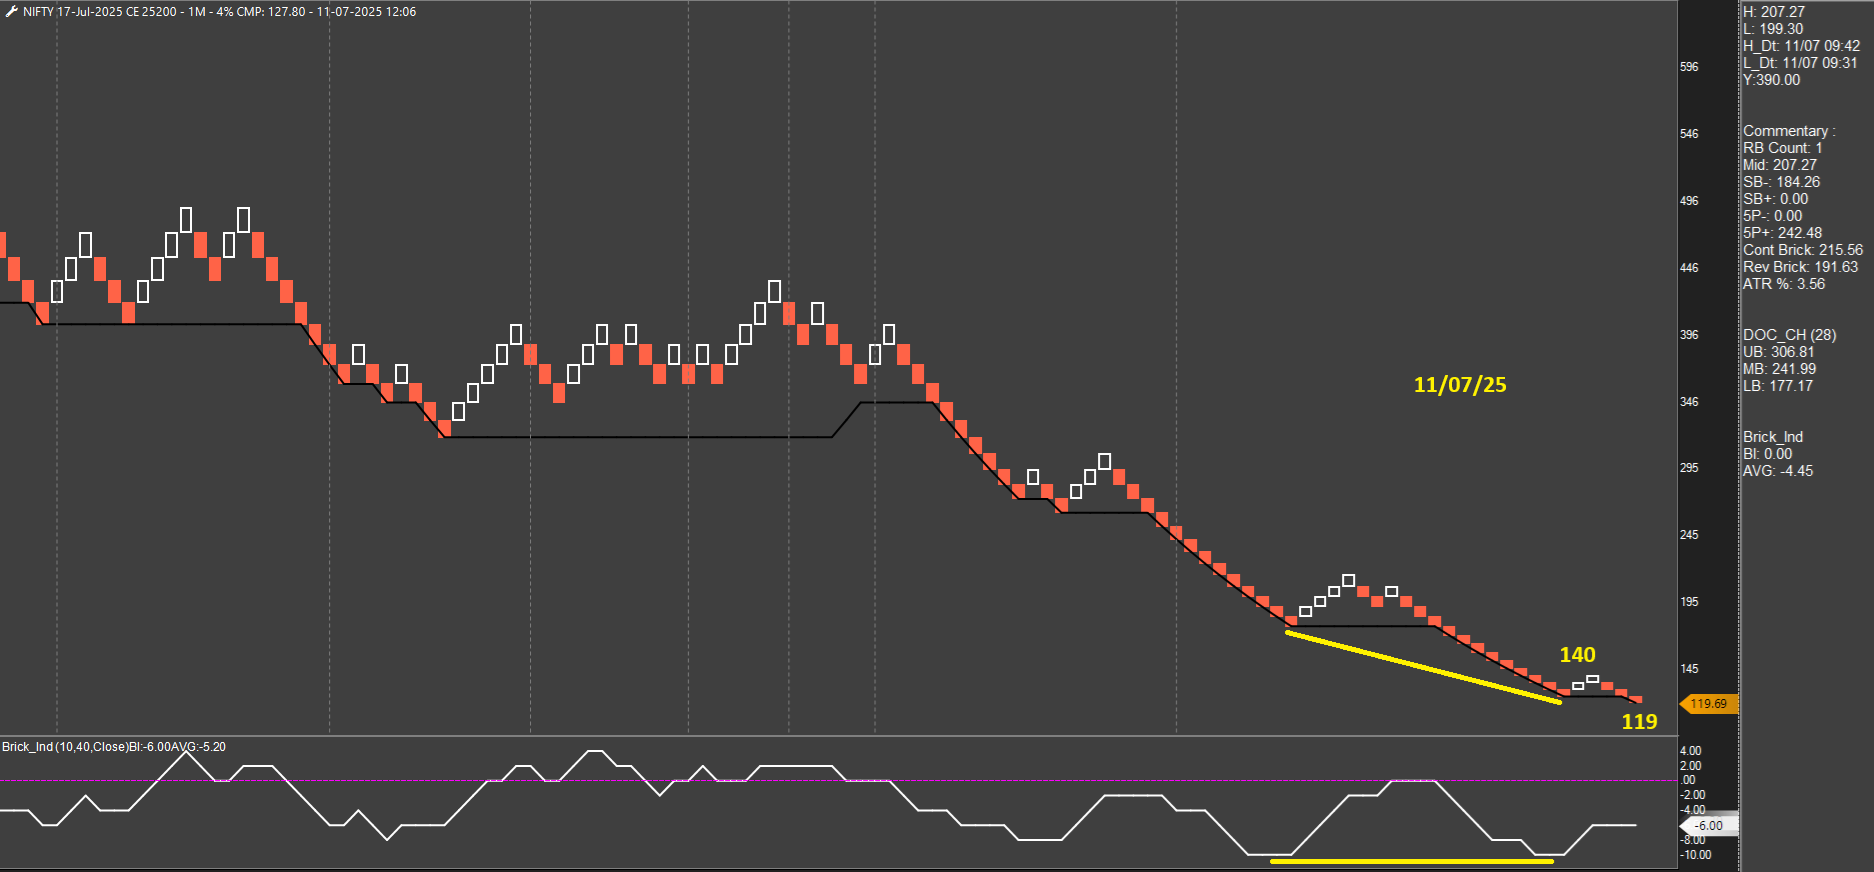
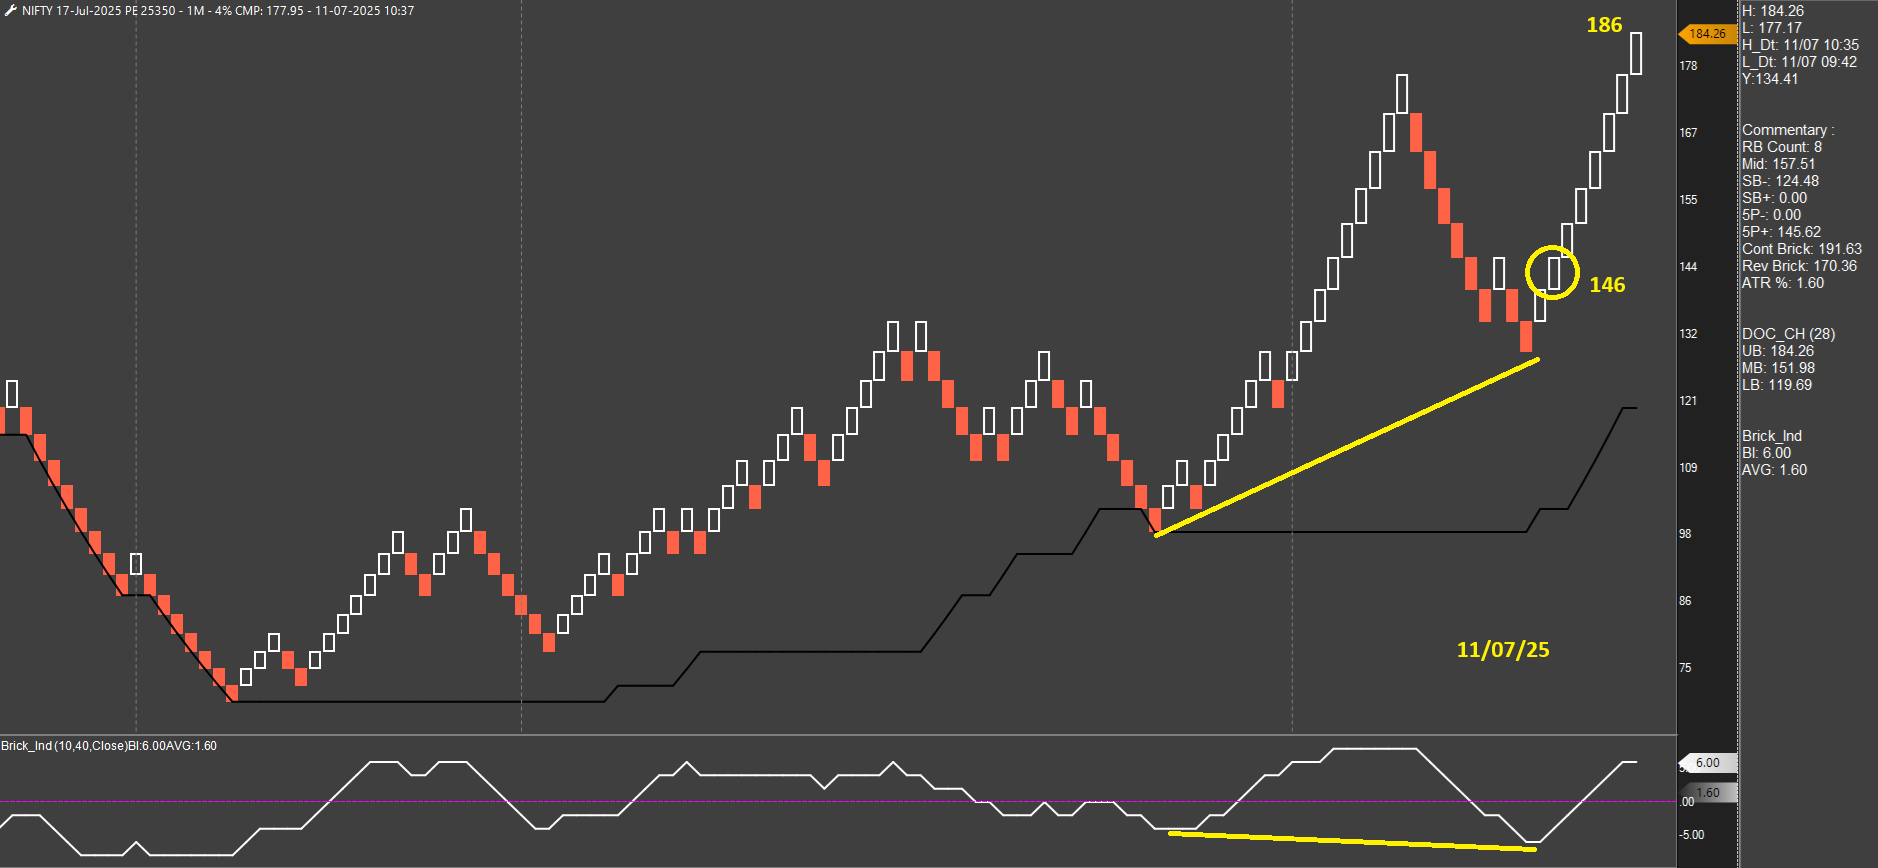
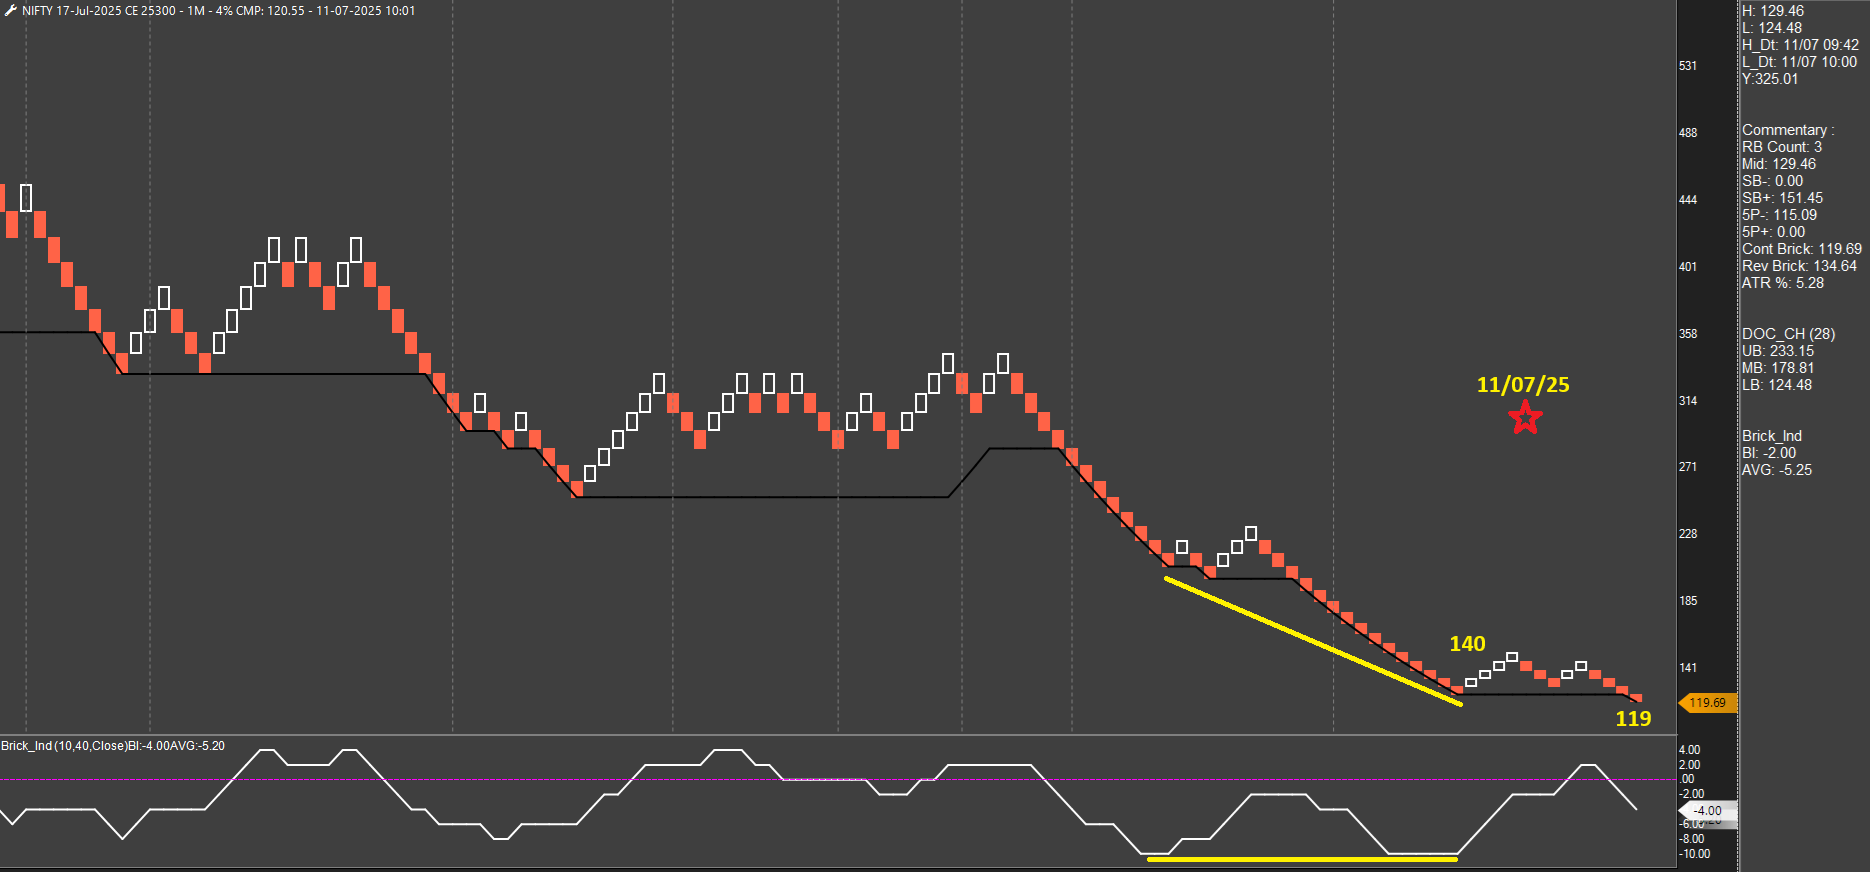
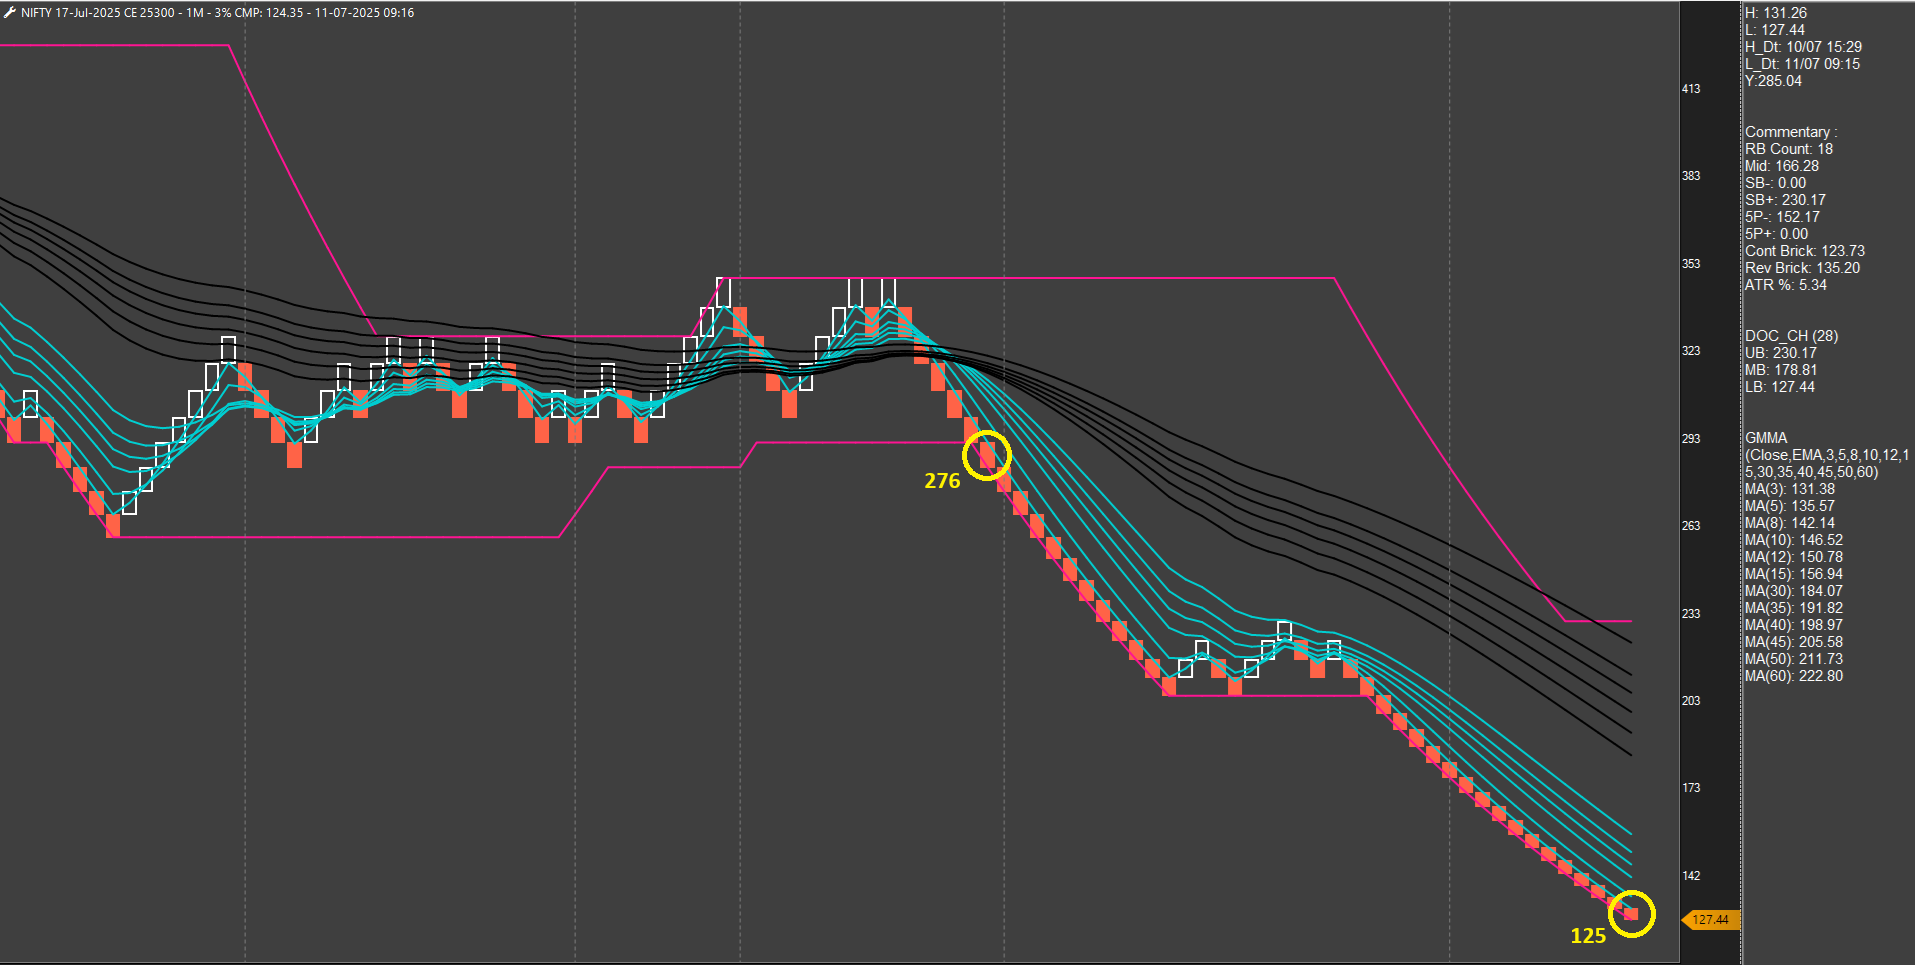
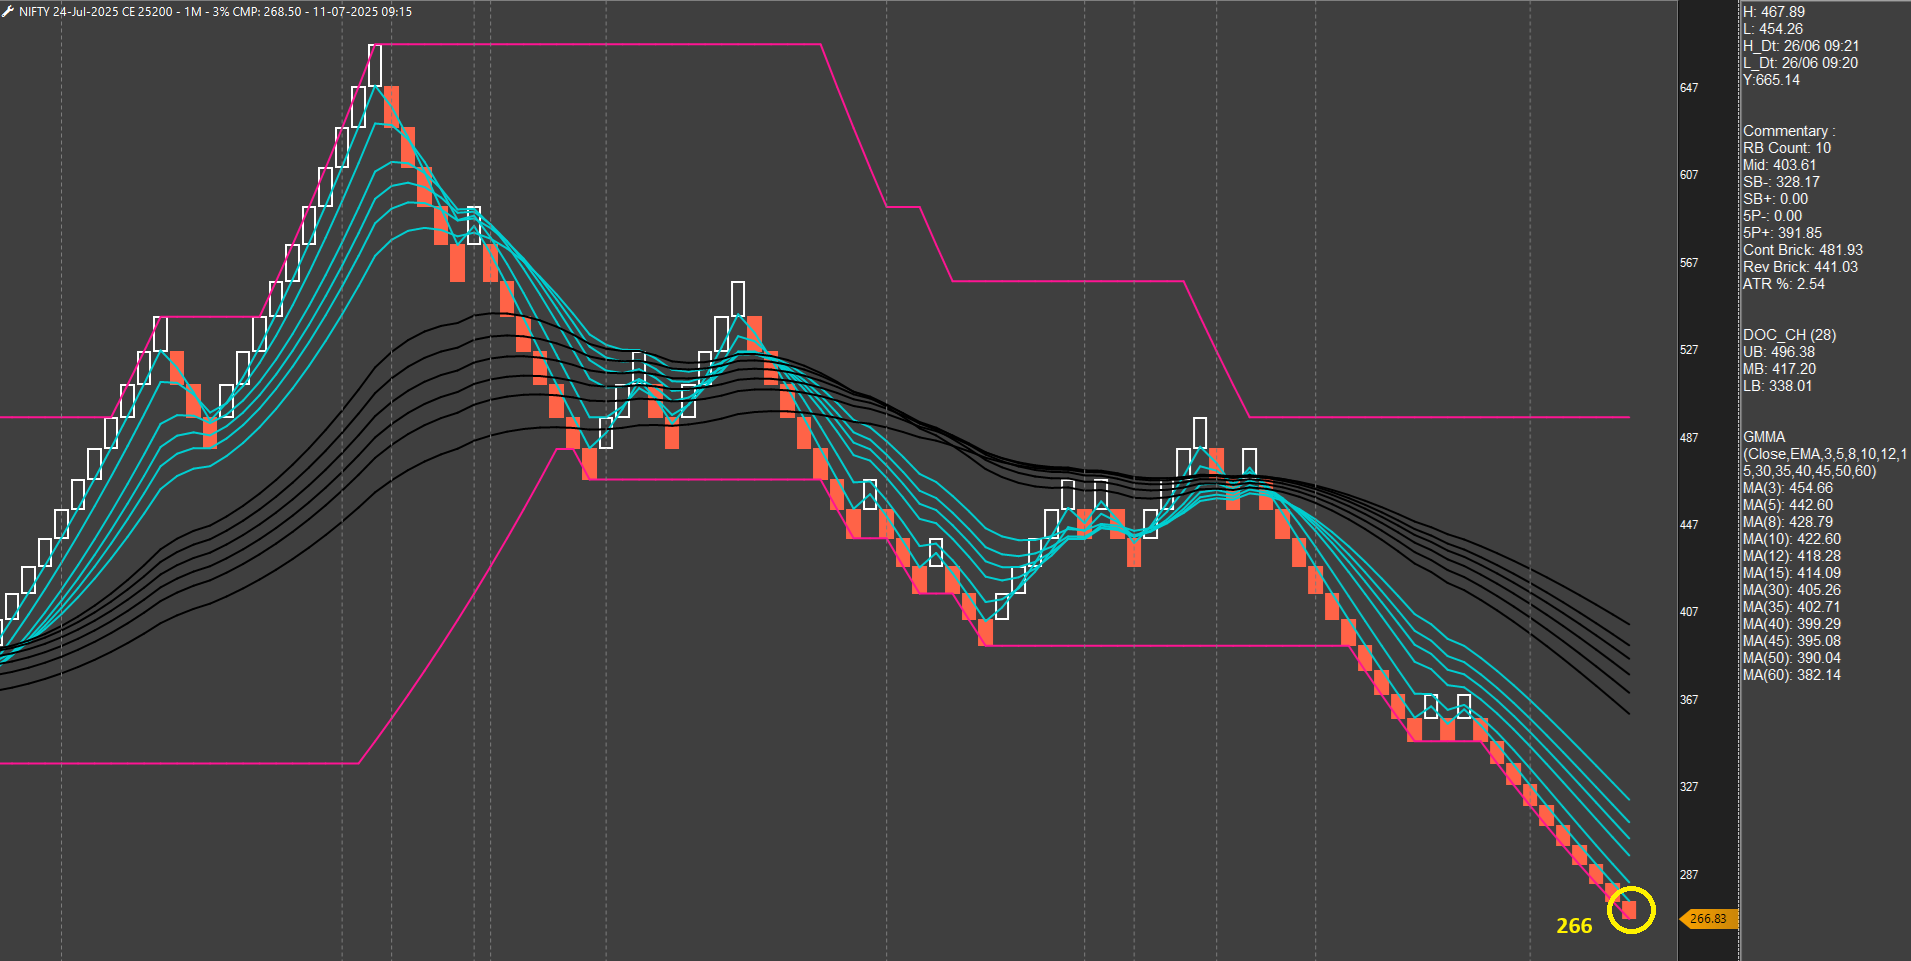
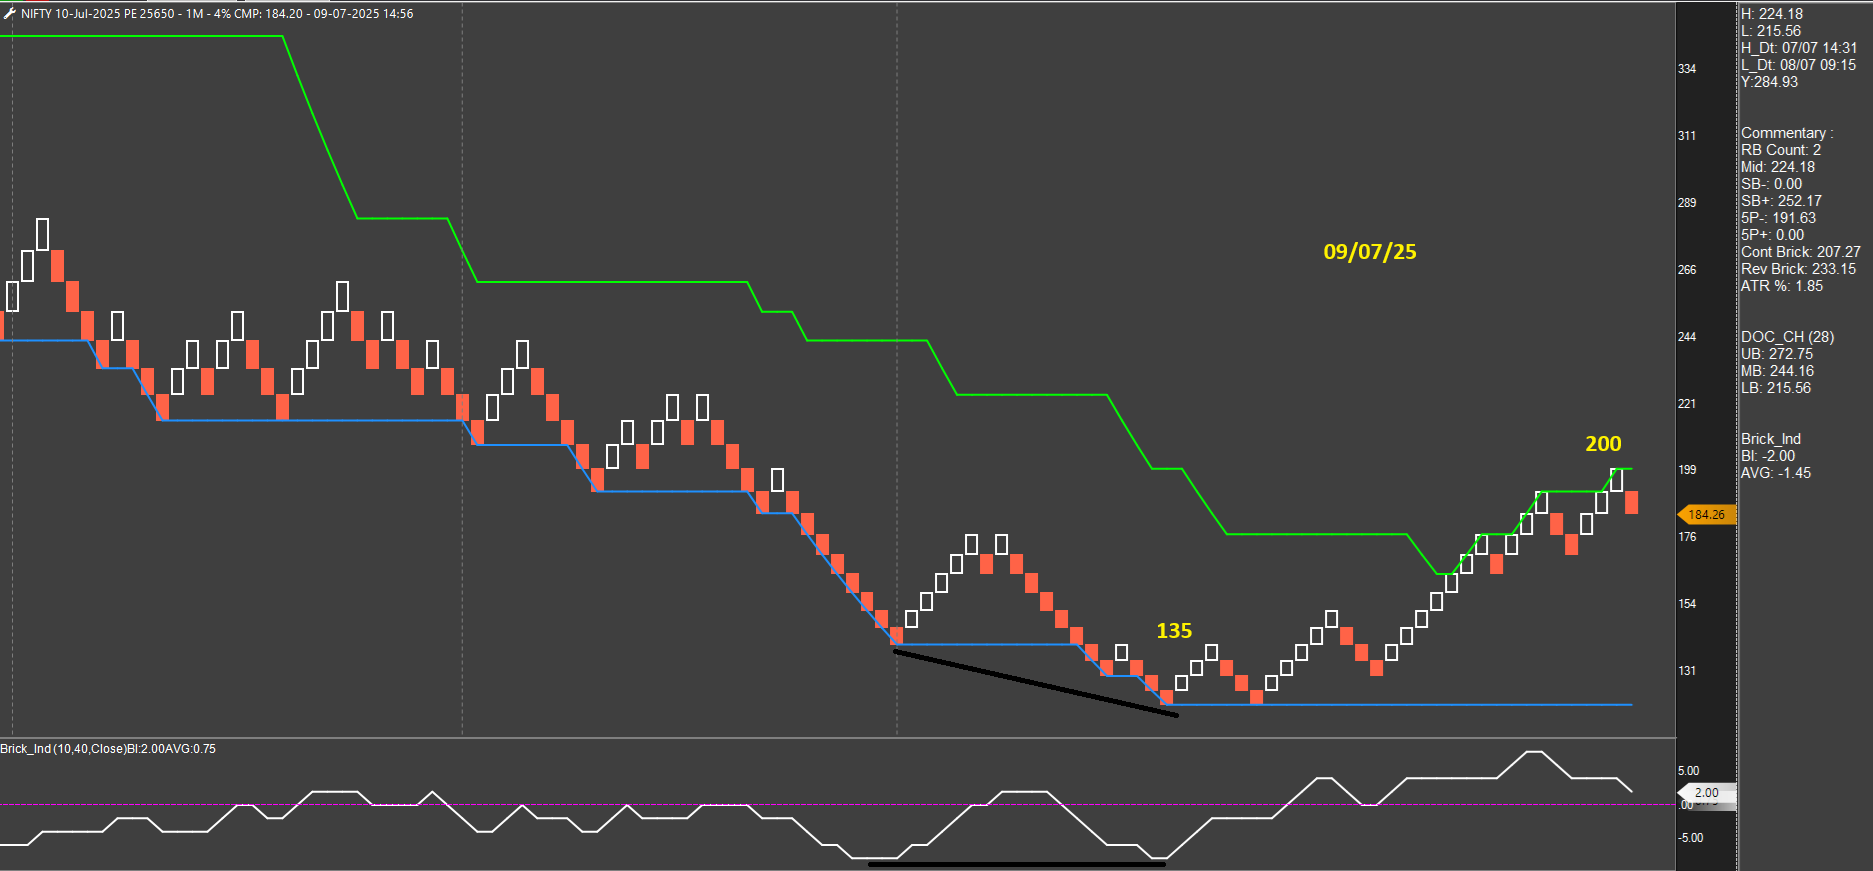
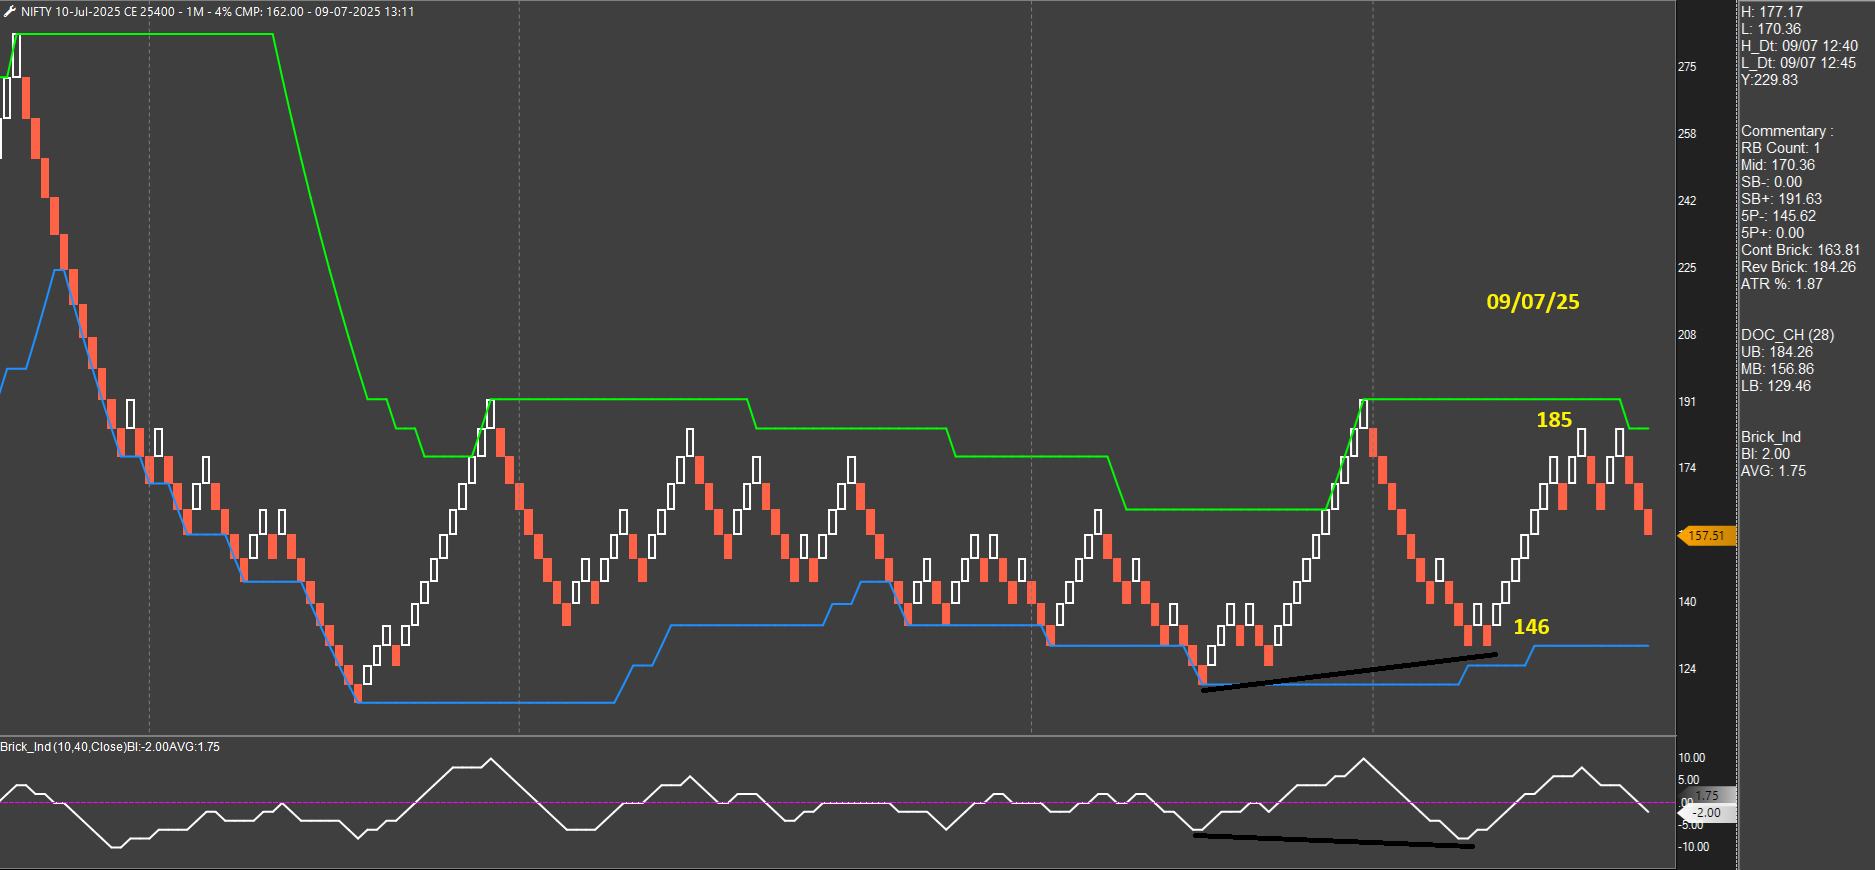
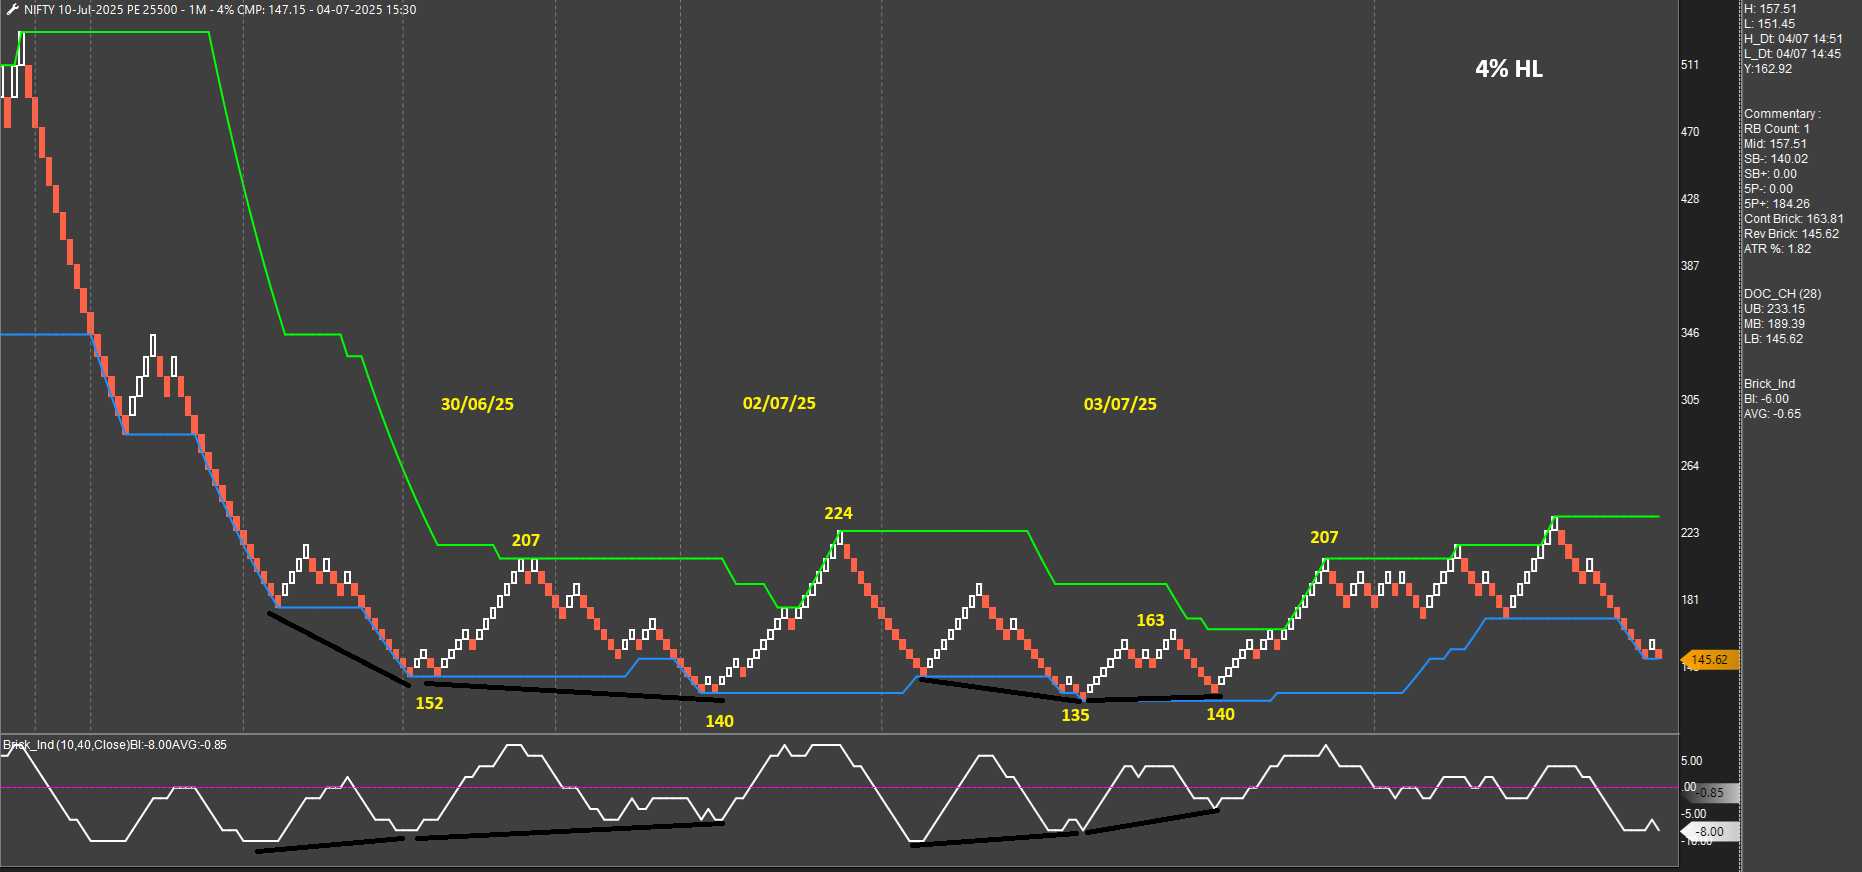
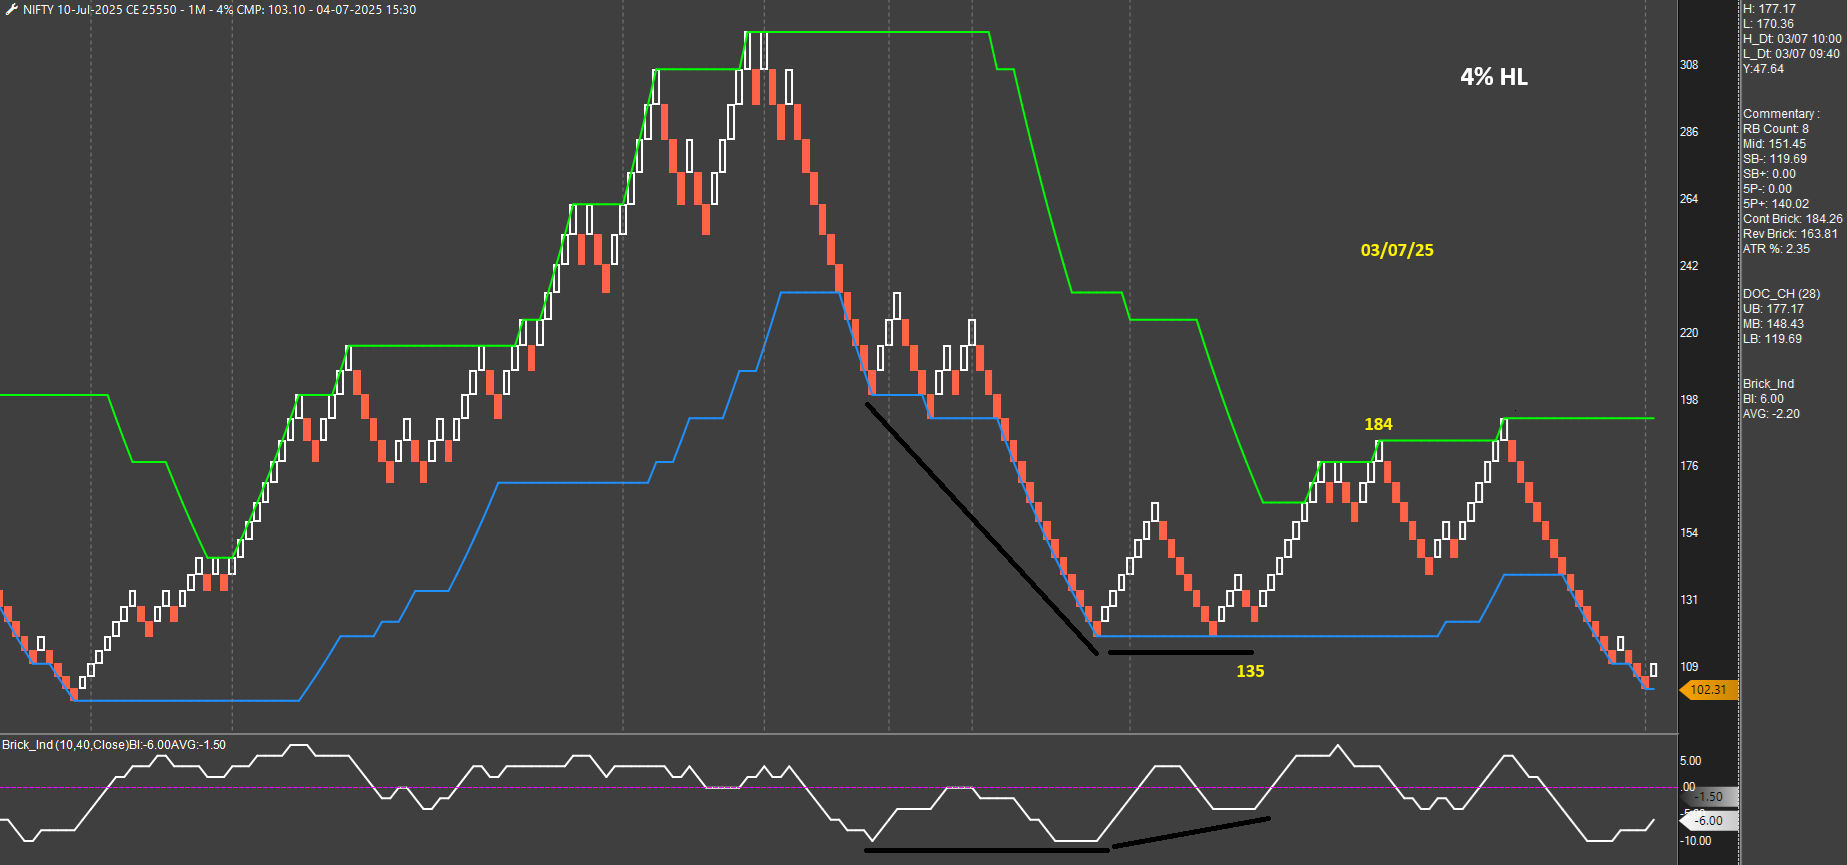
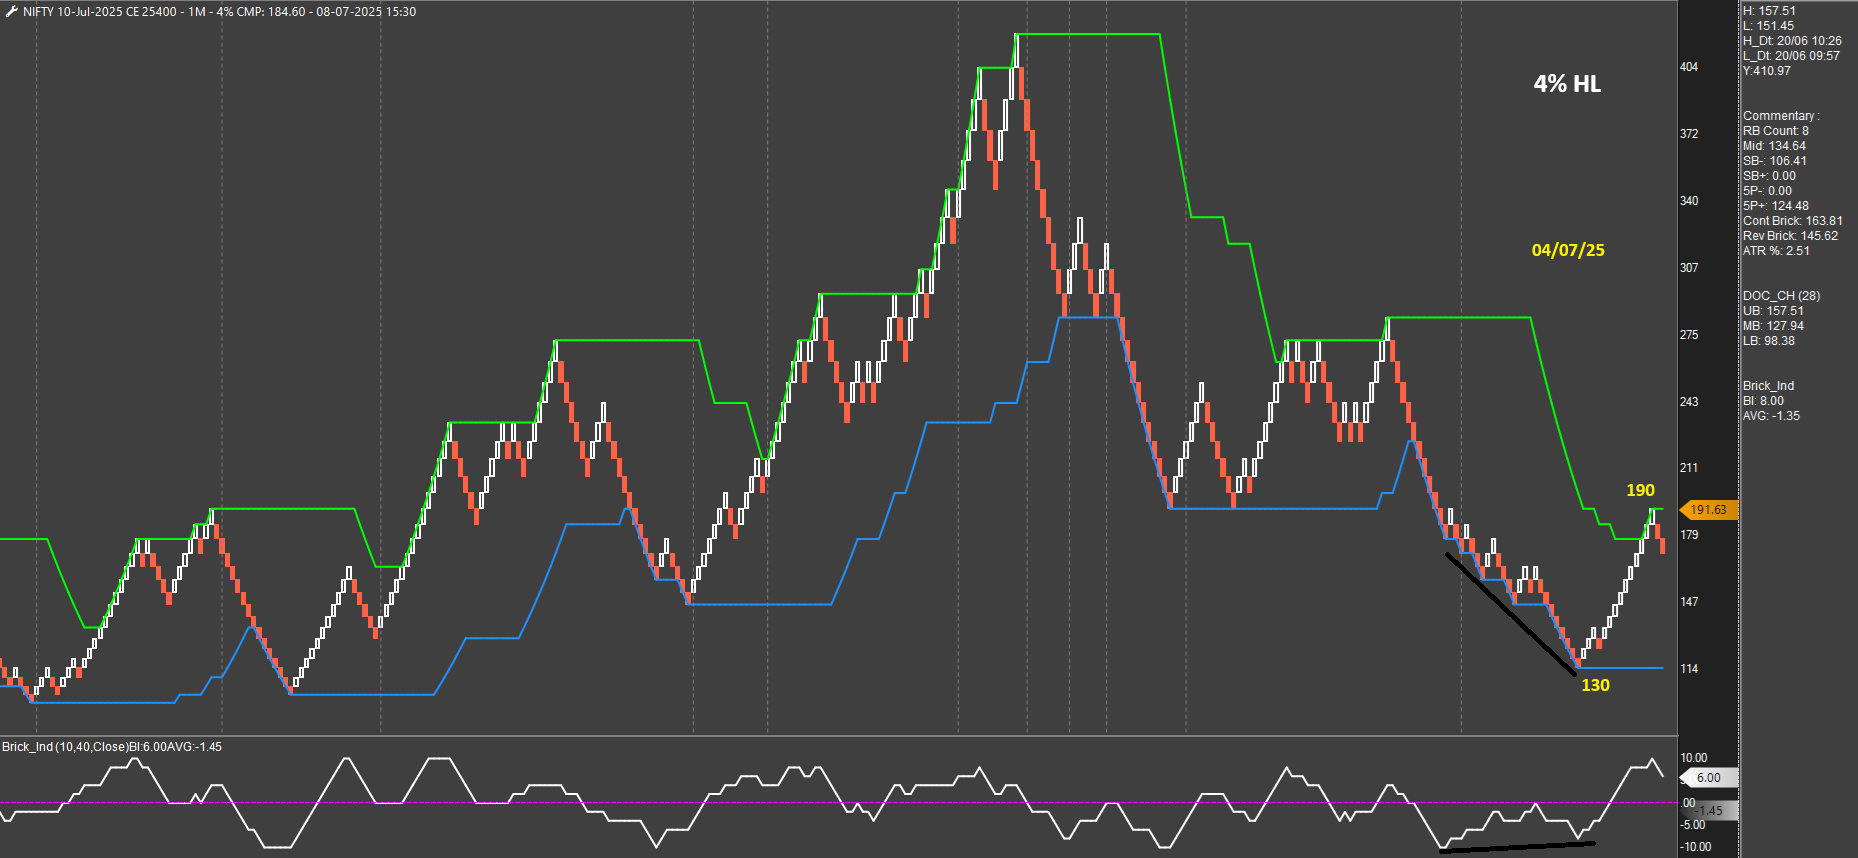
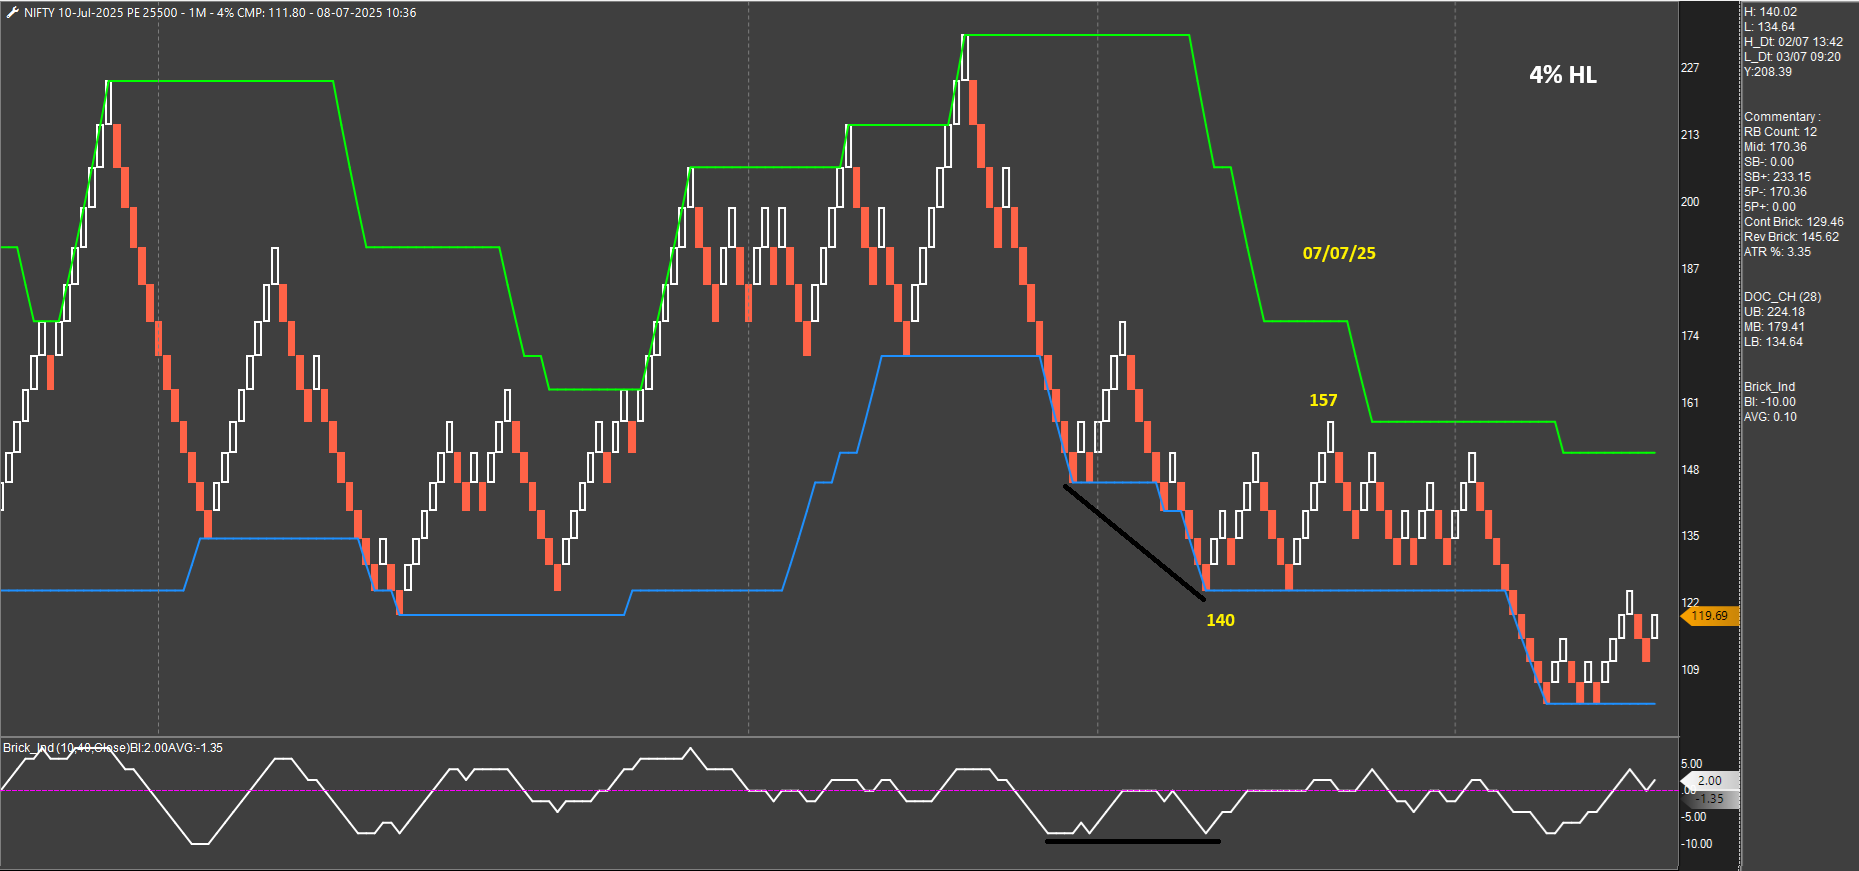
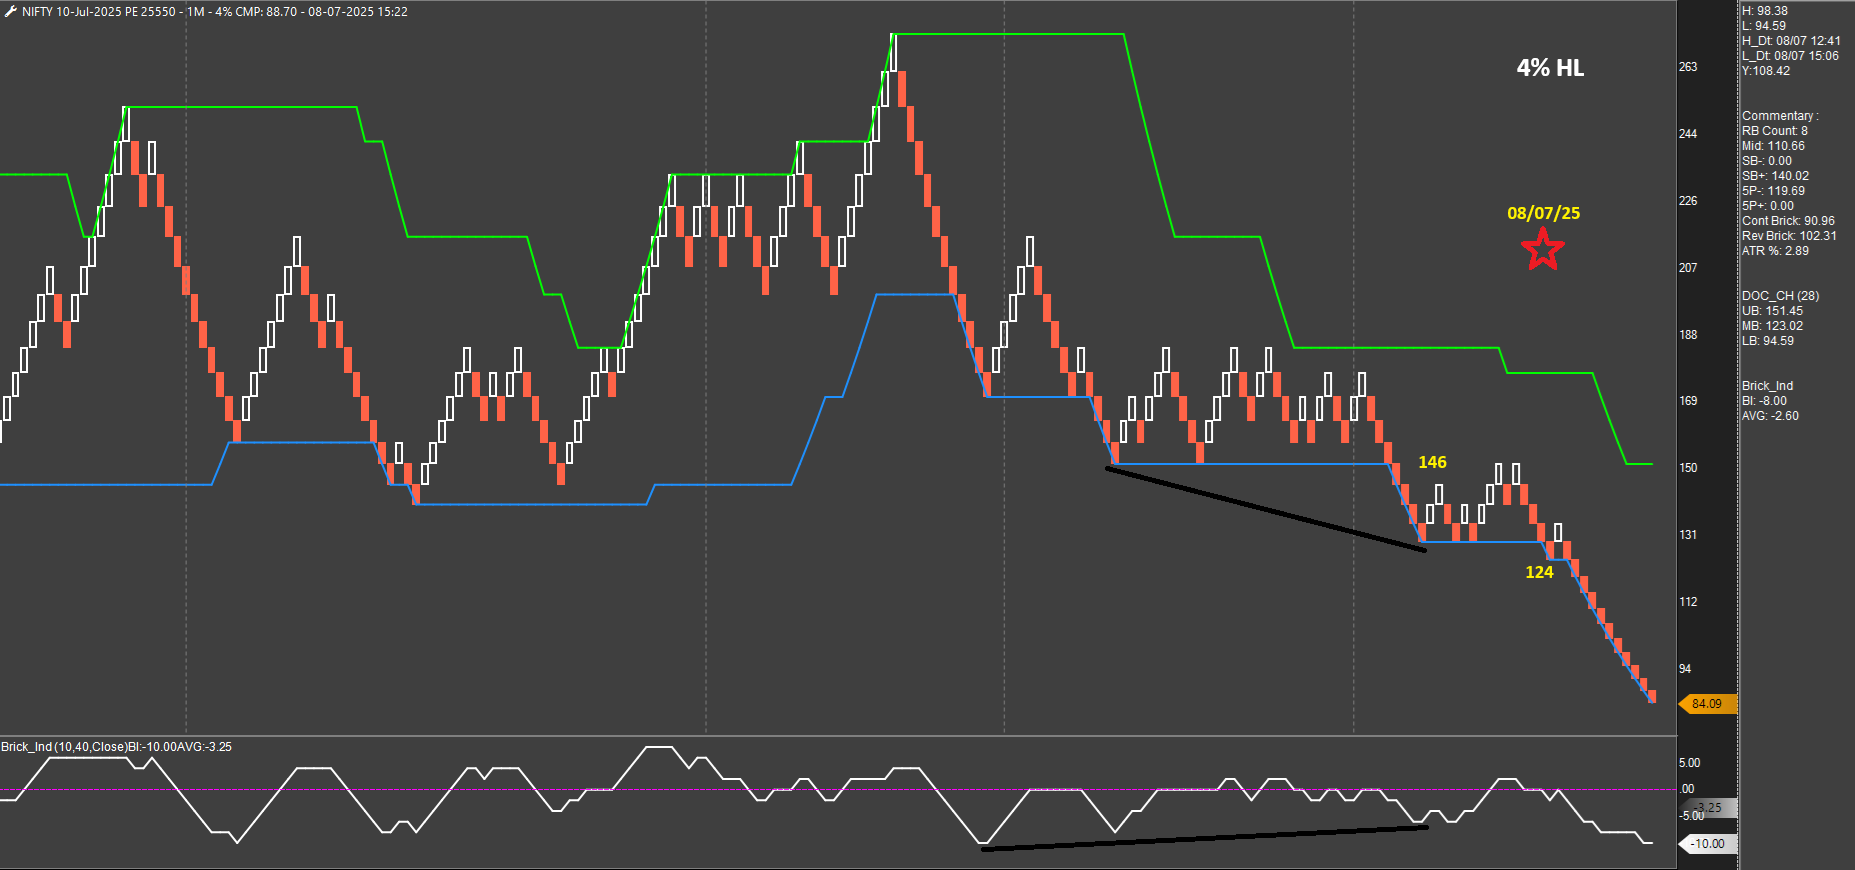
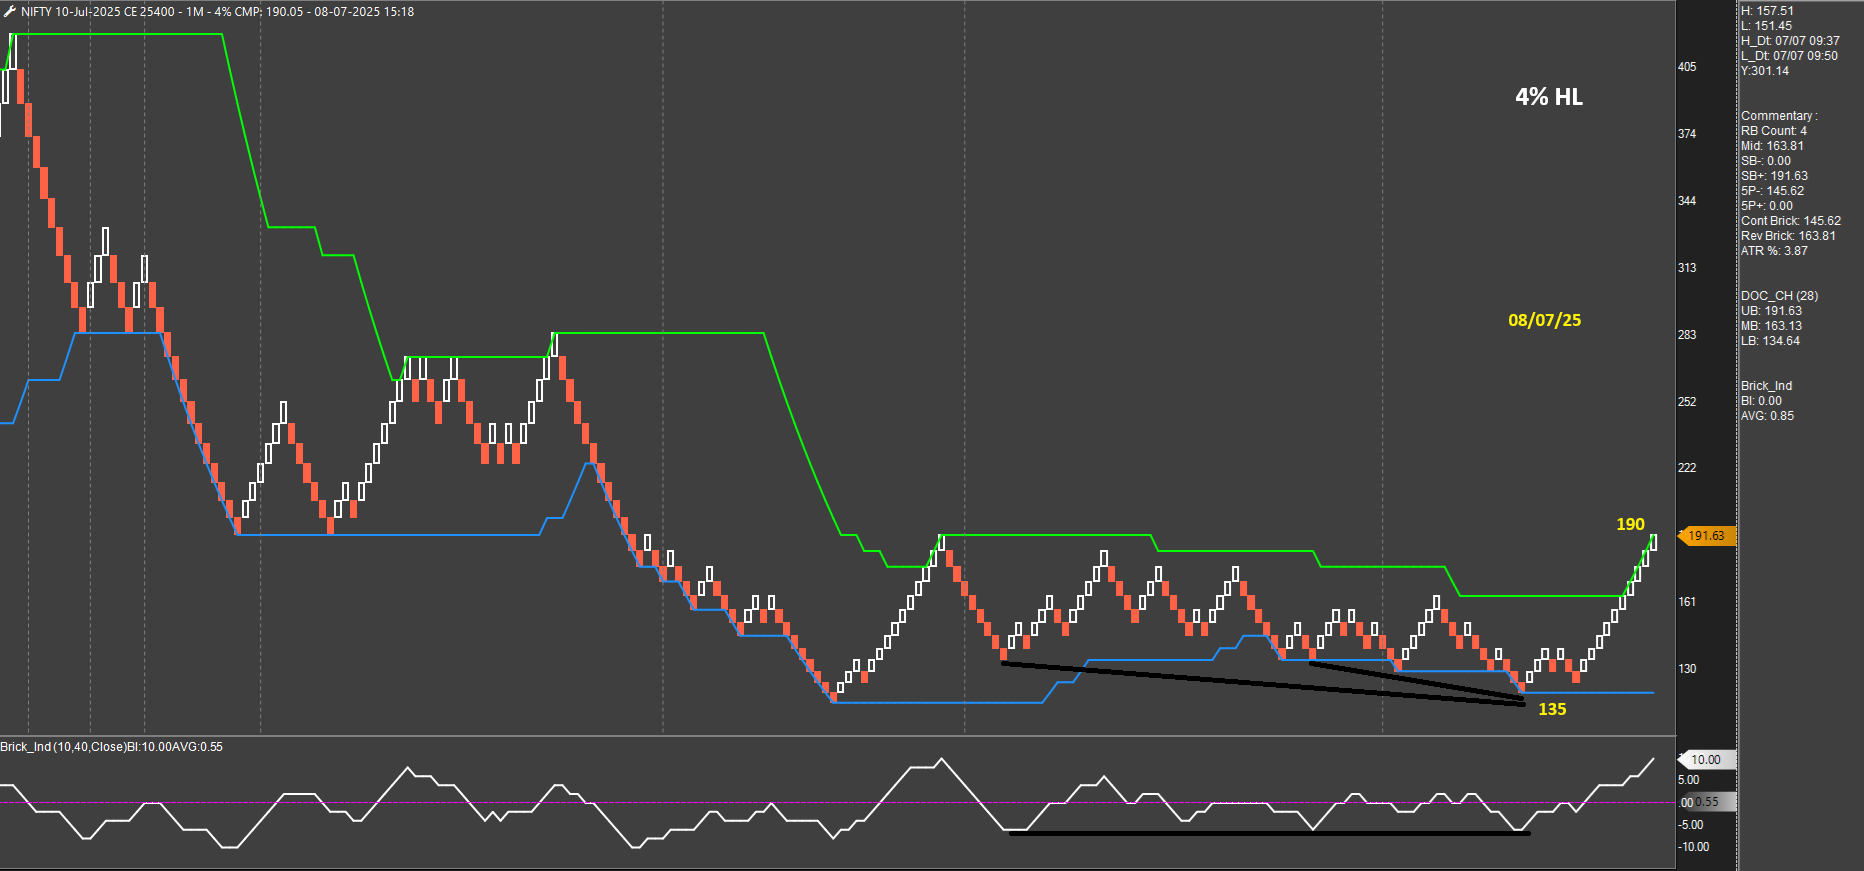
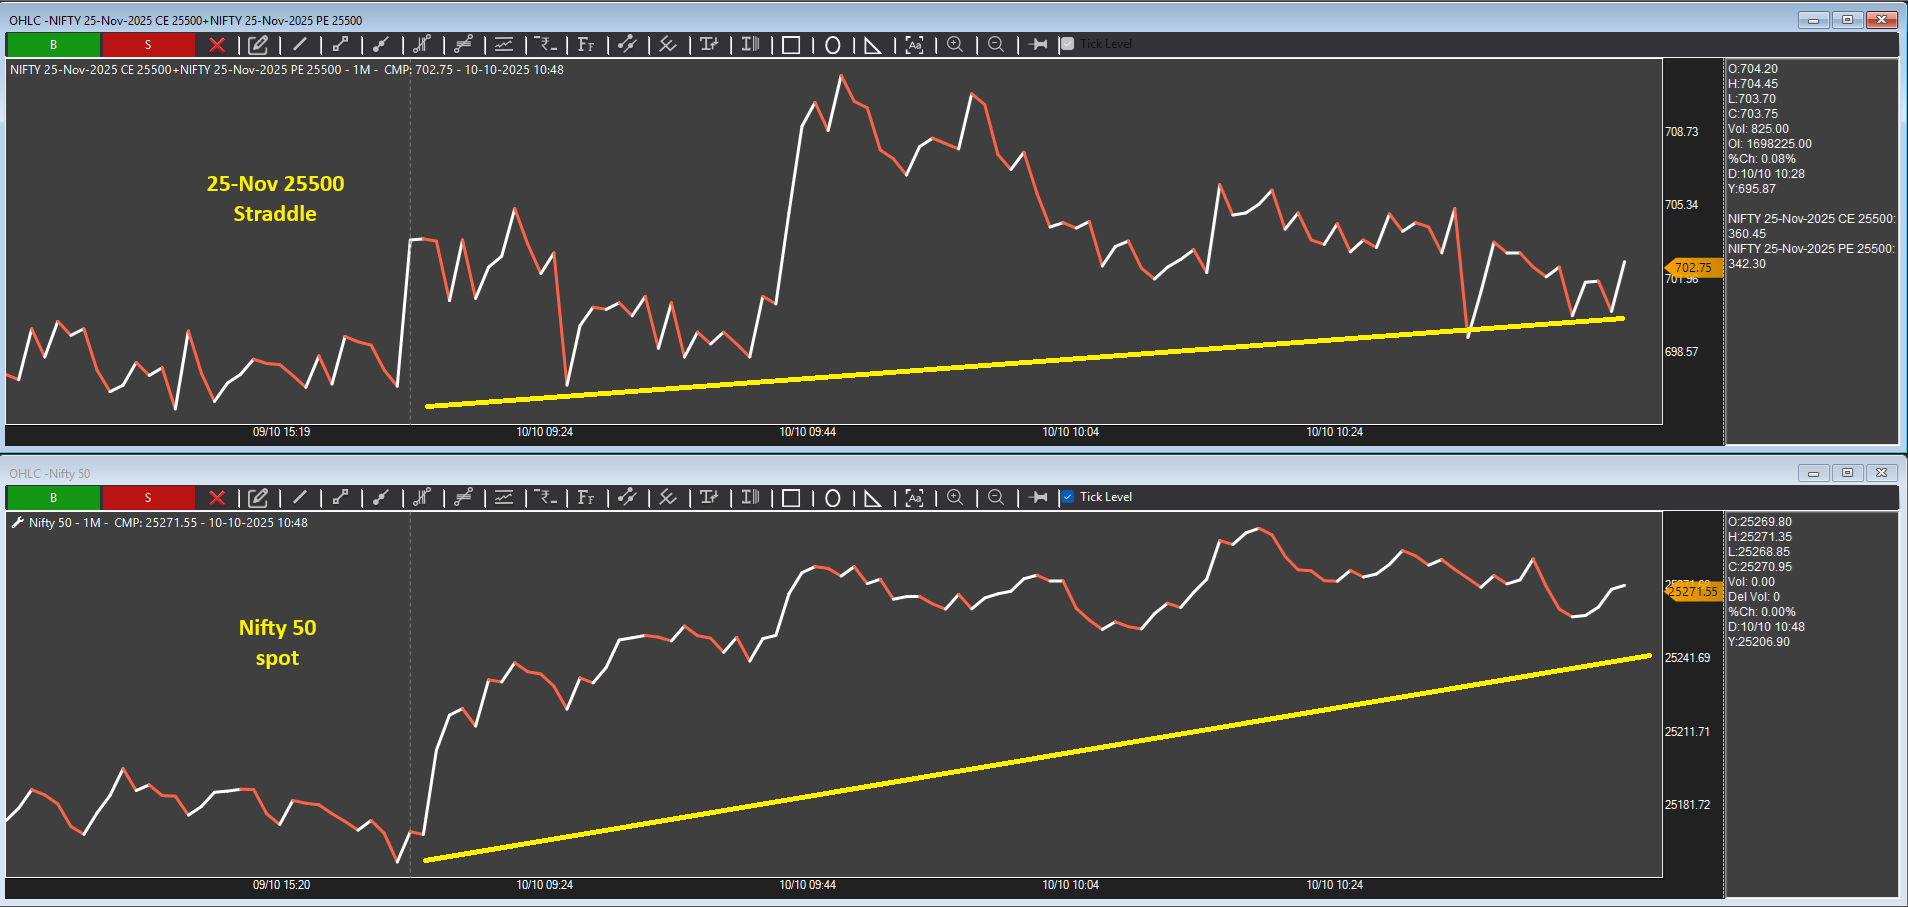
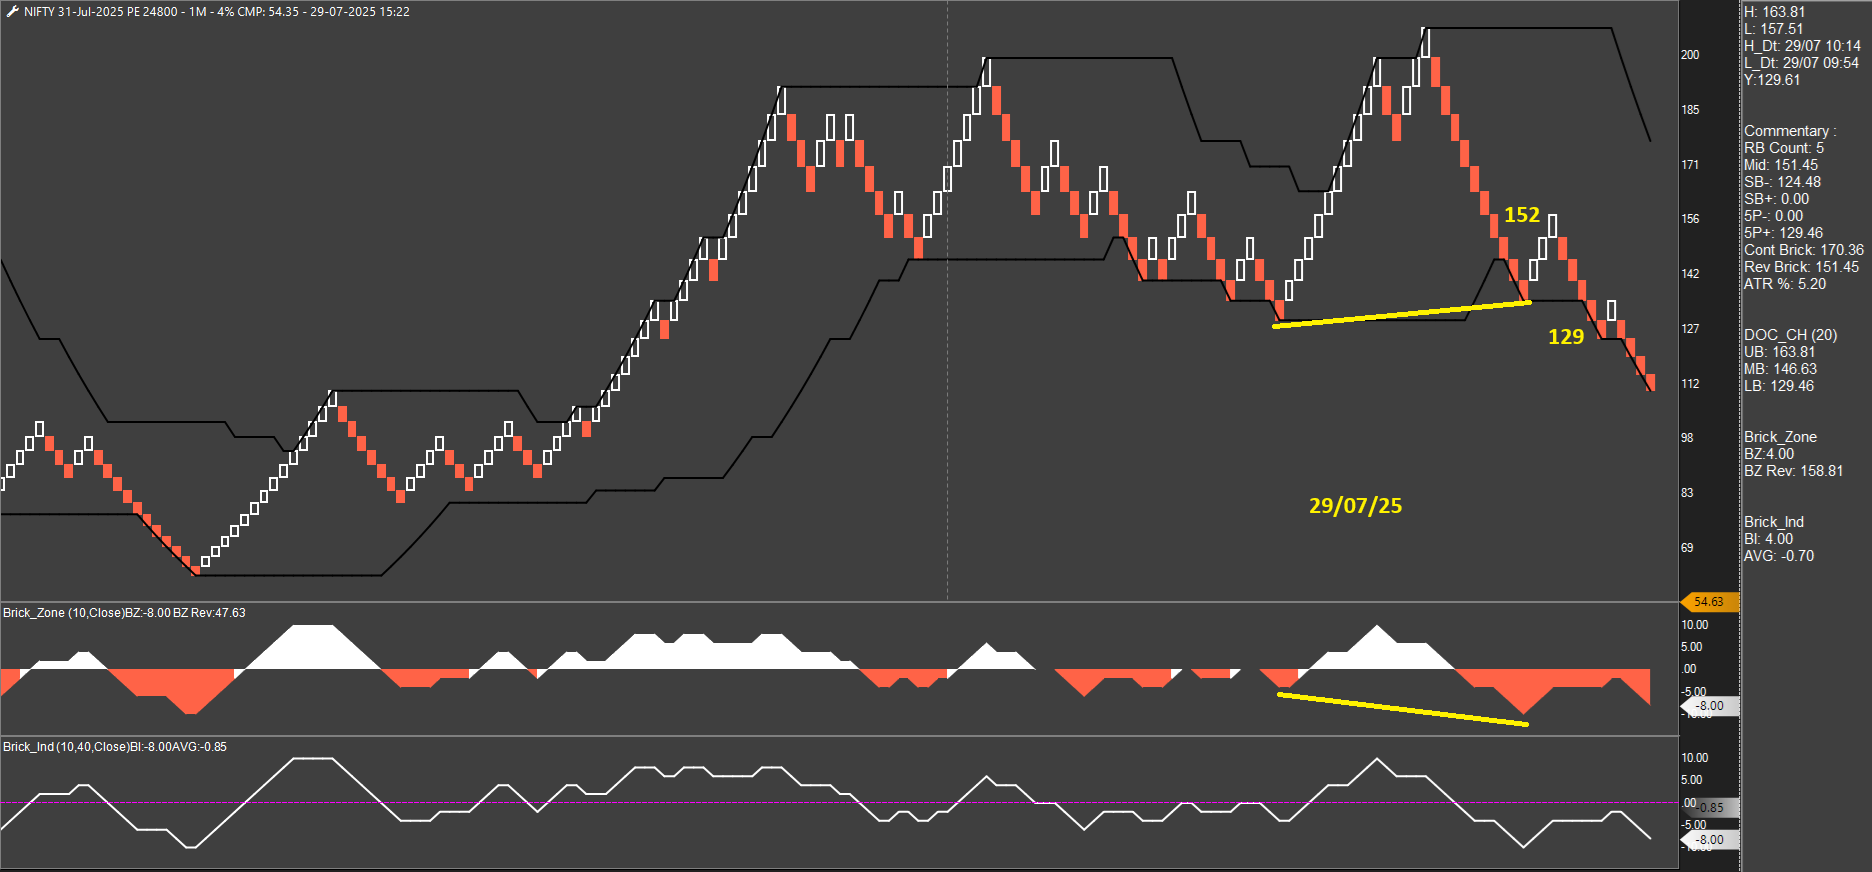
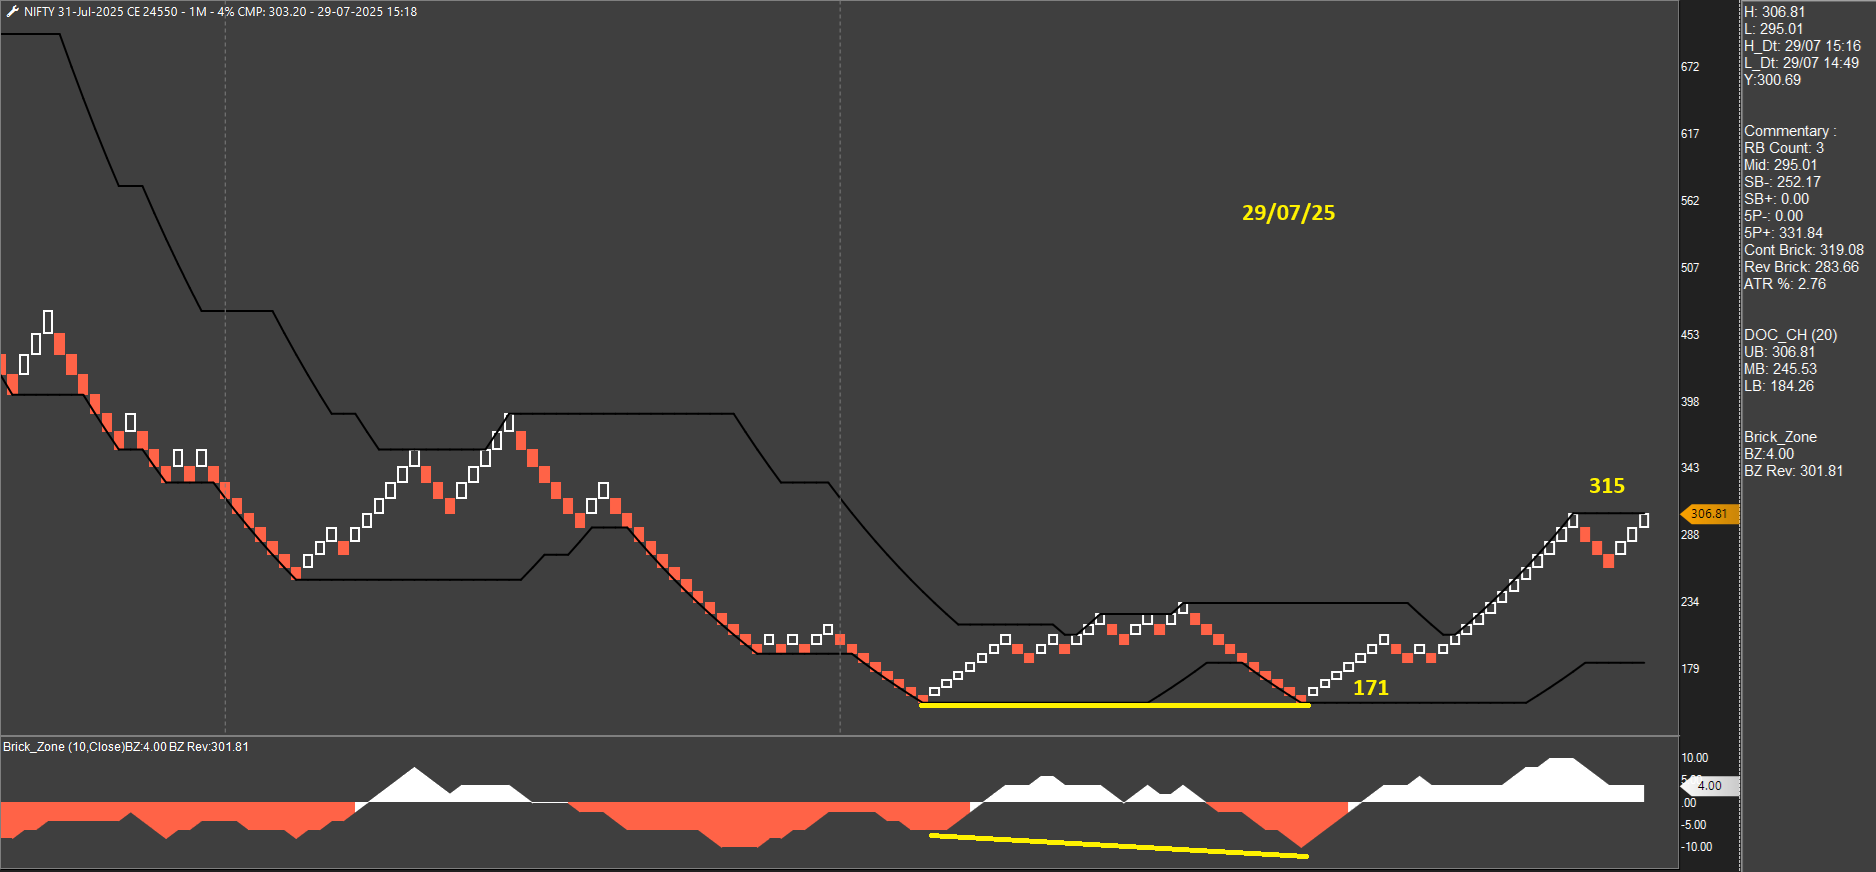
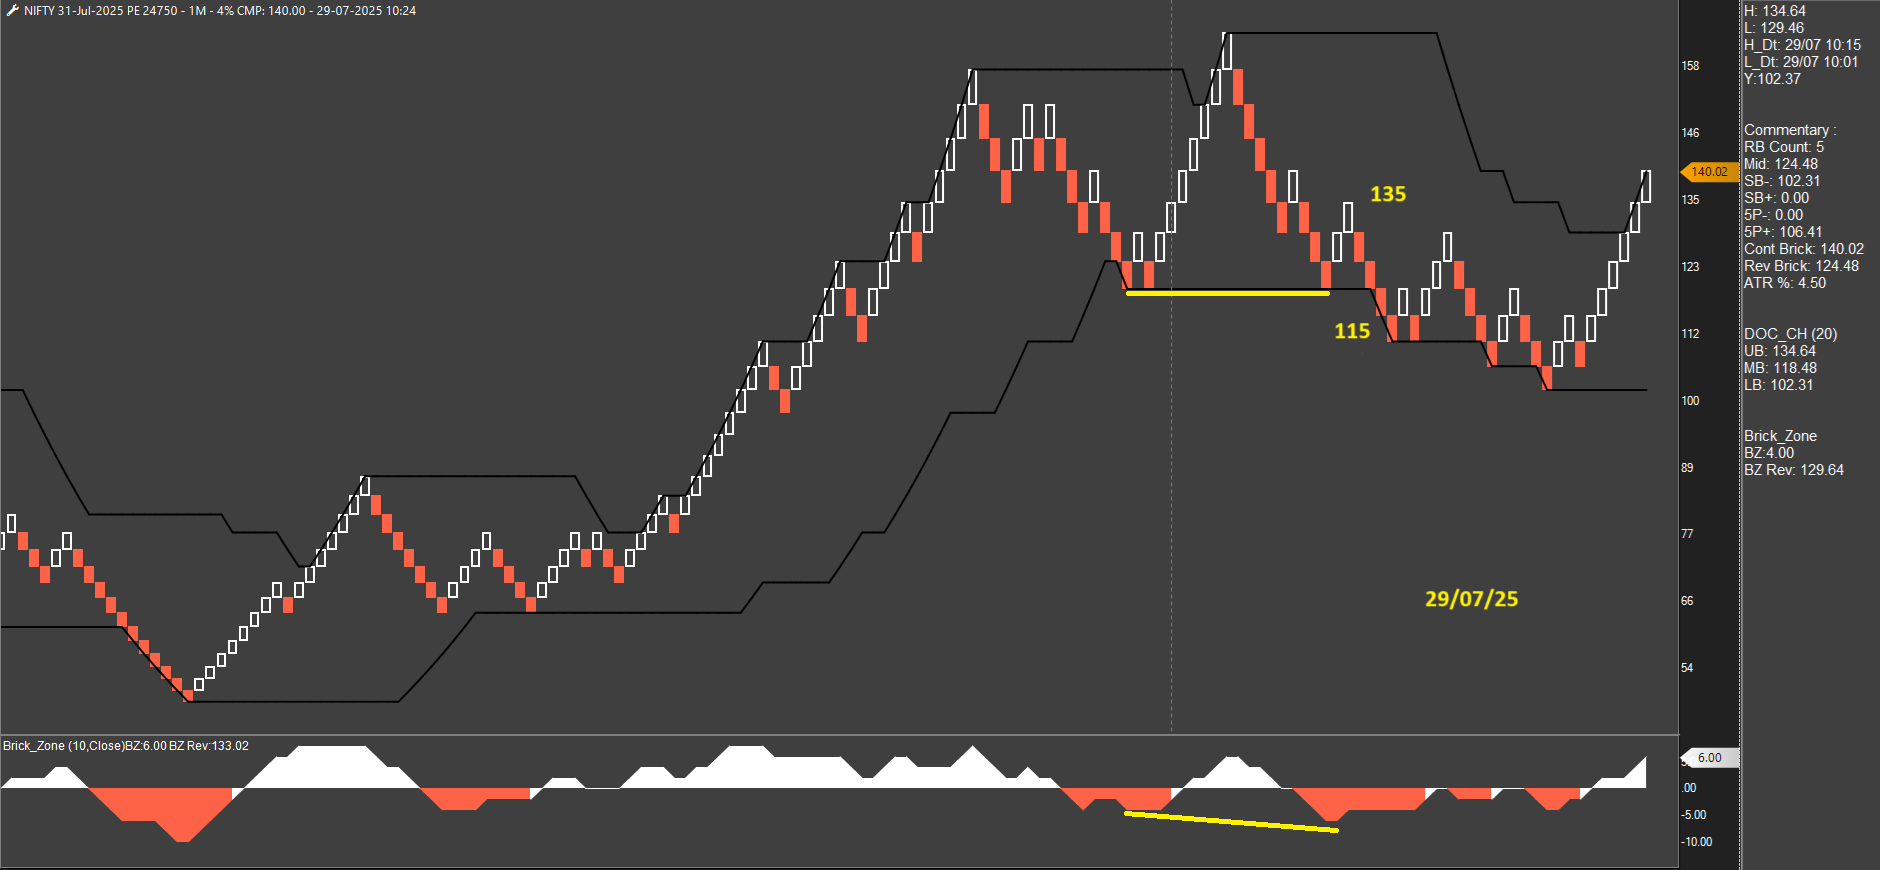
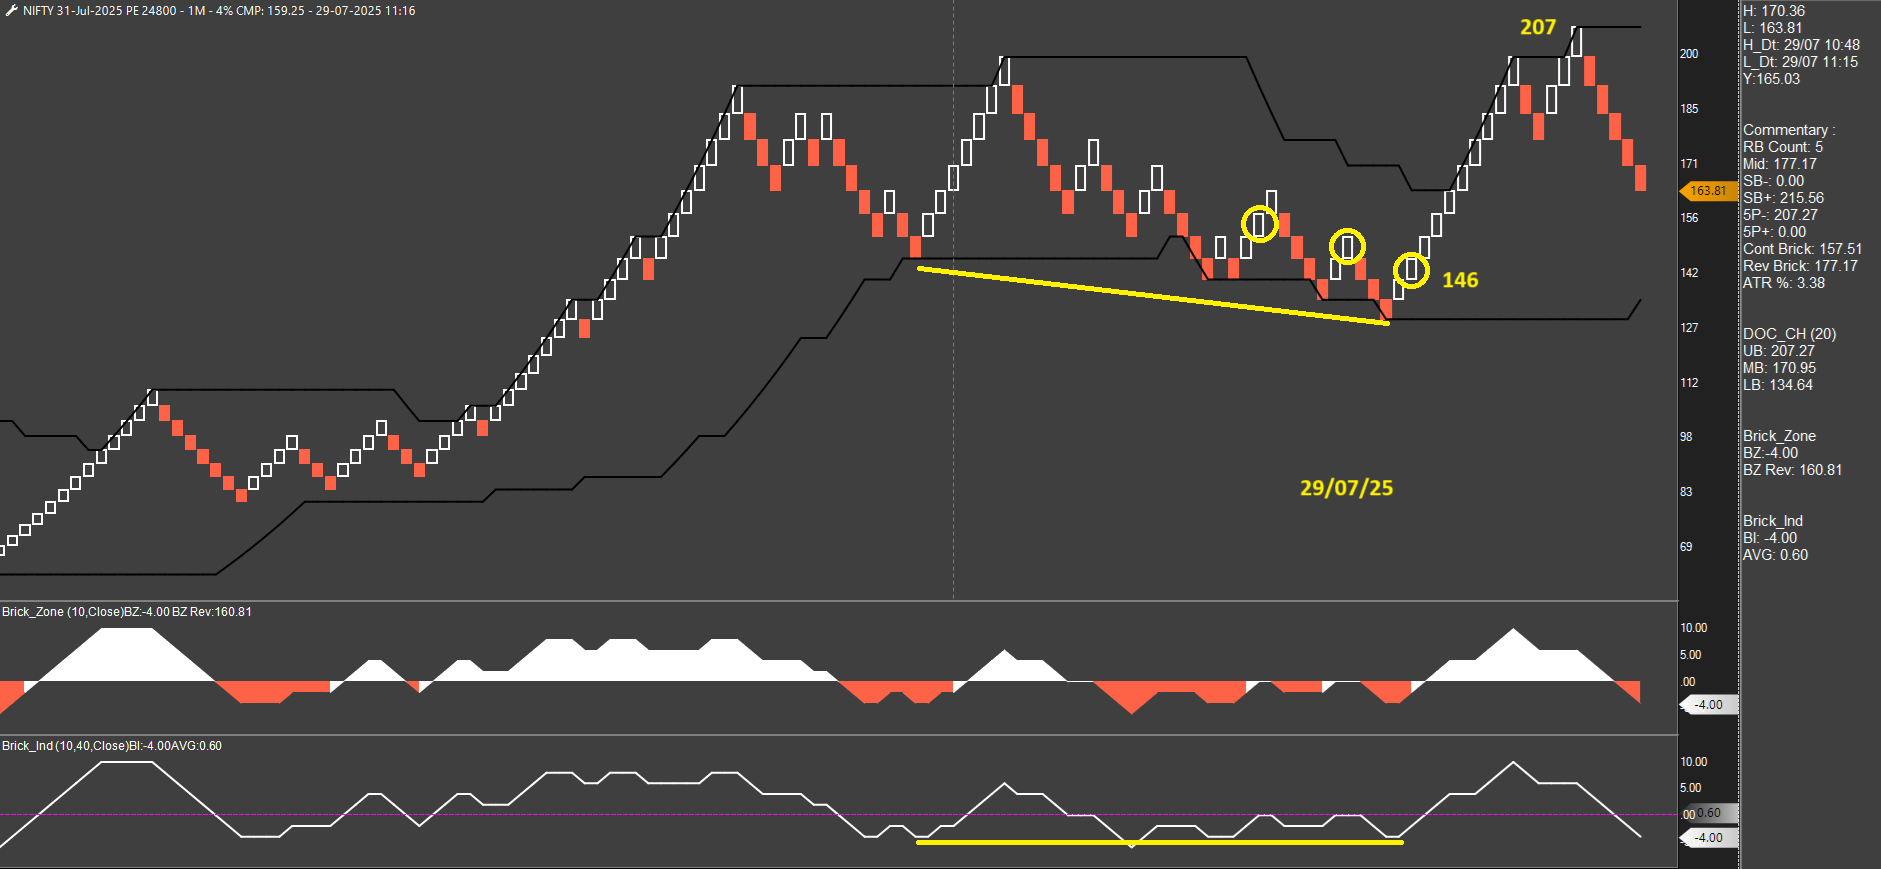
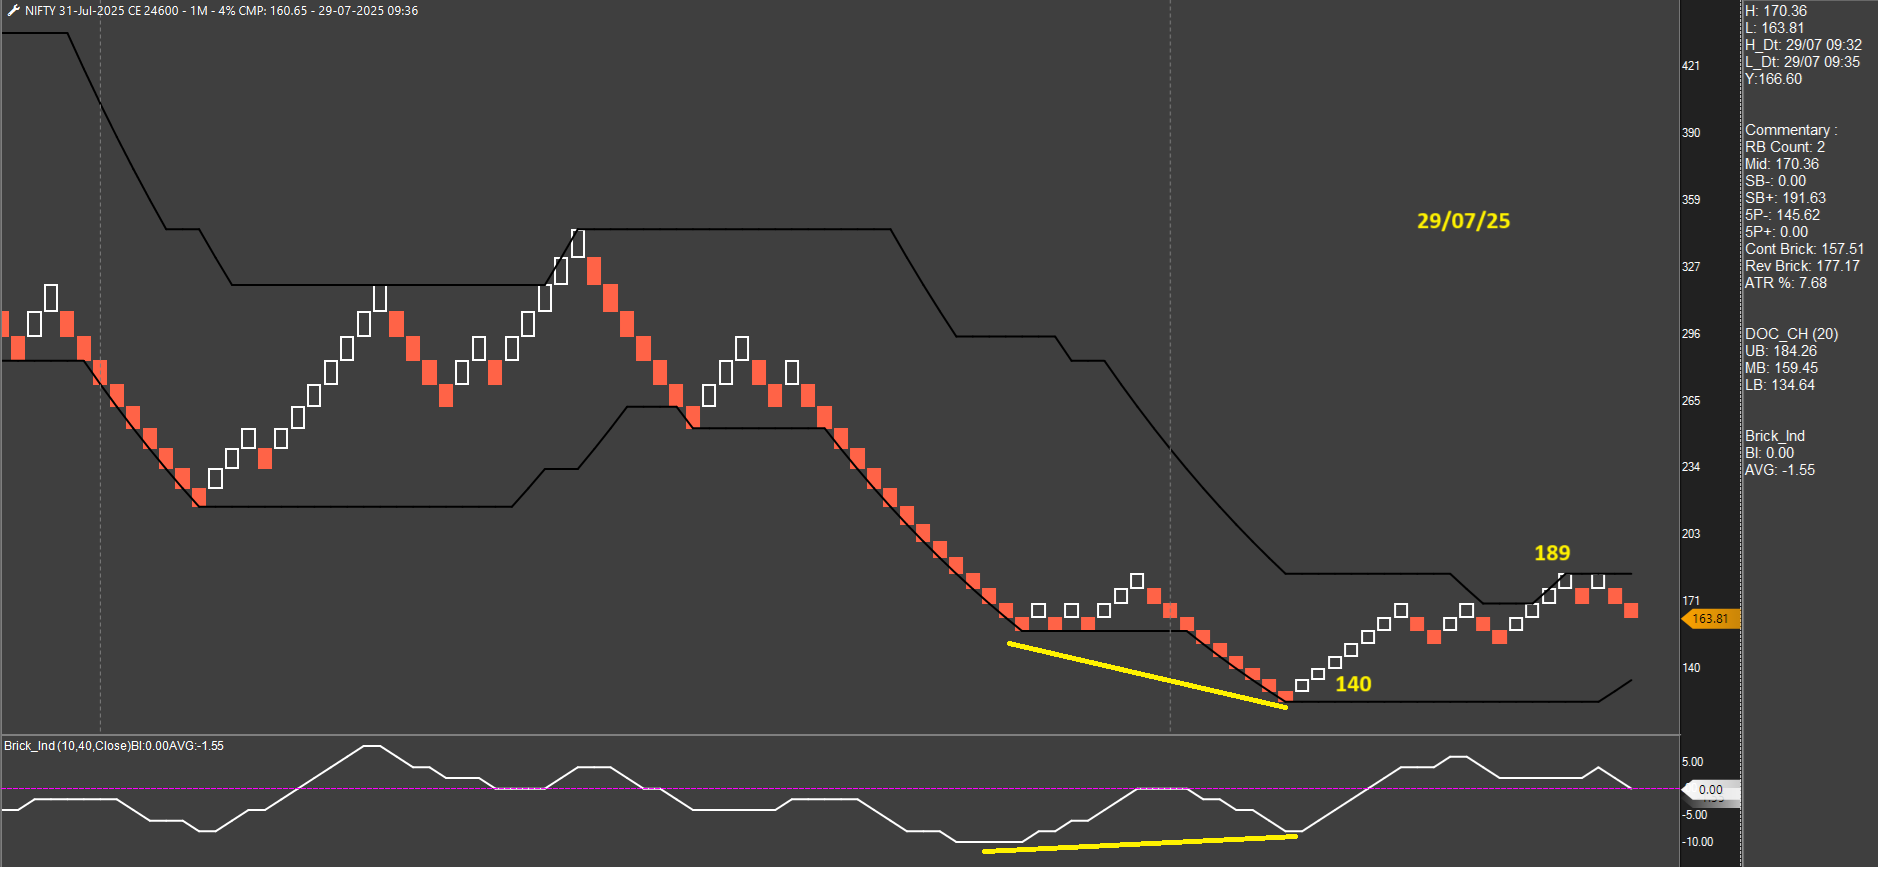
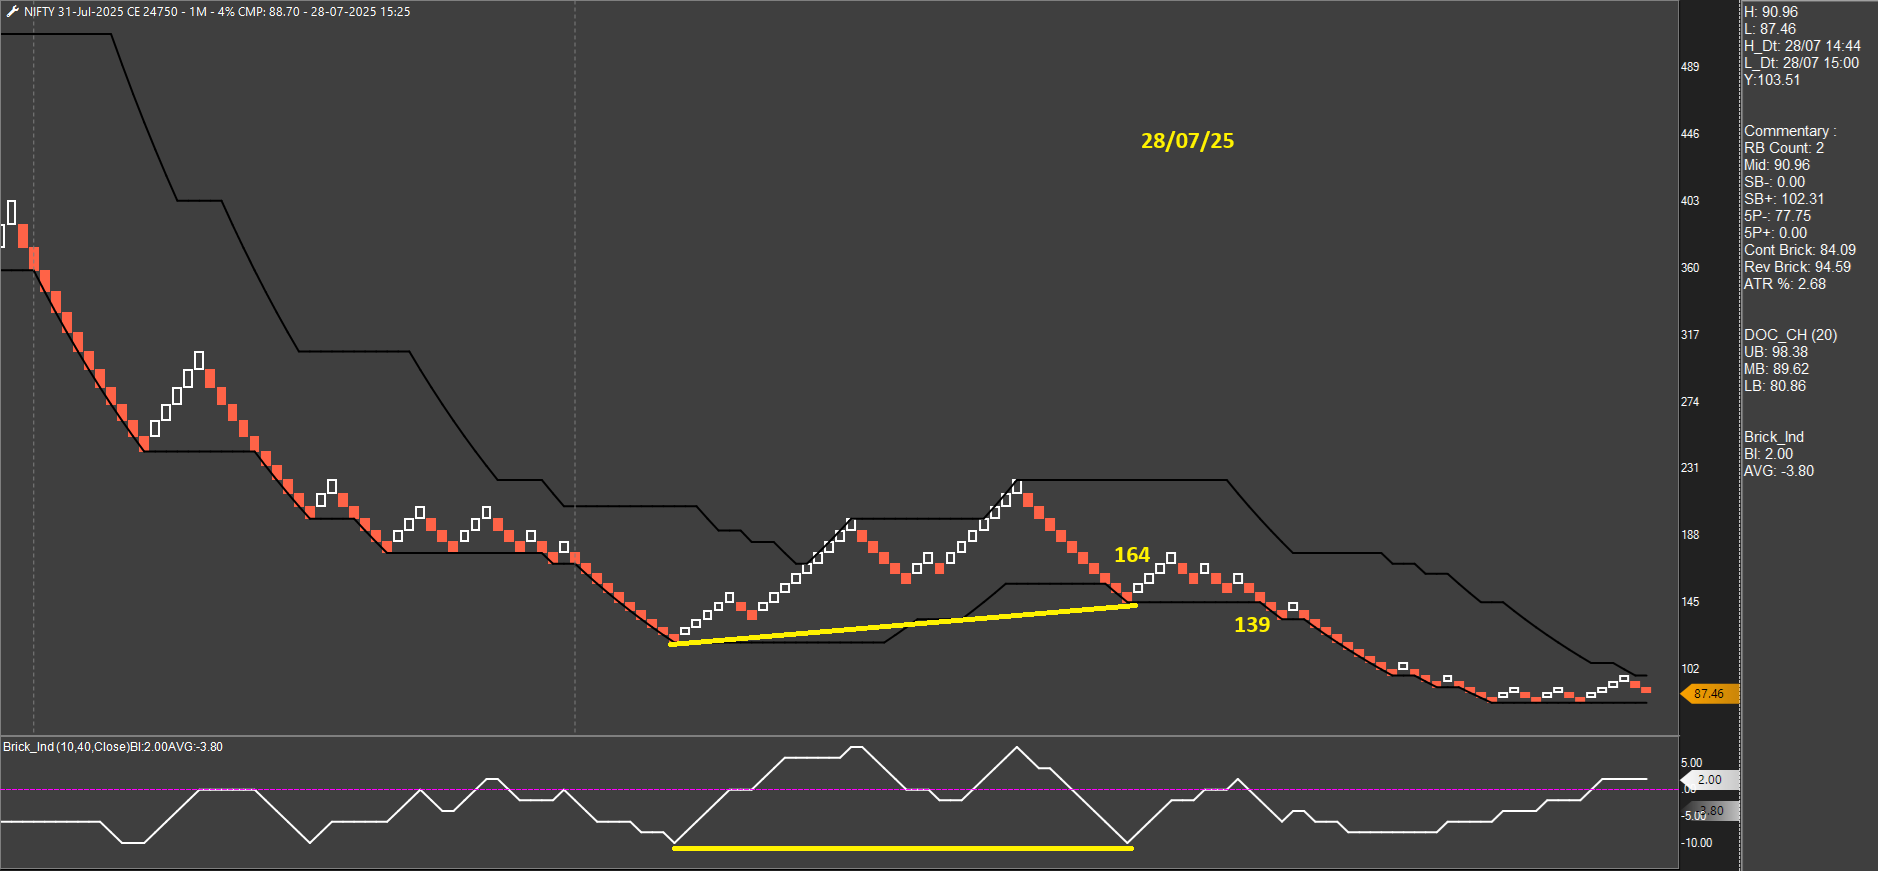
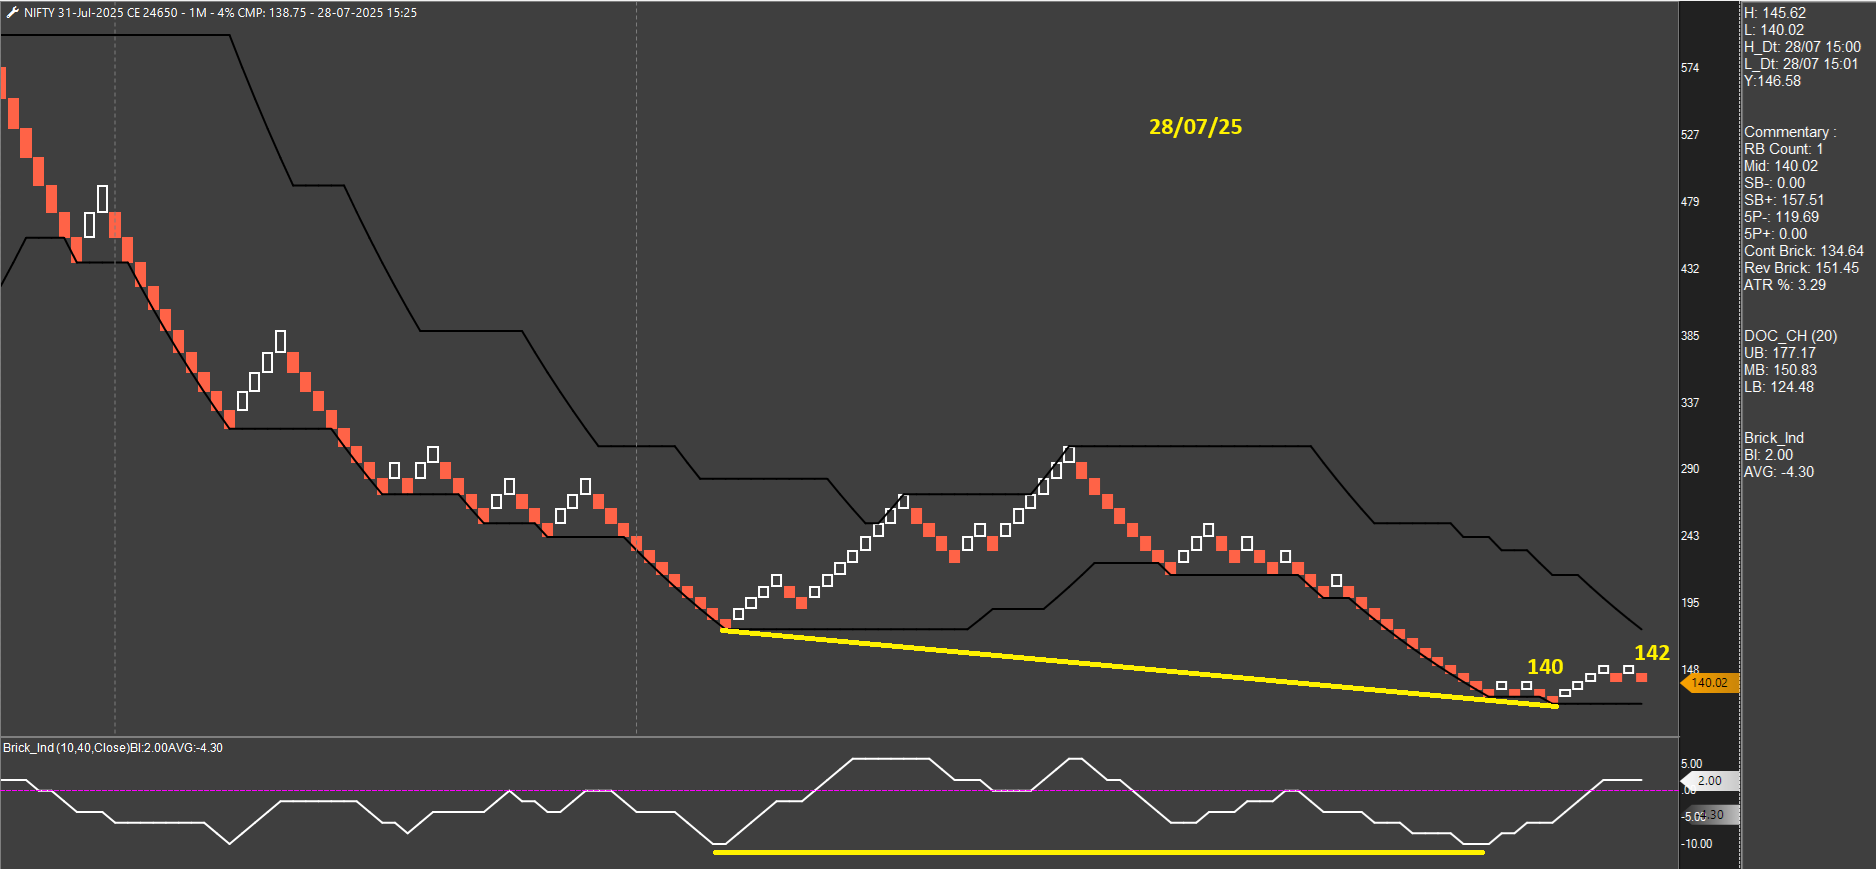
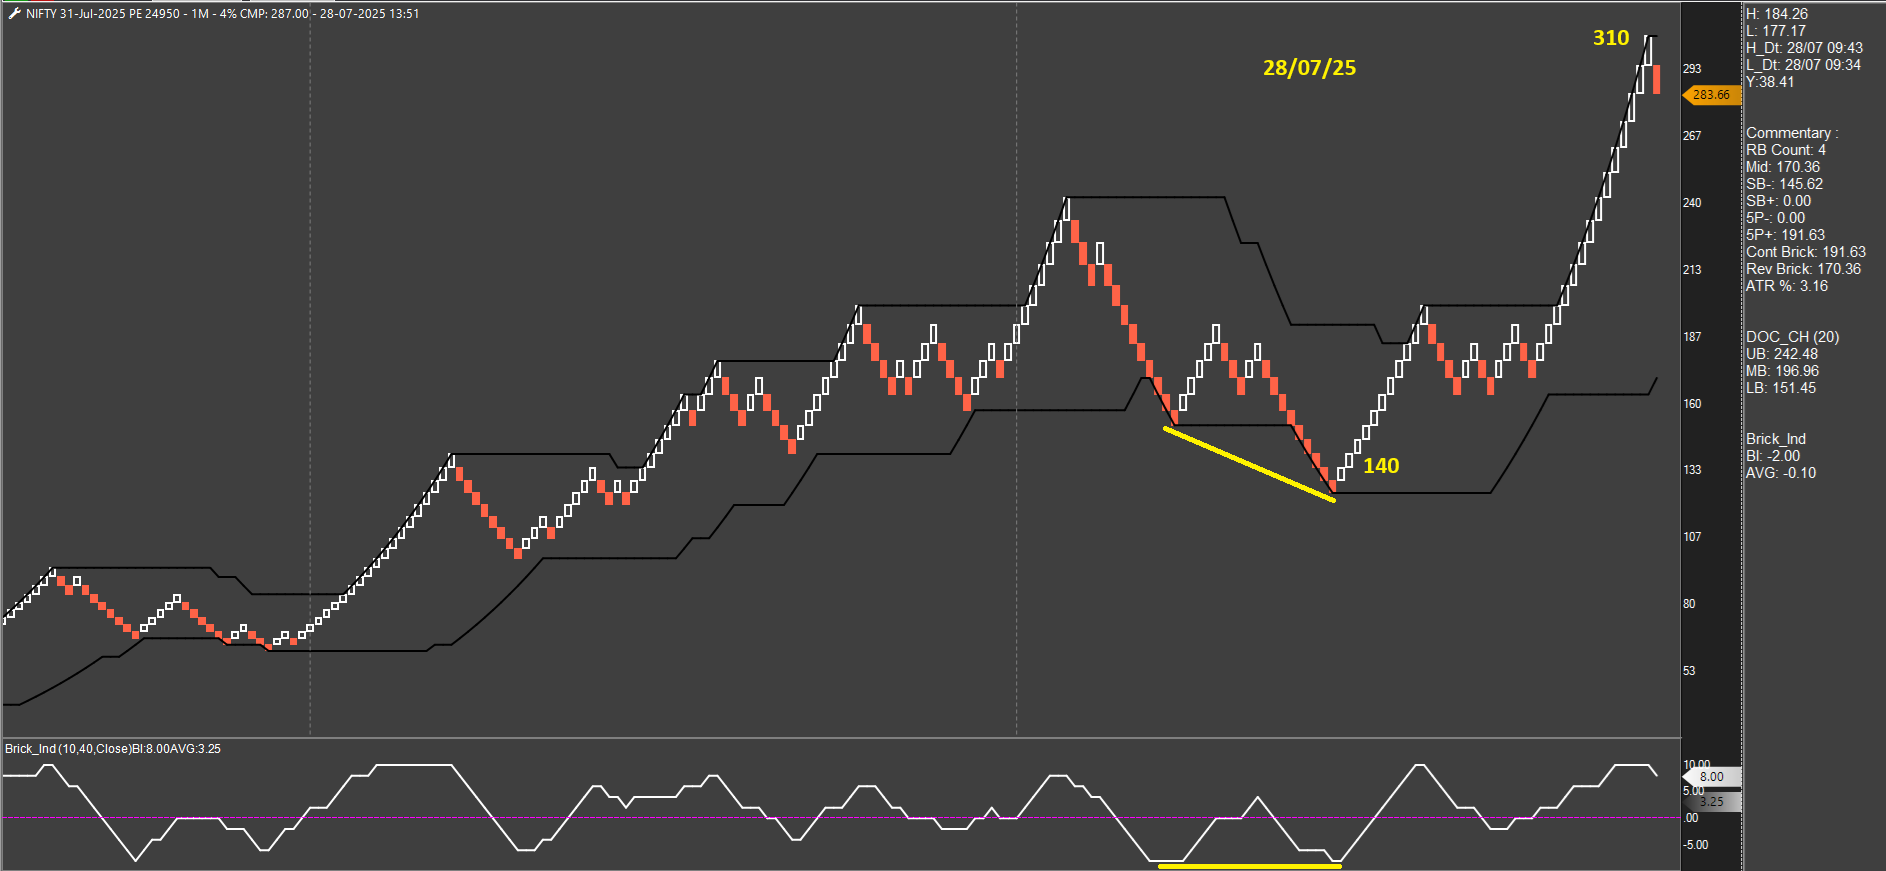
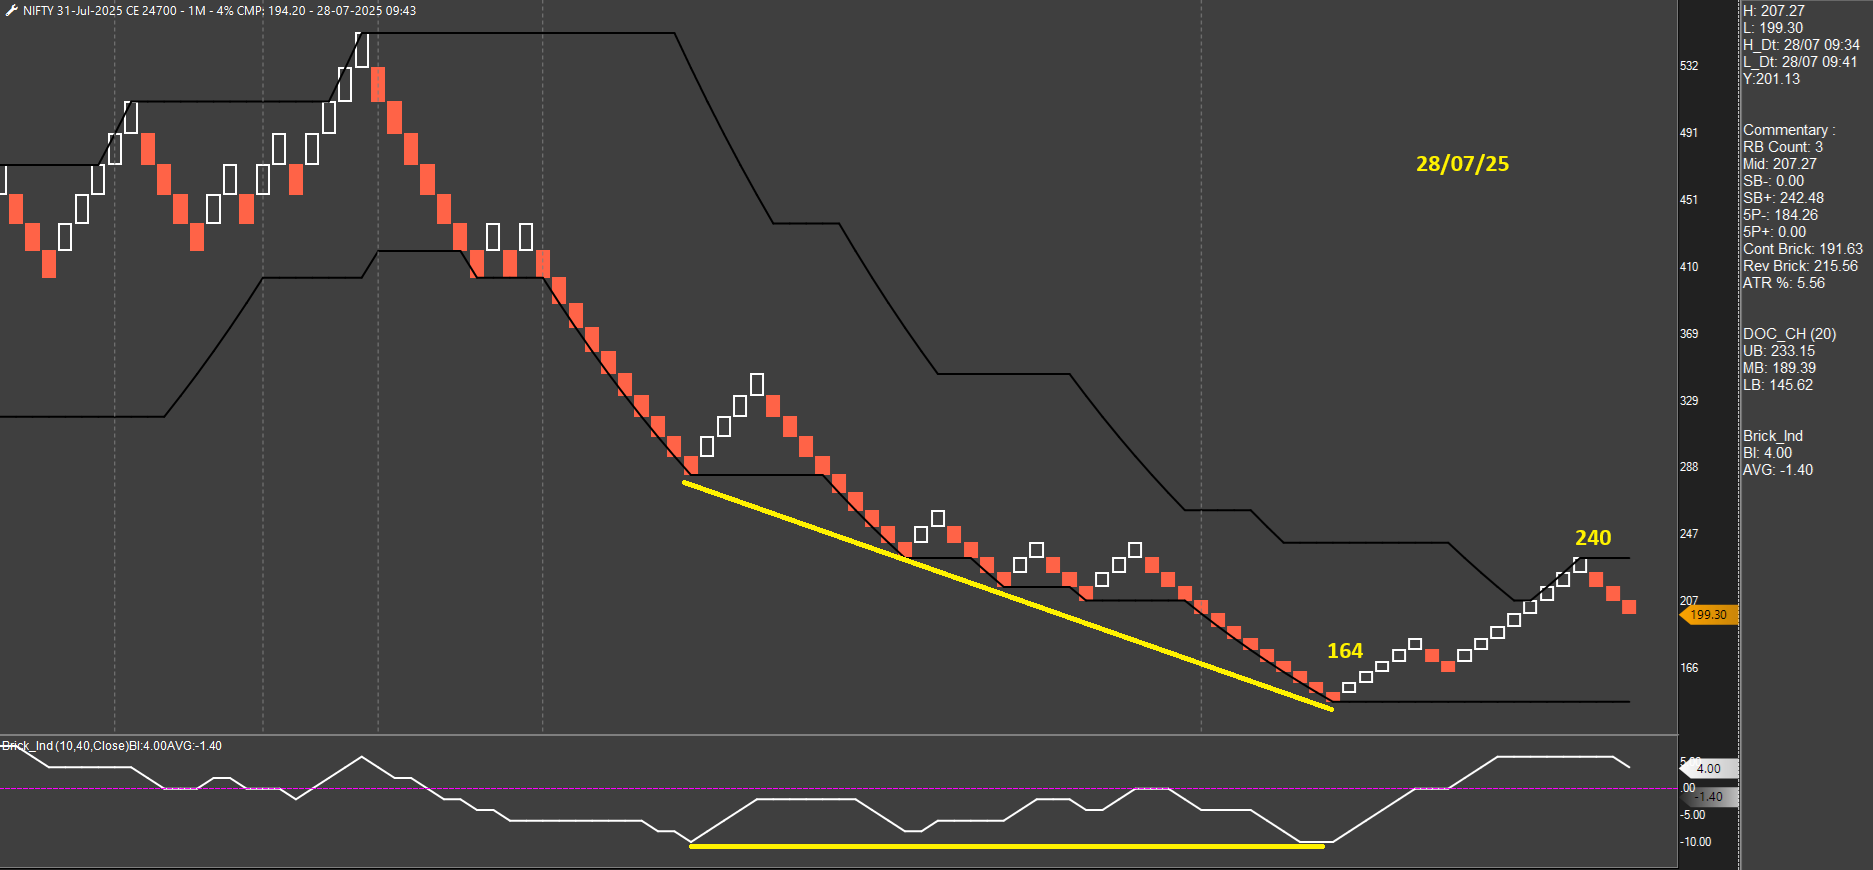
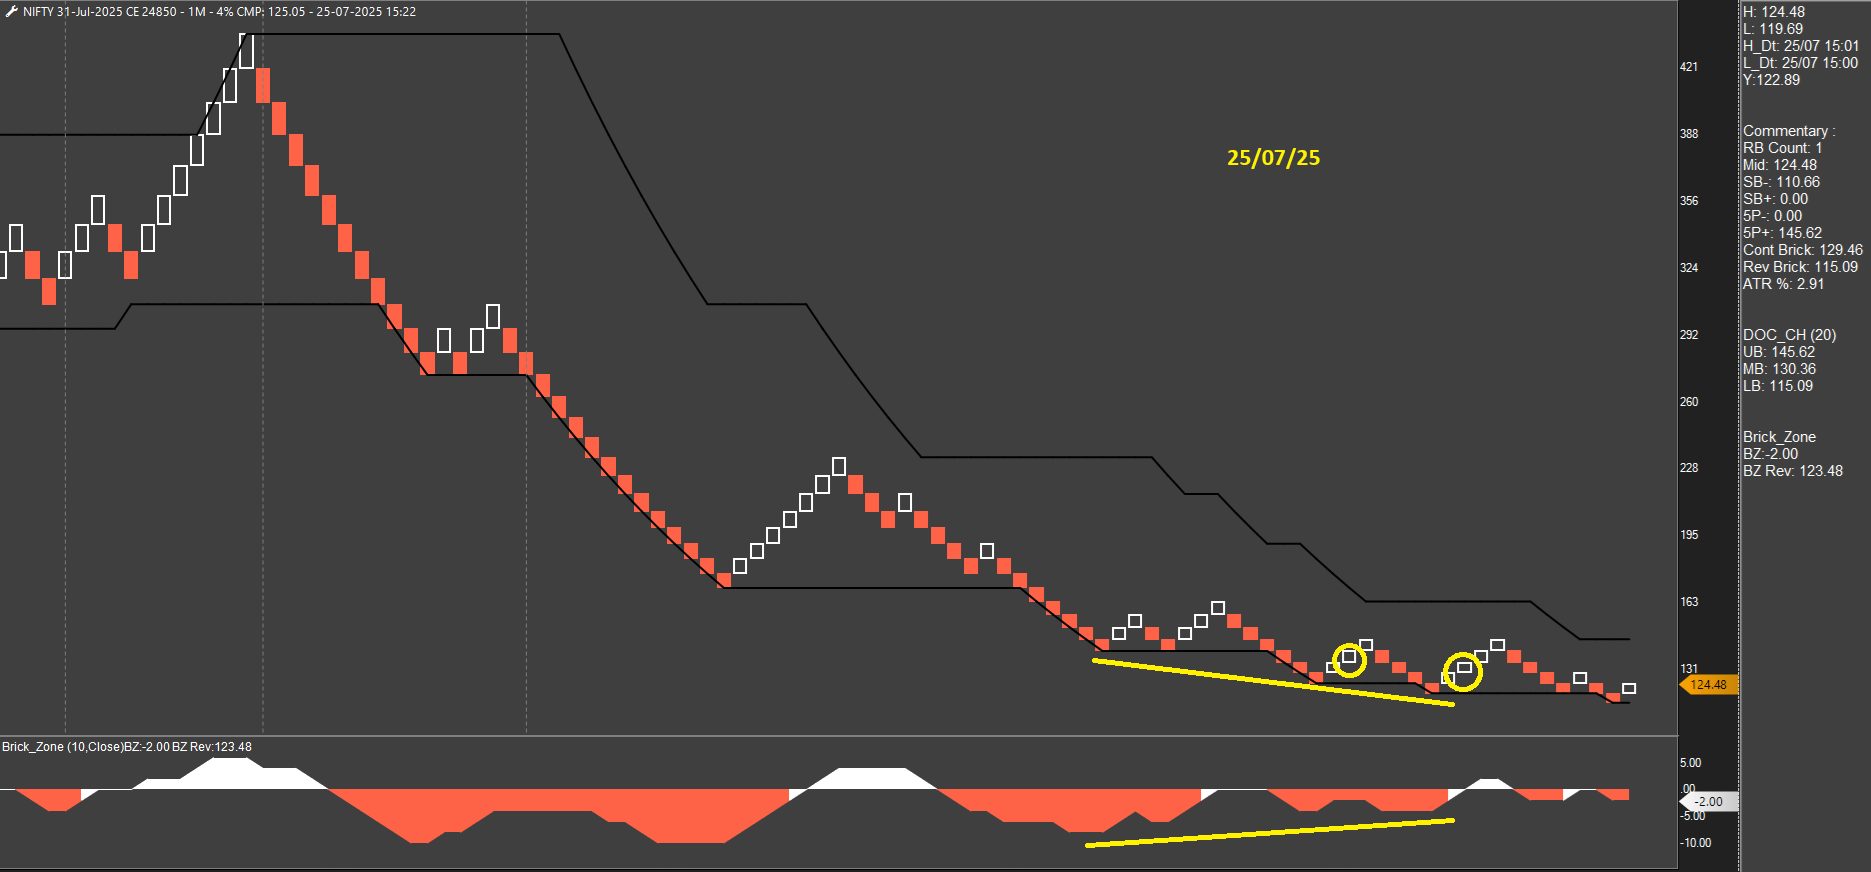
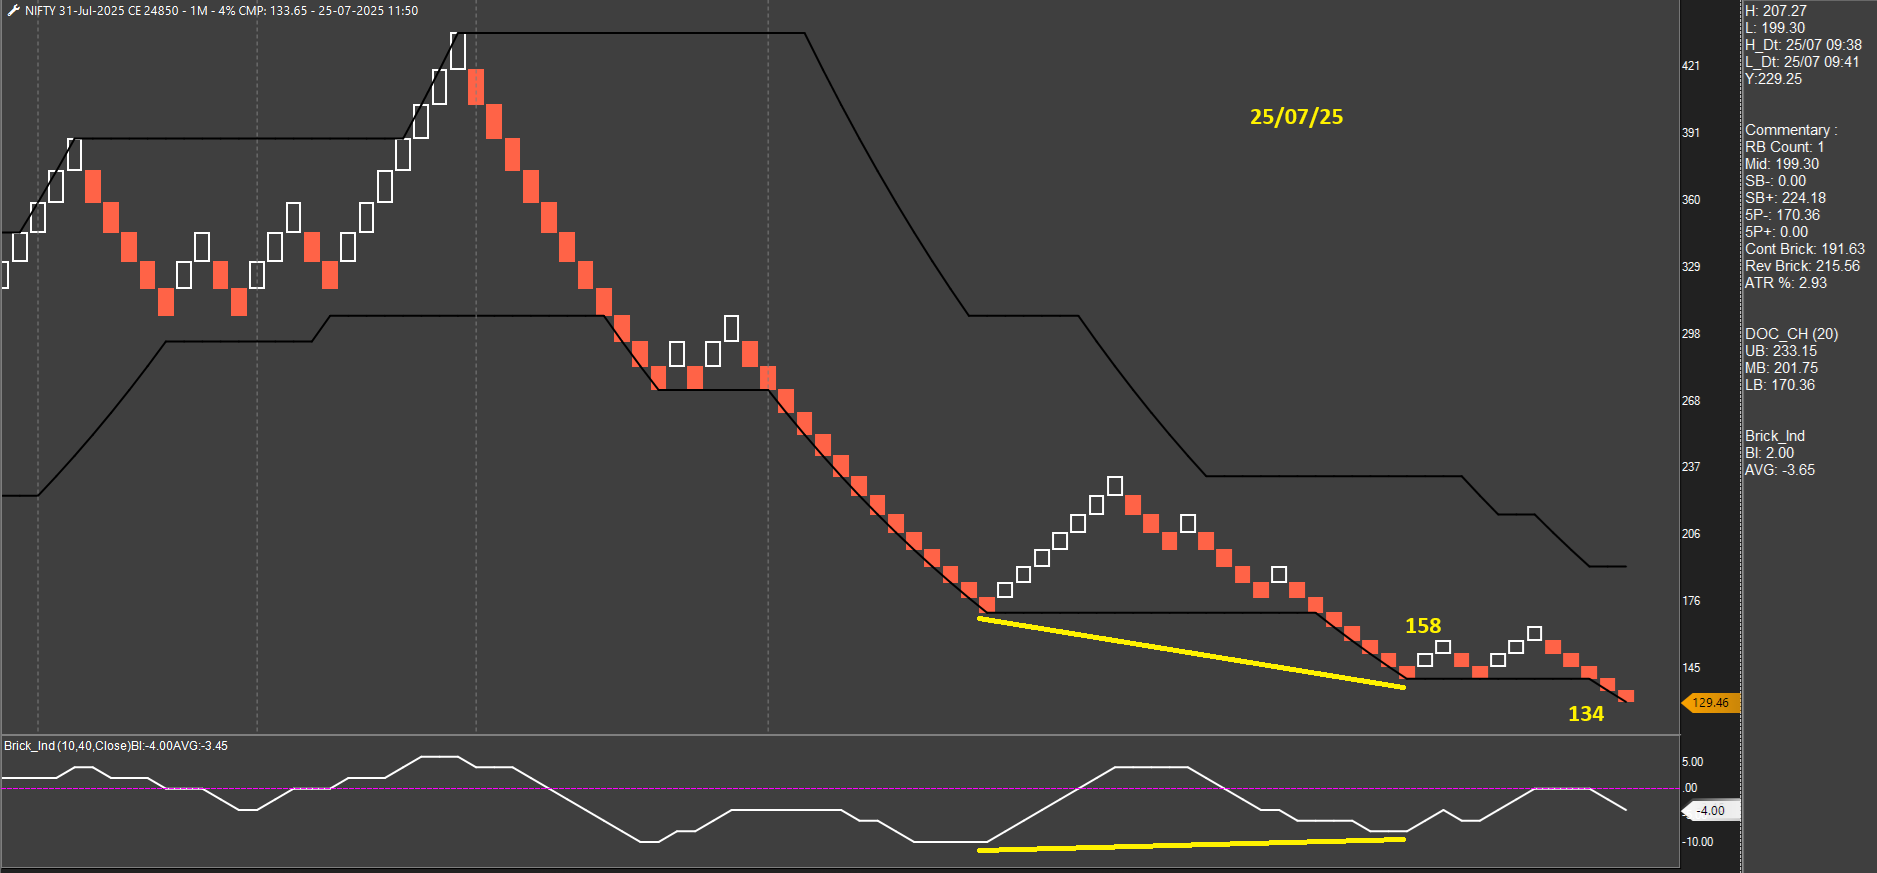
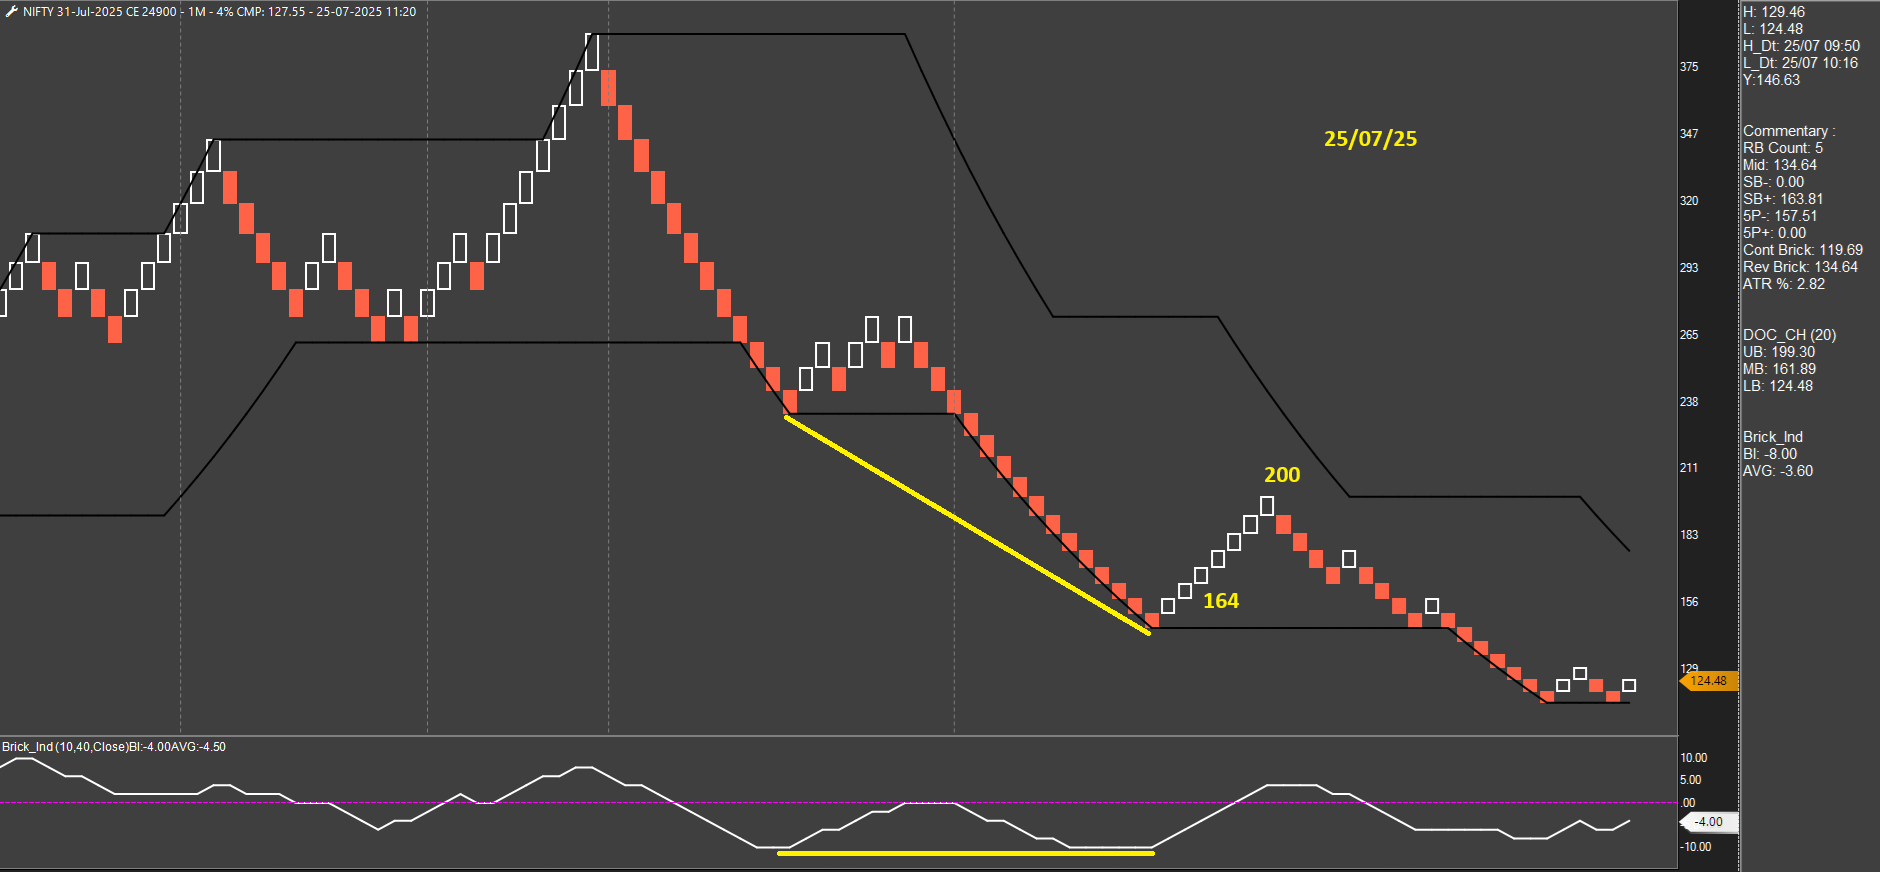
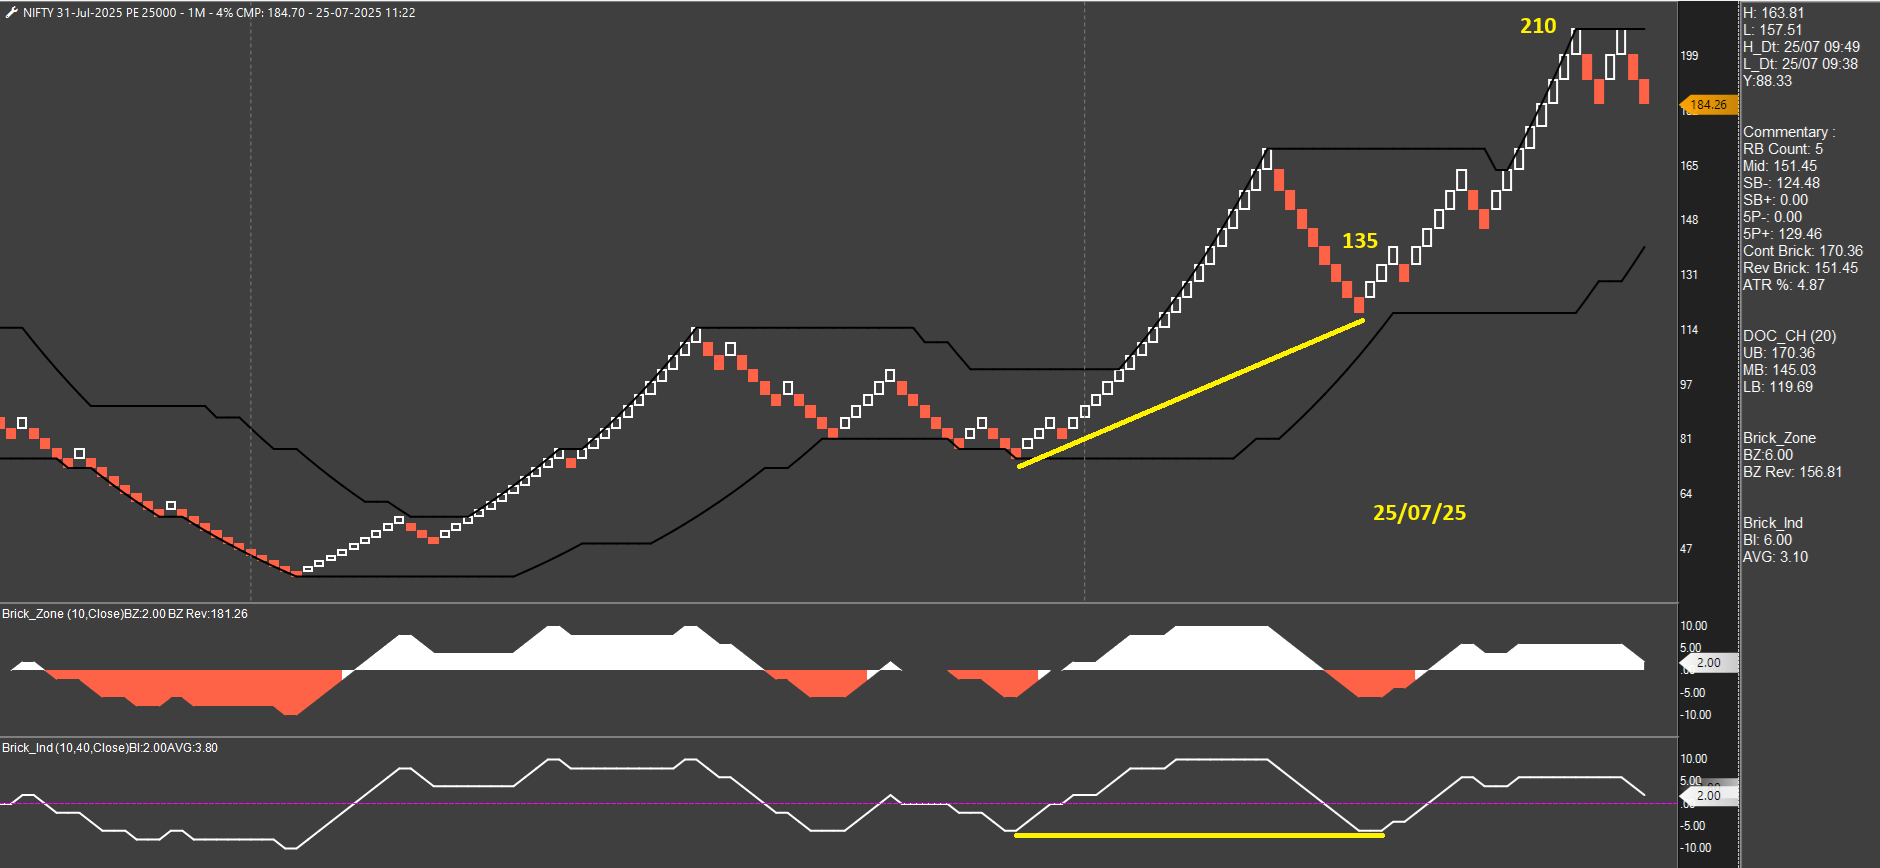
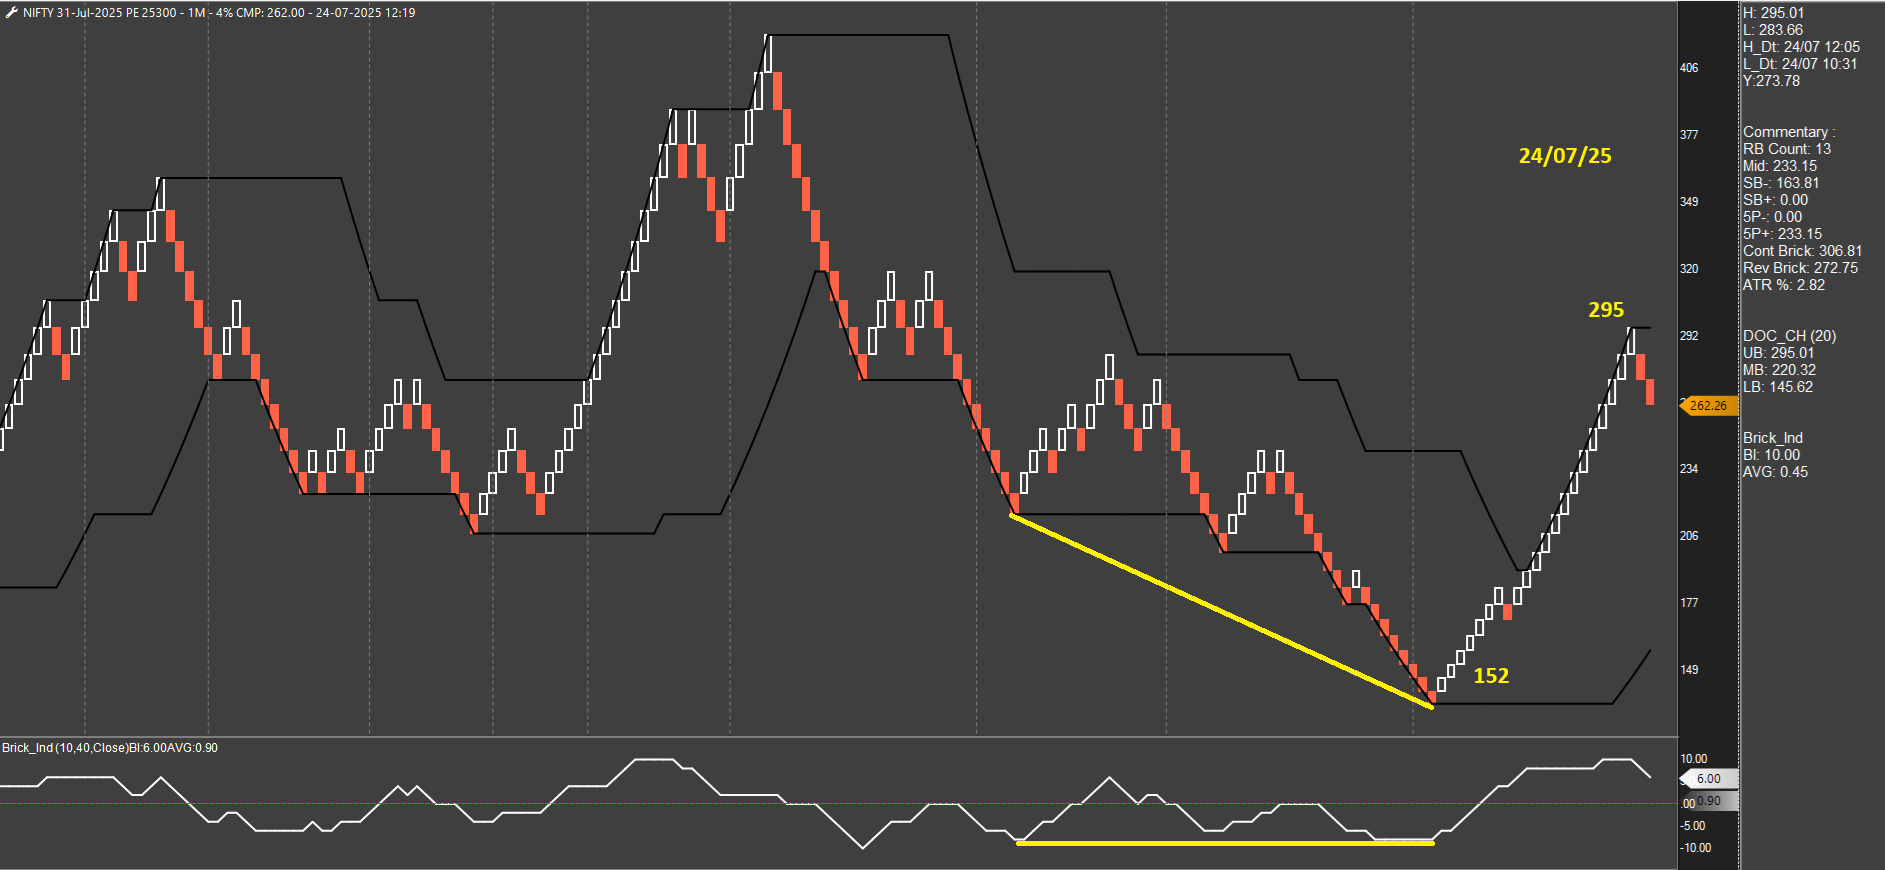
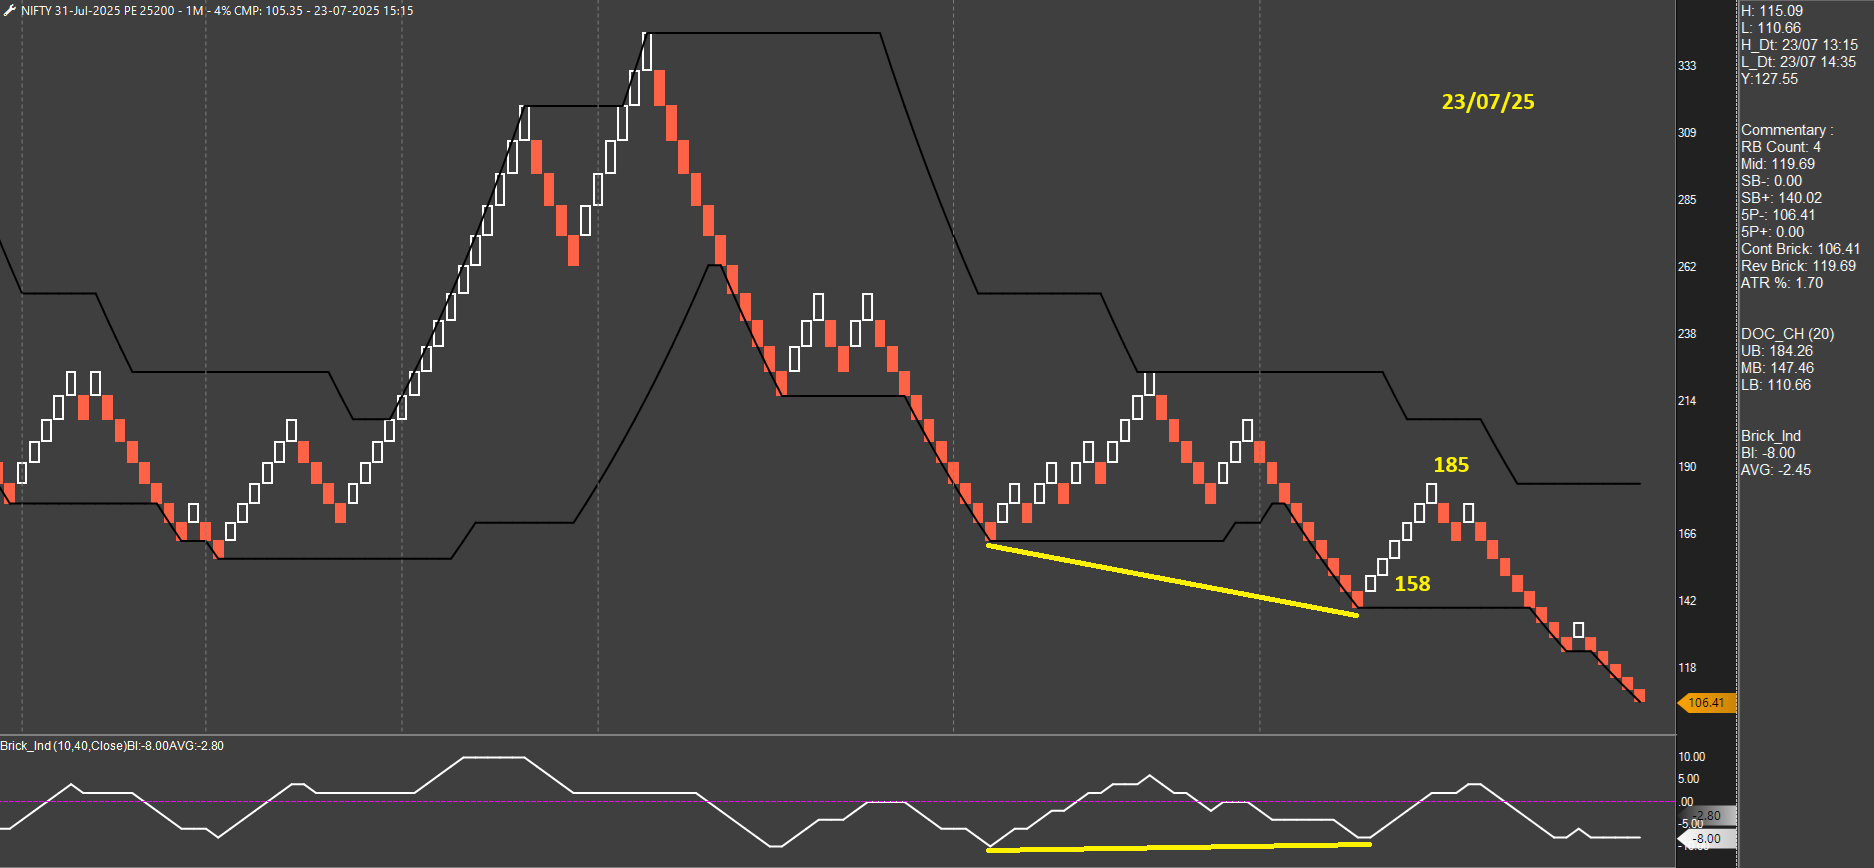
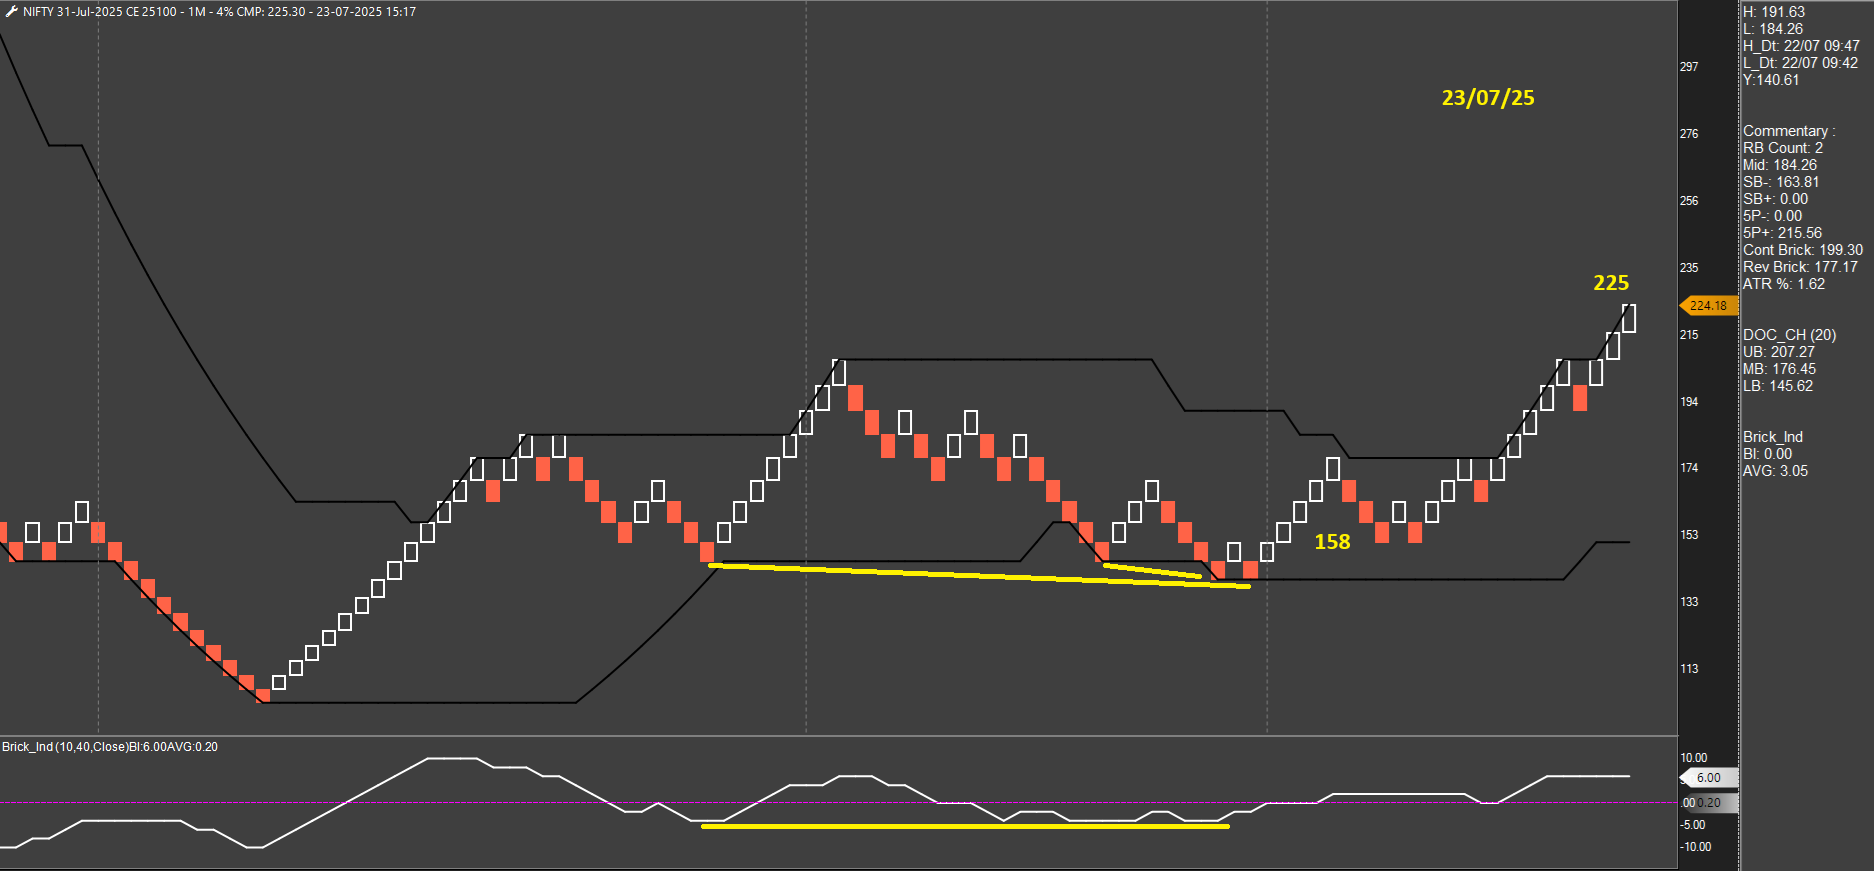
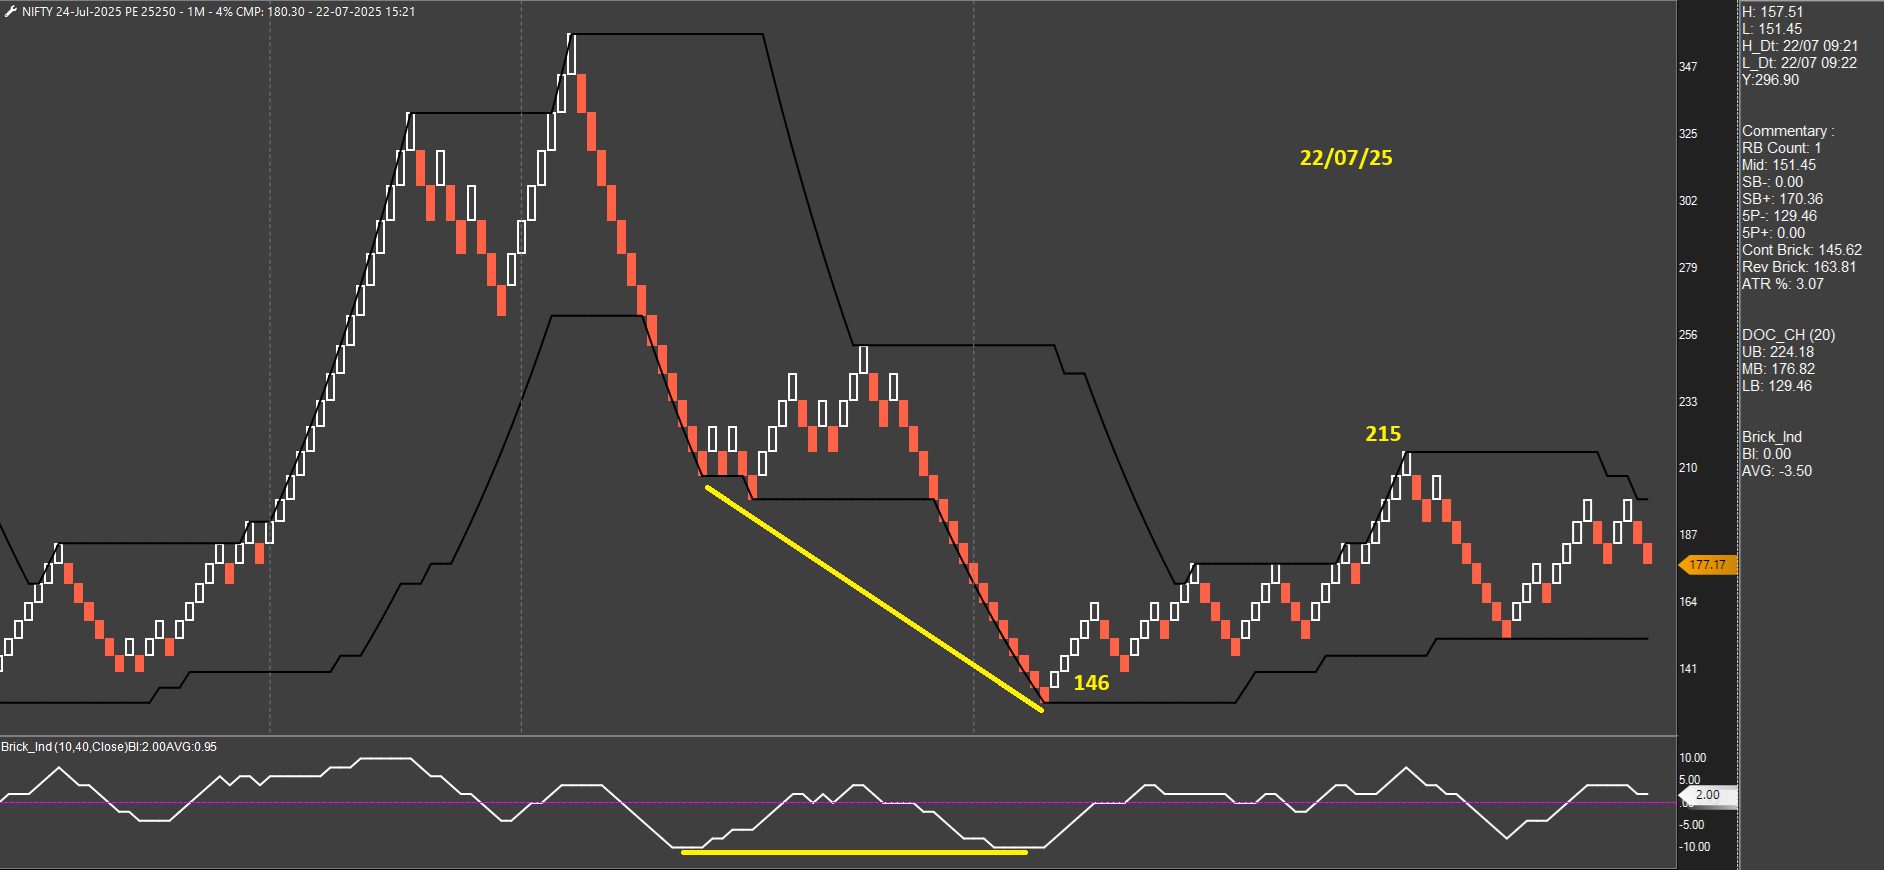
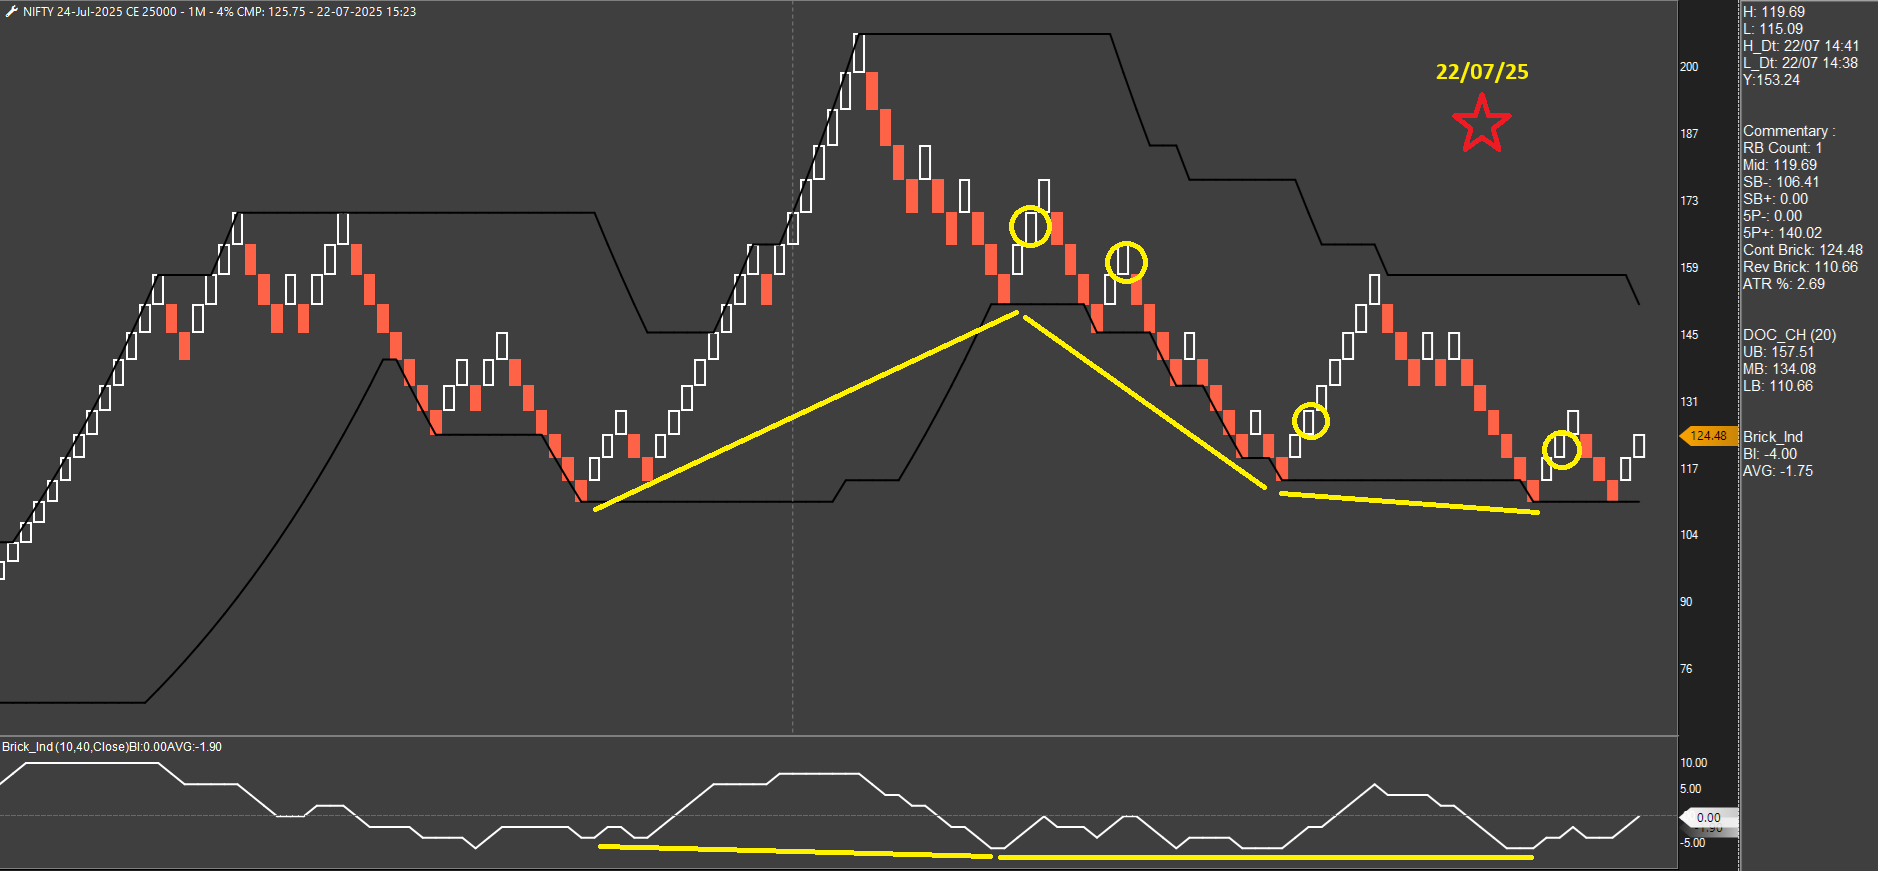
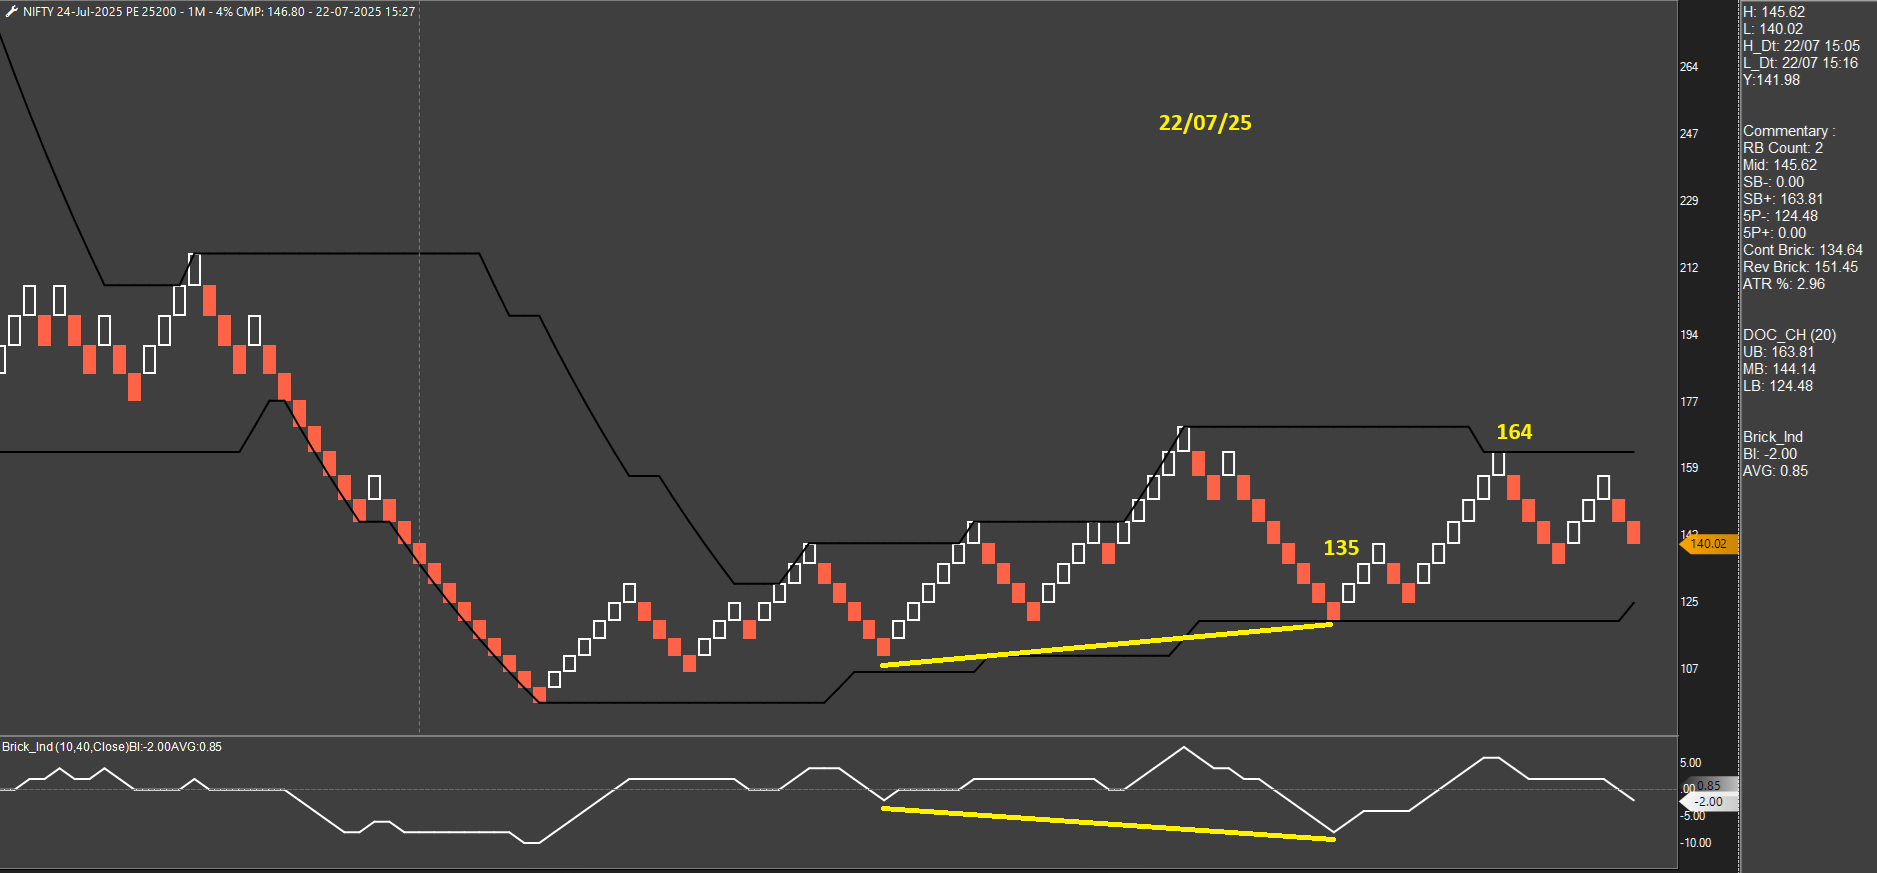
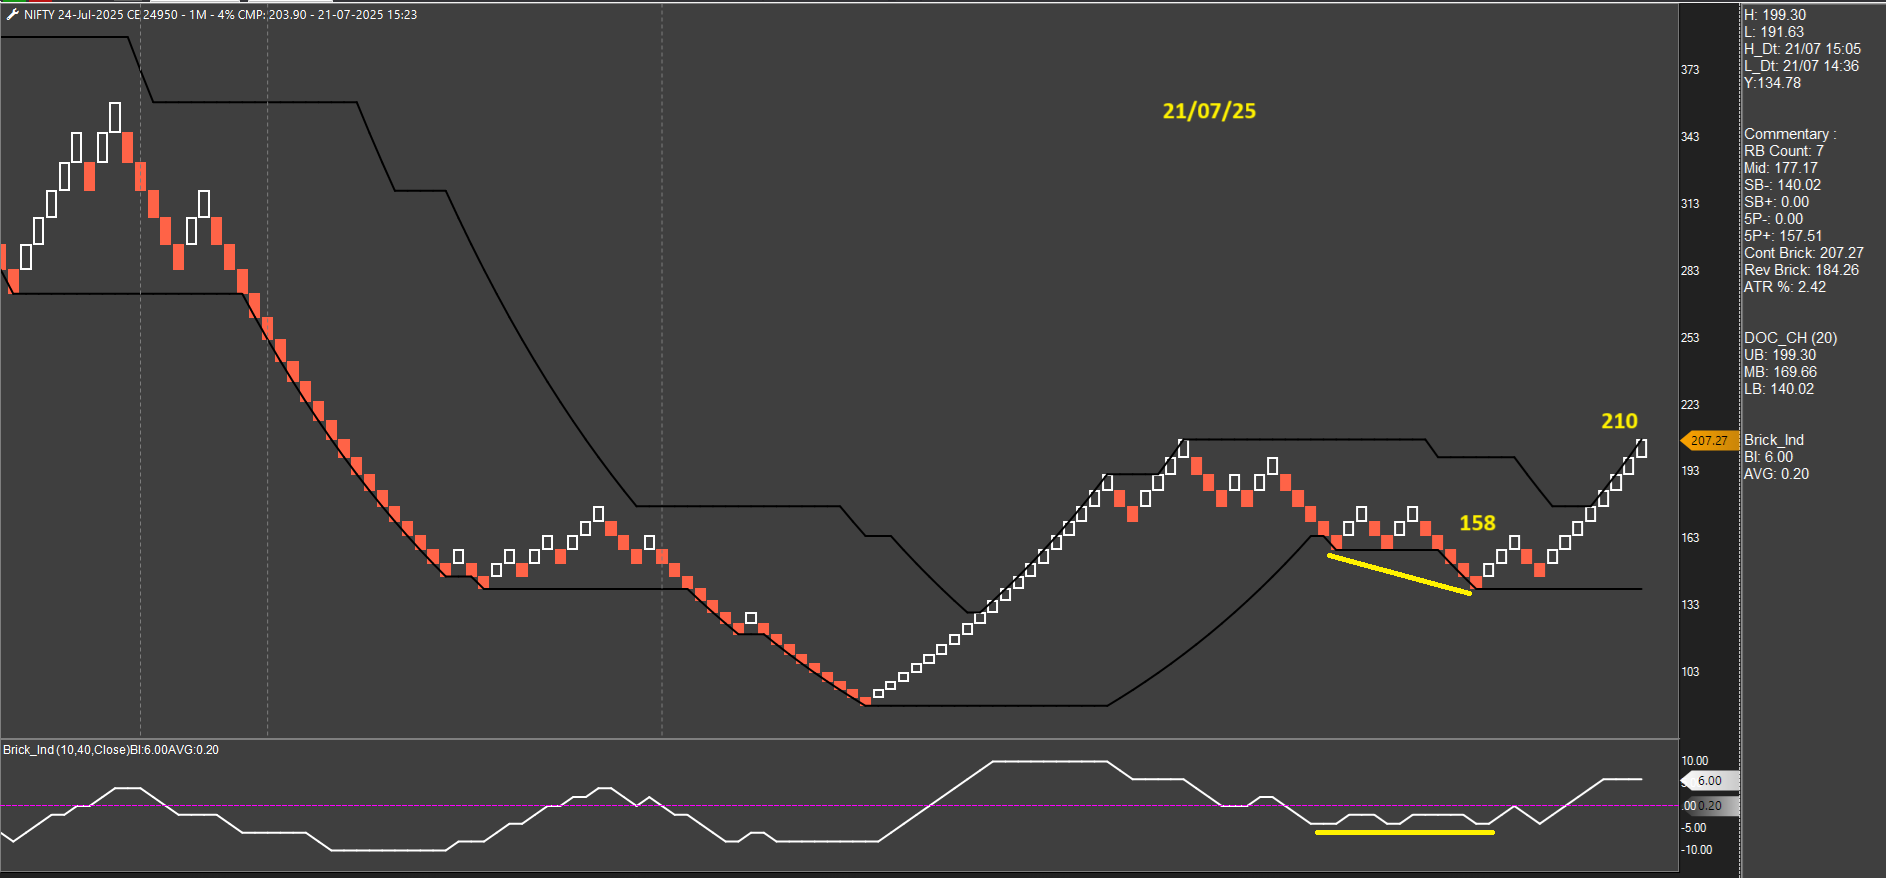
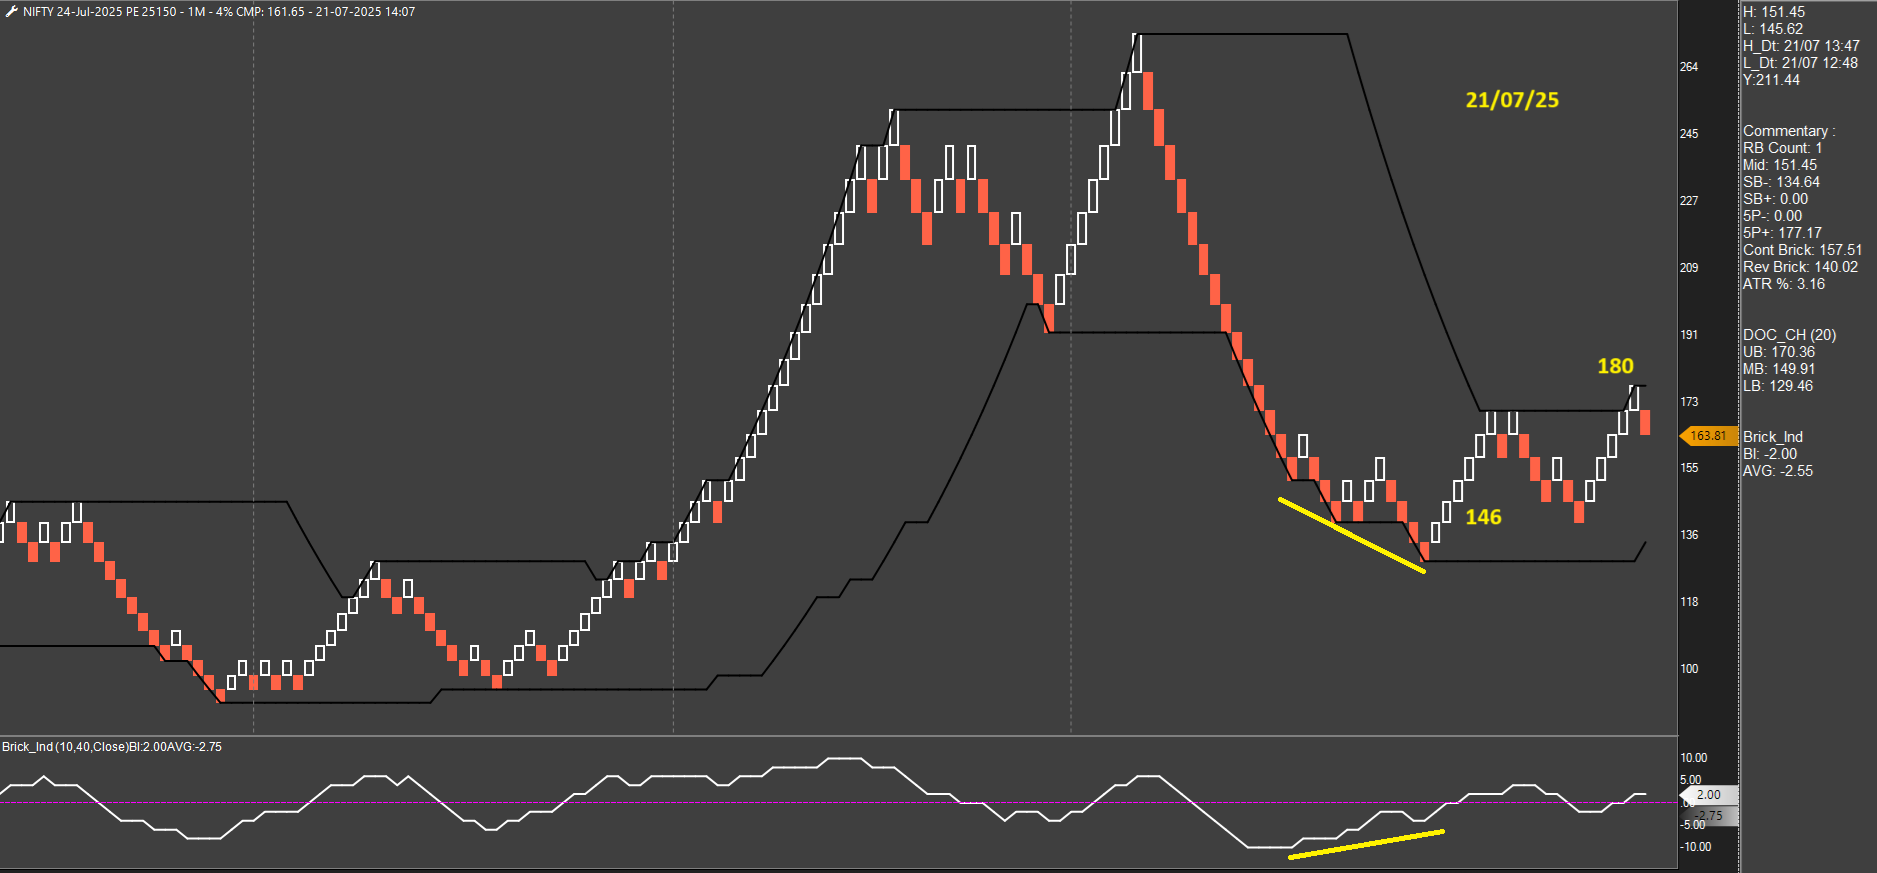
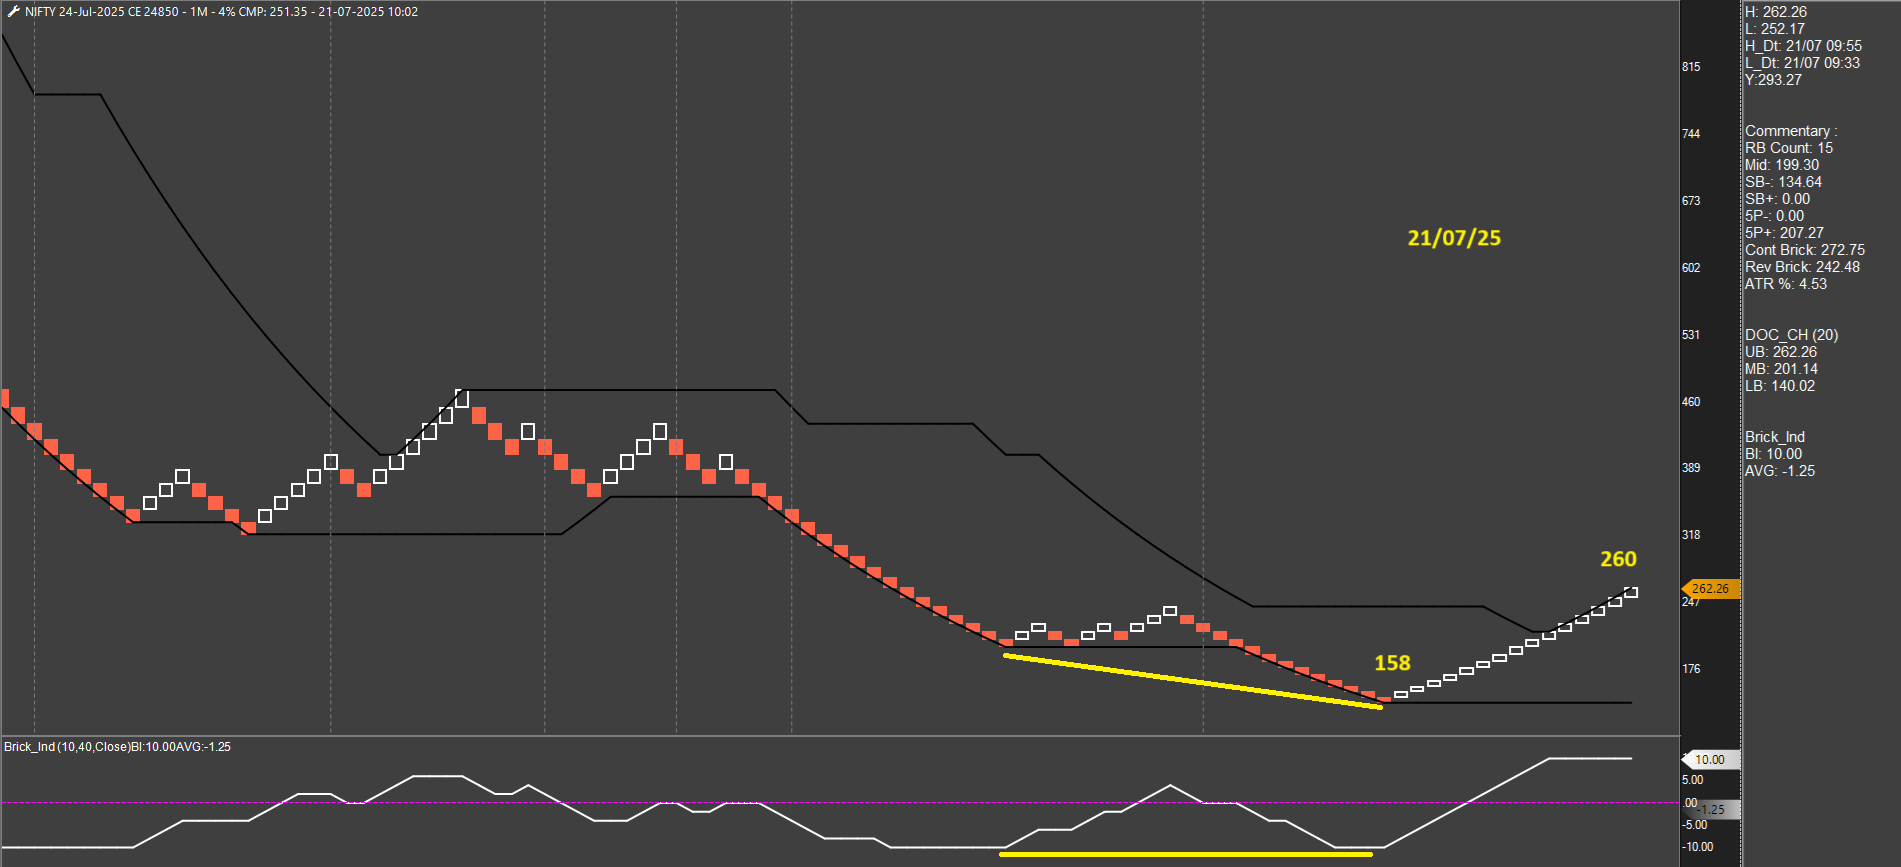
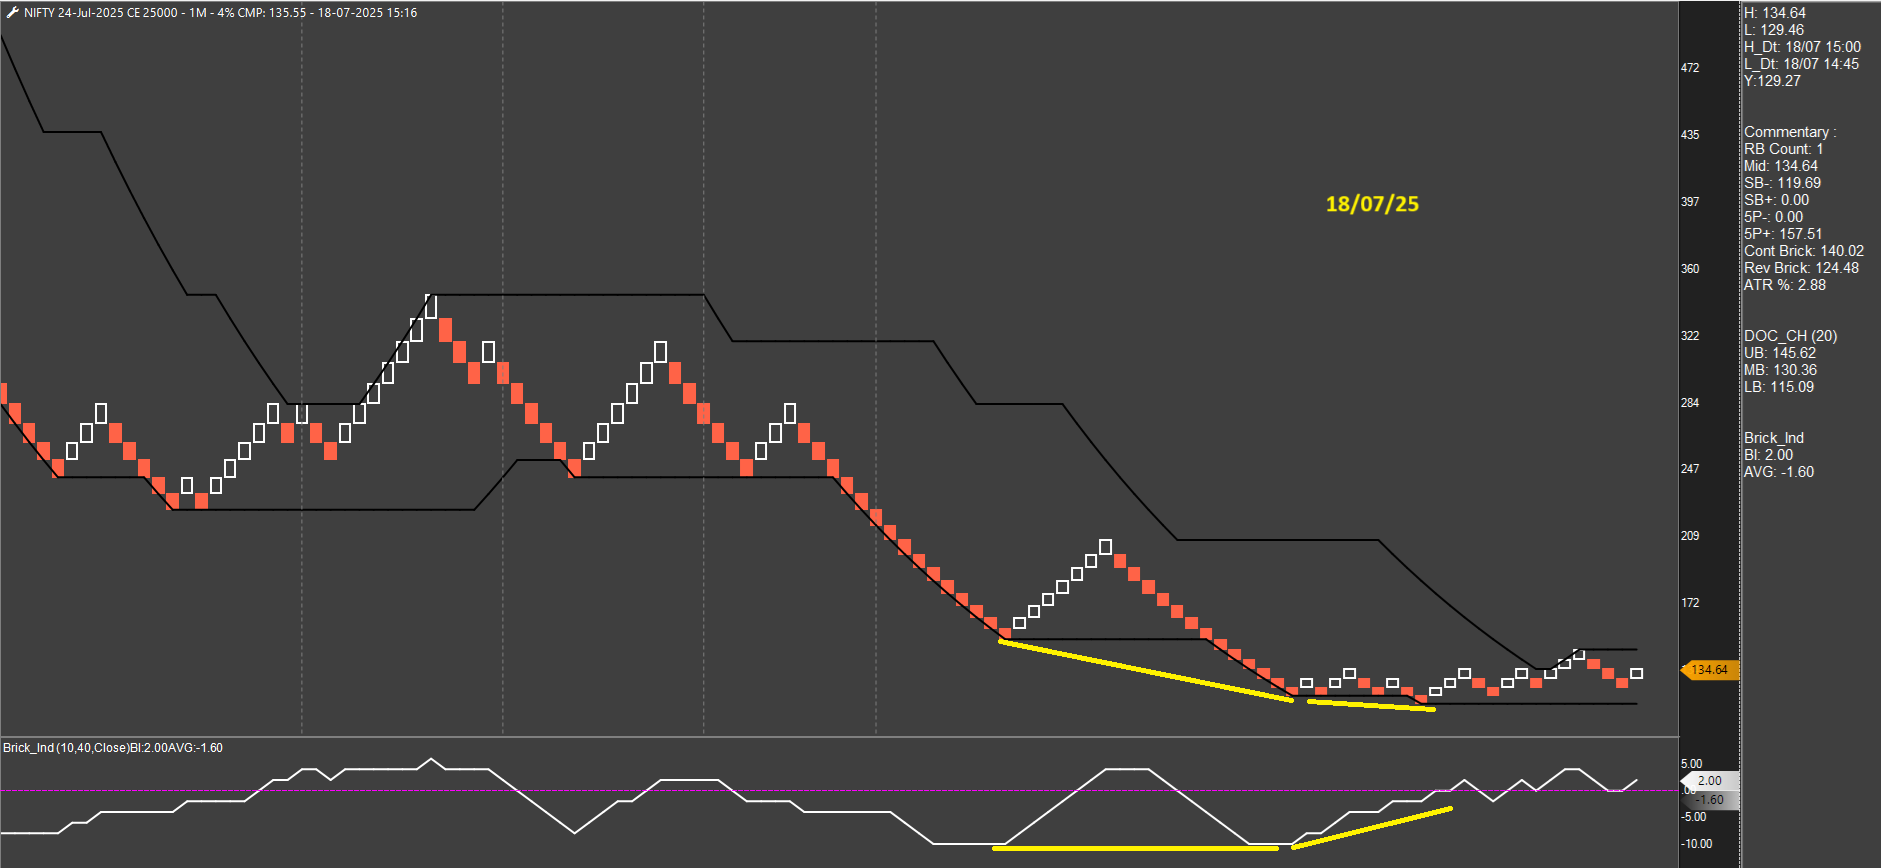
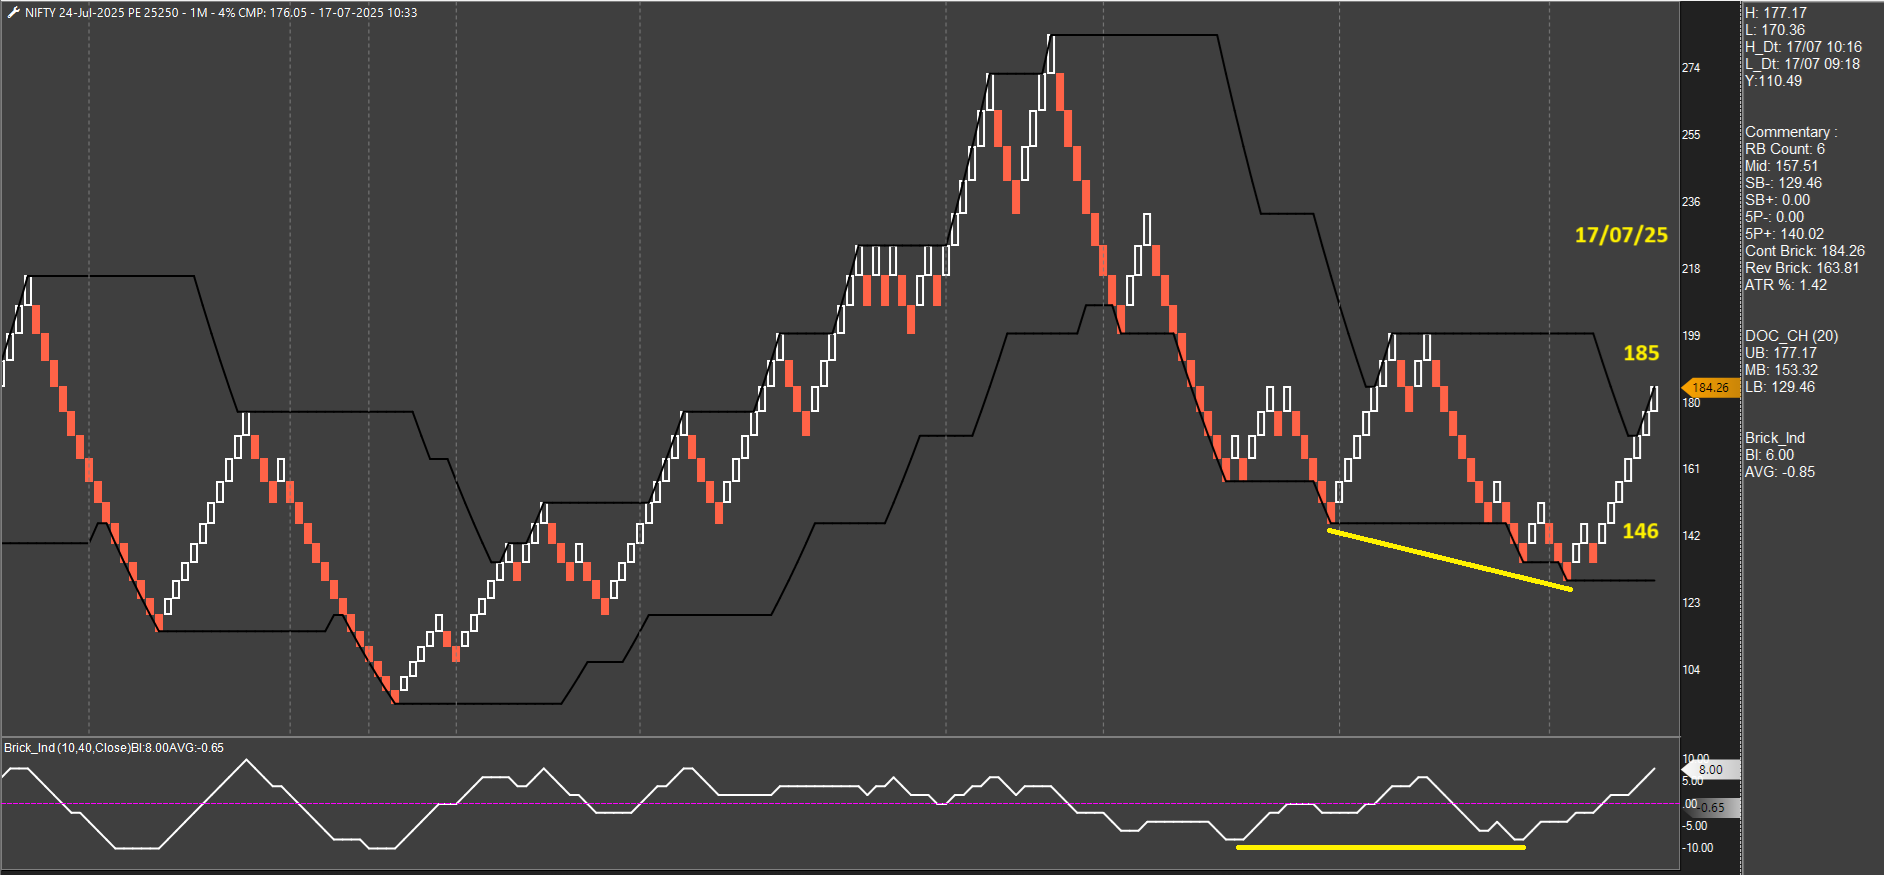
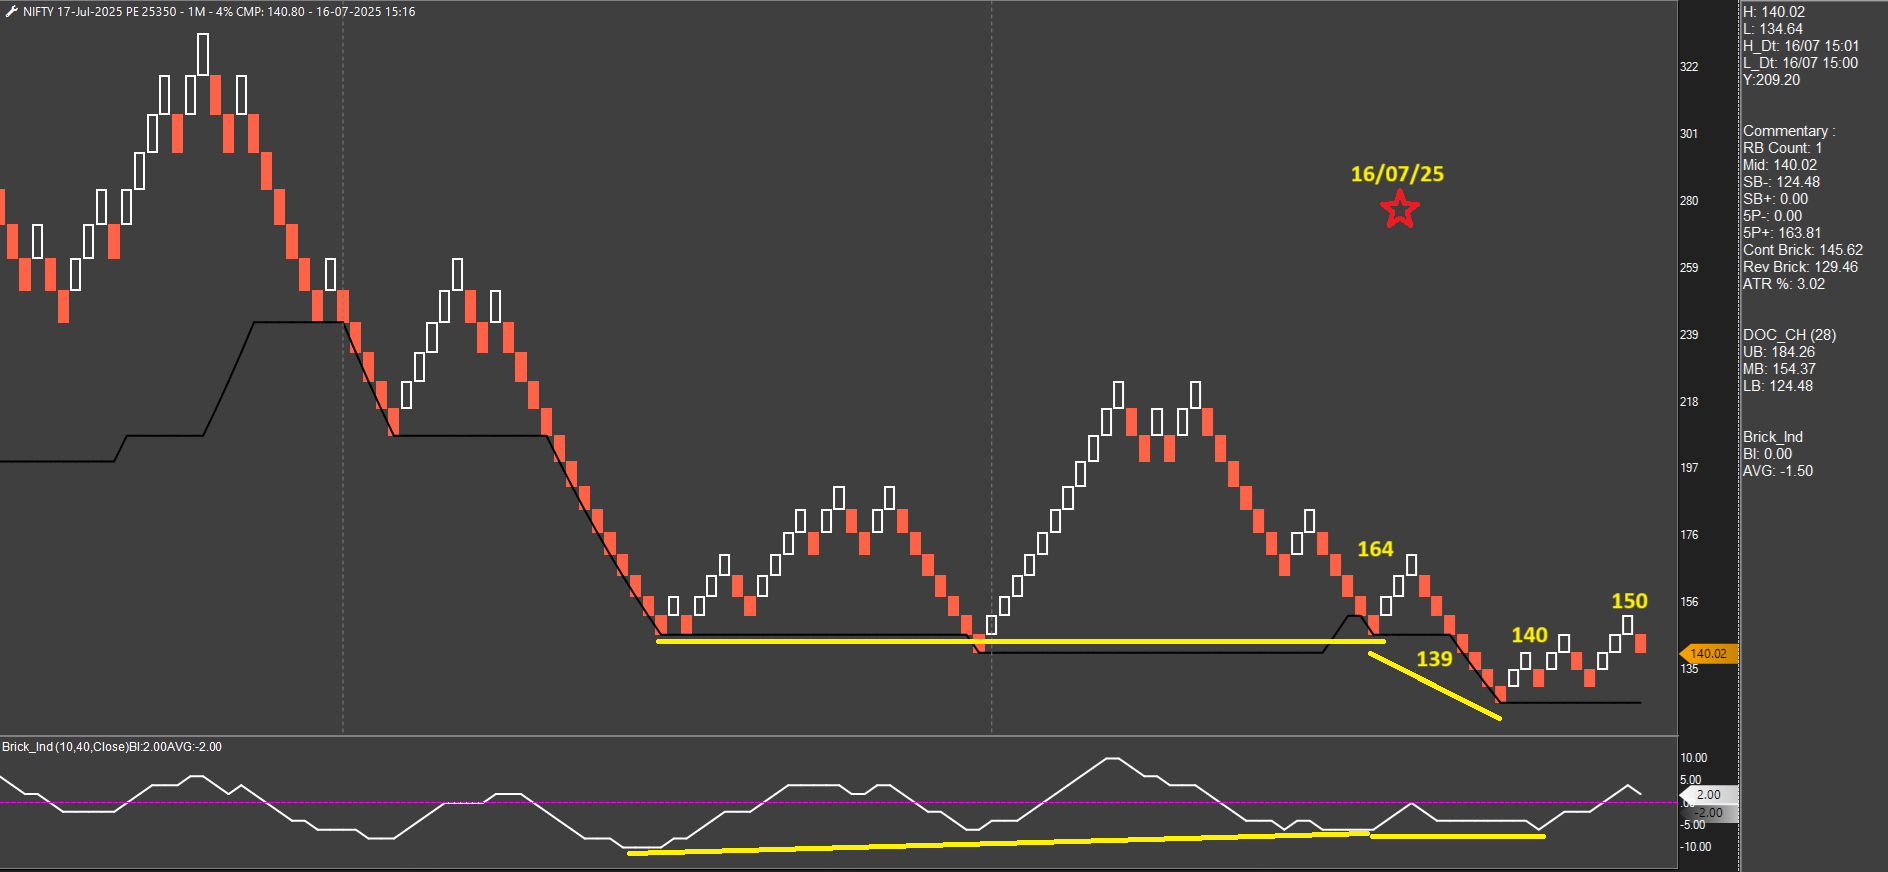
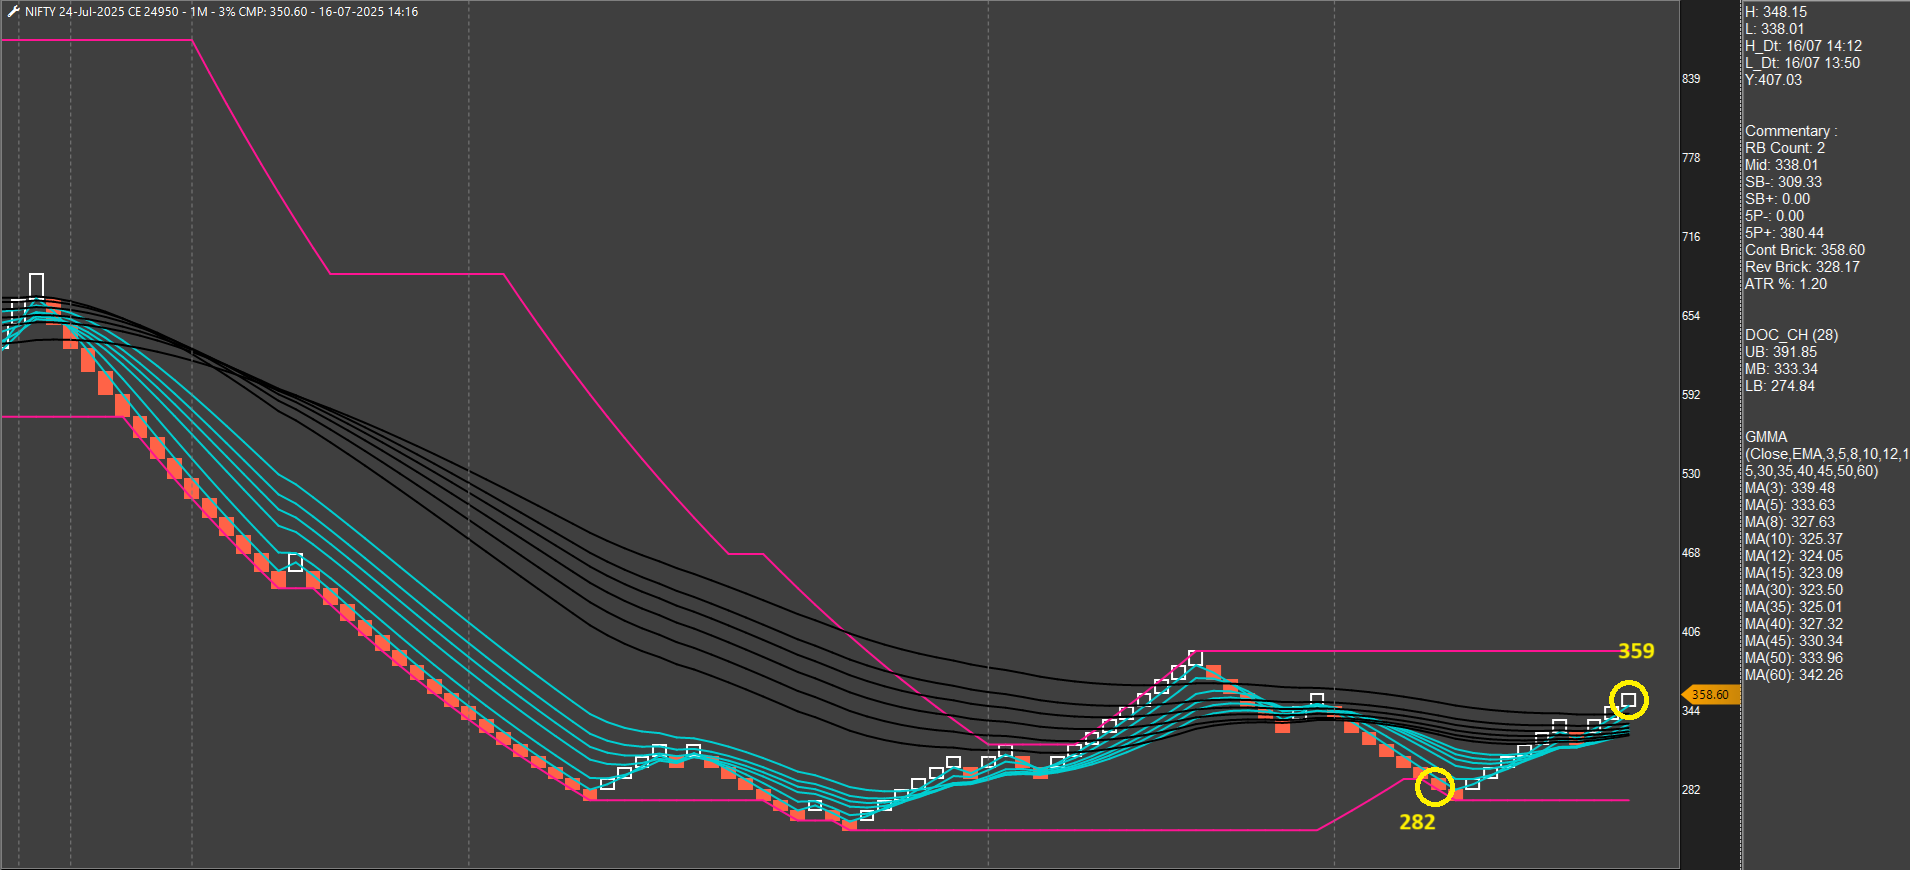
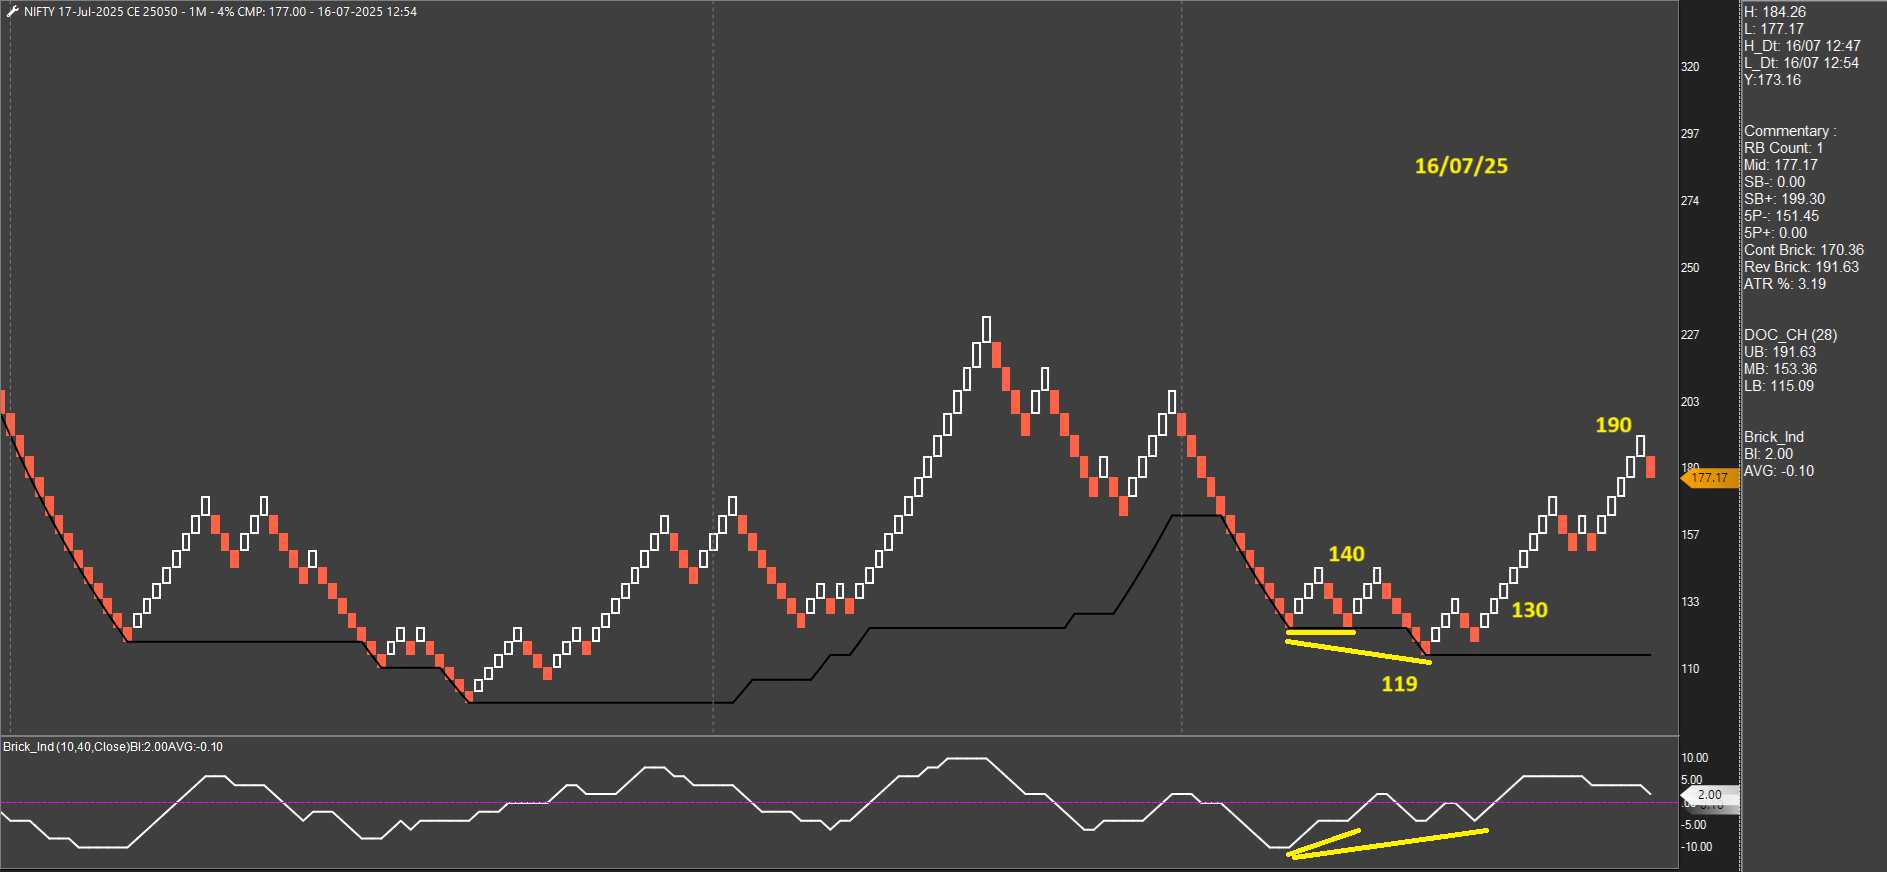
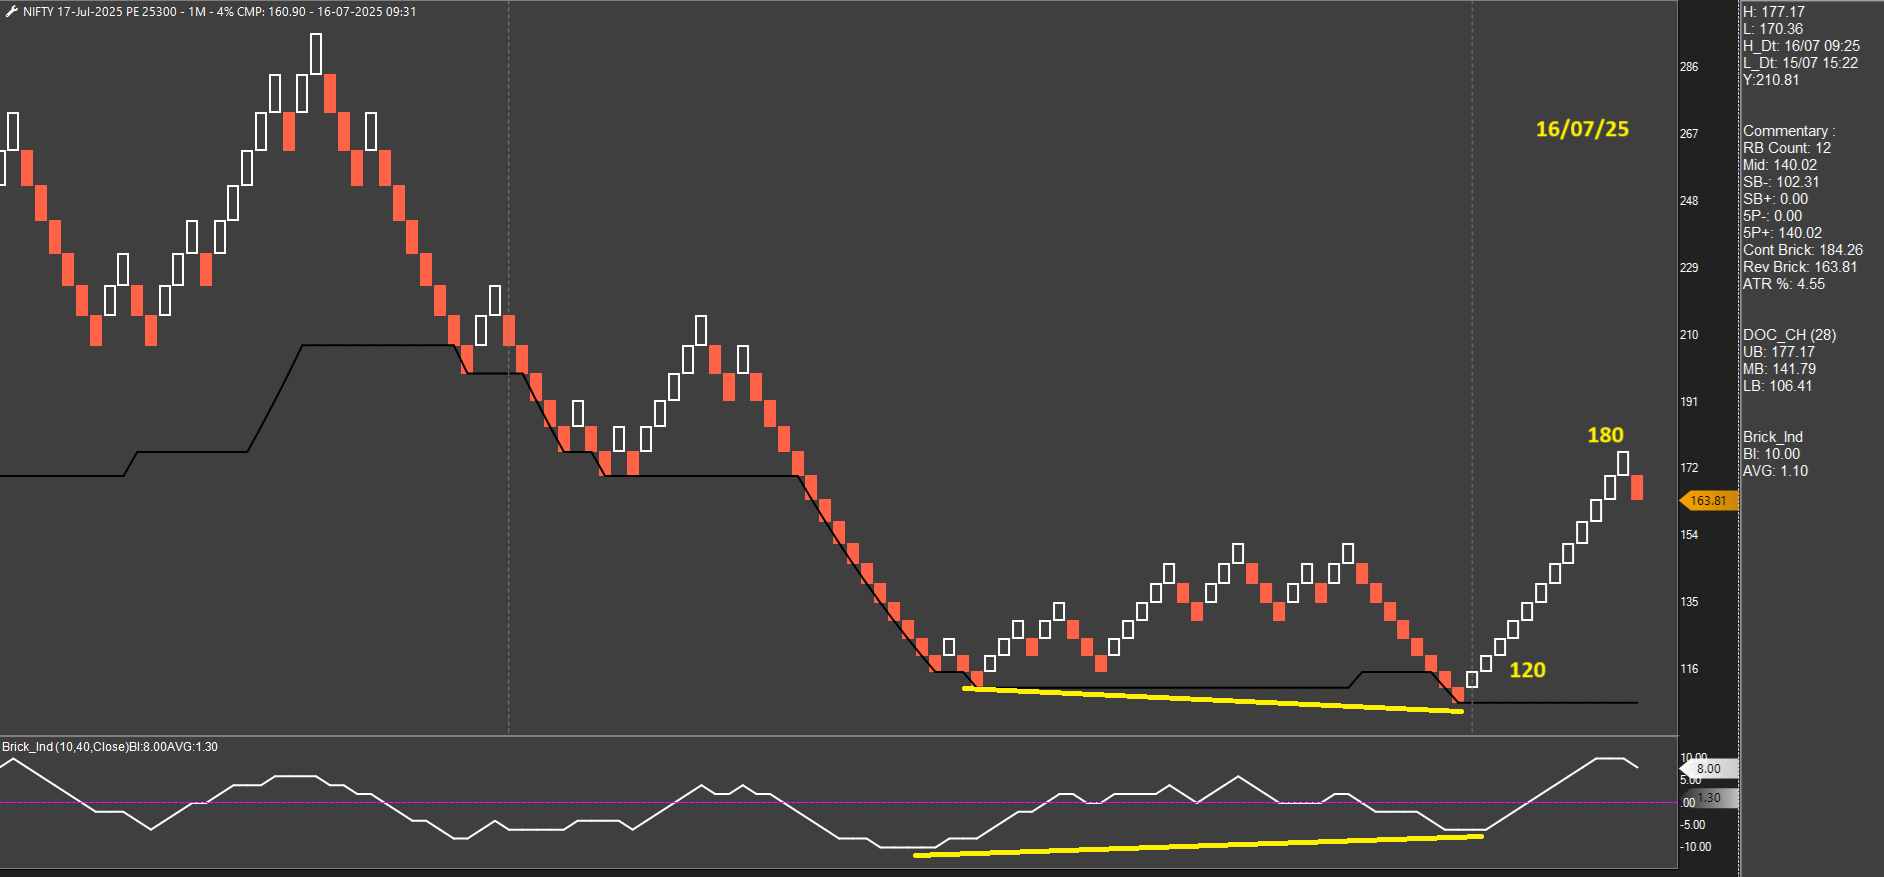
 Instrument and Charting Method: Nifty weekly options; Renko 4% High-Low, 1-min
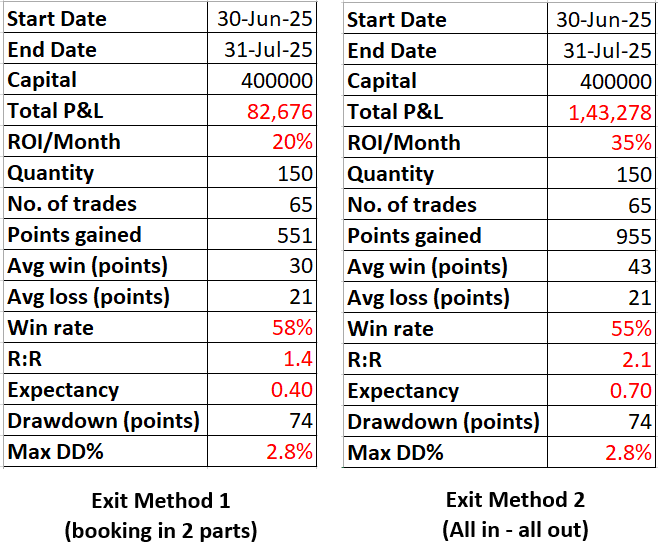
 Final note: This system is very much work in progress and has a few subjective elements. My goal is to make it more and more objective while making improvements based on everyday observations. I won’t be posting any further under this topic unless there is any significant new development.


 . This is why I've started posting on this forum - hoping to get suggestions/feedback and improve further.