@Anju-Verma did you get any update on this ?@Definedge pls advice , I am also looking for the same
Y
Yogesh Kumar
Pro User
All Replies
-
-
@Manigopal Vutla Yes it lags a lots, many times prices don't get updated. its a beautiful platform but I honestly feel, Definedge need to think seriously and fix it rather than introducing new features everyday.
-
@Definedge Thanks For your prompt reply and call, I got the answer after you explained me the default setting and condition.
Thanks & Regards
-
@Brijesh-Bhatia @Prashant-Shah @Definedge @@Definedge-Experts
Respected Definedge Team, Brijesh Sir and Prashant Sir,
I have been running an investing portfolio through momentify, I had some issues with it in the past and it was resolved, tomorrow is rebalancing date for my portfolio, I did scan and got a basket (as per conditions), so as per basket created by momentify basket scan system some are incoming and some are outgoing.
I did scan the same strategy with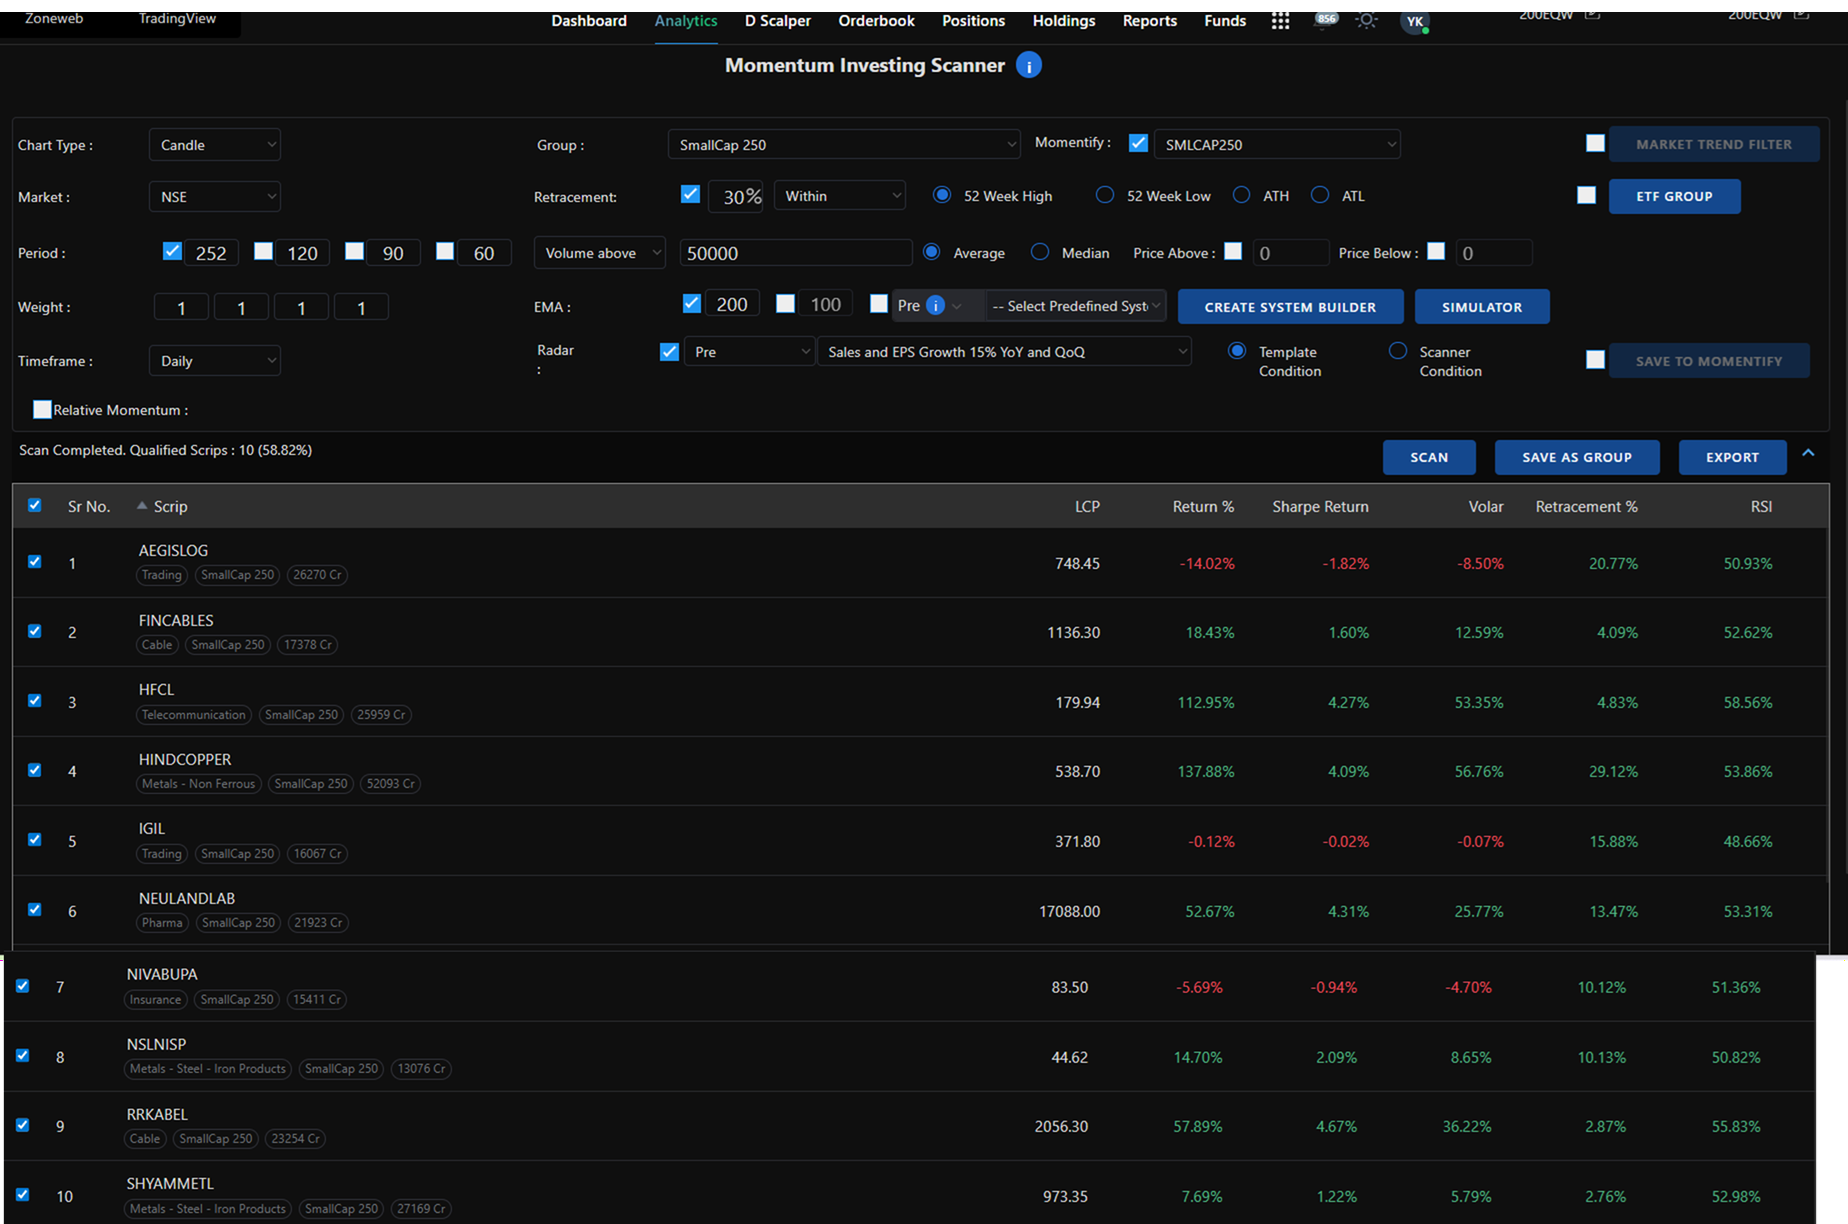
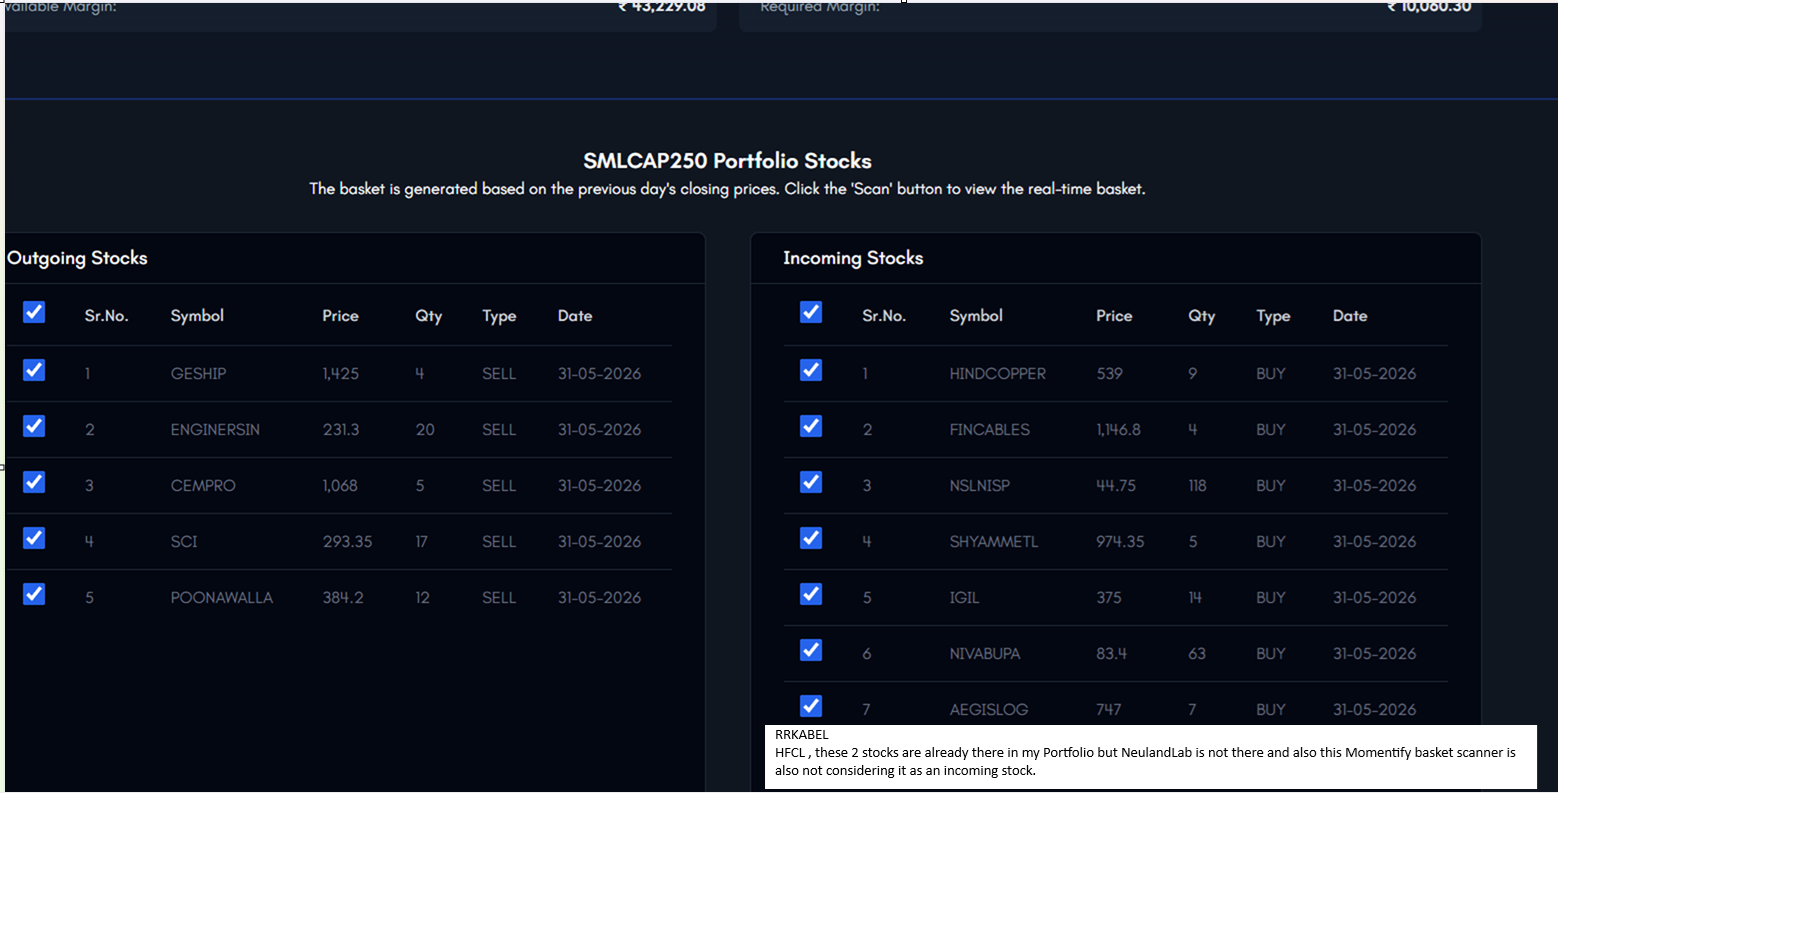 same conditions on Rzone but as per Rzone scanner result, there is 1 more stock which should be incoming but not incoming (in real)as per momentify basket scan system. It means, if we ever do the backtesting in the future, it will include that stock but in real its not considering as an incoming stock (again the question is how much can we rely on backtesting) pls look into this and advice.
Thanks & RegardsP.s I am attaching screenshot for your reference and the stock name is "NEULANDAB".
-
@Brijesh-Bhatia Thanks Brijesh ji, very interesting and nice article.
Yes, momentum is missing and breakout are not sustaining, pullbacks are deep and Risk Reward don't seem to be favorable
Thanks ! -
@Manigopal Vutla
Hello Manigopal ji,Its working fine, the system is taking the stocks as per Radar condition ( real portfolio ), so I have not squared off the portfolio and infact I will continue with the strategy and will observe it regularly.
As far as backtesting is concerned with Radar conditions, I am hesitant, I will wait at least 6 months and review again my real portfolio with backtesting to see if there is any discrepancy.
I am thinking of deploying 1 more portfolio through momentify but based on only technical conditions.Thanks & Regards
-
@G Heble
Hello,I got the answer and satisfied from Definedge Team (why there was a difference in backtesting and real portfolio) and I agree with you as well that ideally both should be more or less same (thts why I raised this query).
My concern is now, if Radar conditions were not updated and the system was not considering Radar conditions in backtesting then there is no point of backtesting with Radar conditions because the backtesting with Radar conditions won't give the true picture.
So, I will make another portfolio through momentify and observe (will not be putting any conditions of Radar, as I can't rely on backtesting with Radar conditions)
Thanks
-
@Prashant-Shah @Brijesh-Bhatia @Definedge
Hello Prashant ji and Brijesh ji,Thanks, I got a call from Definedge and team said that
--> When I initiated the portfolio (01 Sep 25), the system did not consider the Radar conditions that I put, so, it ignored that " Radar Condition" and took 17 stocks ( it should not have taken all the stocks )
-->And when rebalancing date came (01 Oct 25) , it considered " that Radar condition" (because the team did some updates) and some of the stocks, got squared off (the system should not have initiated on 01 Sep 25 itself)
-->Now all the rebalancing is as per my criteria or conditions.
-->I got the answer but again it raises a question about the backtesting, because as per backtesting, one should have 20 stocks but in my real momentify portfolio I am left with 10 stocks (in backtesting, it still ignore that radar condition but in actual portfolio, this issue is solved.)
-->This can create discrepancy in results. Please consider these issues in backtesting.
Thanks to both of you and Definedge Team (Mr Rajesh, he was very patient and attentive) and kudos for your efforts in making this platform unique and great !
Regards,
Yogesh Kumar -
@Prashant Shah
Hello,
Prashant sir,I got a call from Definedge and had a gmeet with Mr Rajesh, he patiently listened to my issues and understood what I was trying to convey,he took notes and working on this. Thanks to You for the reply. It helps a lot when issues are addressed properly, it gives us confidence and build trust. I admire Definedge a lot for the its uniqueness and great tools.
Thanks & Regards -
@Definedge @@Definedge-Experts
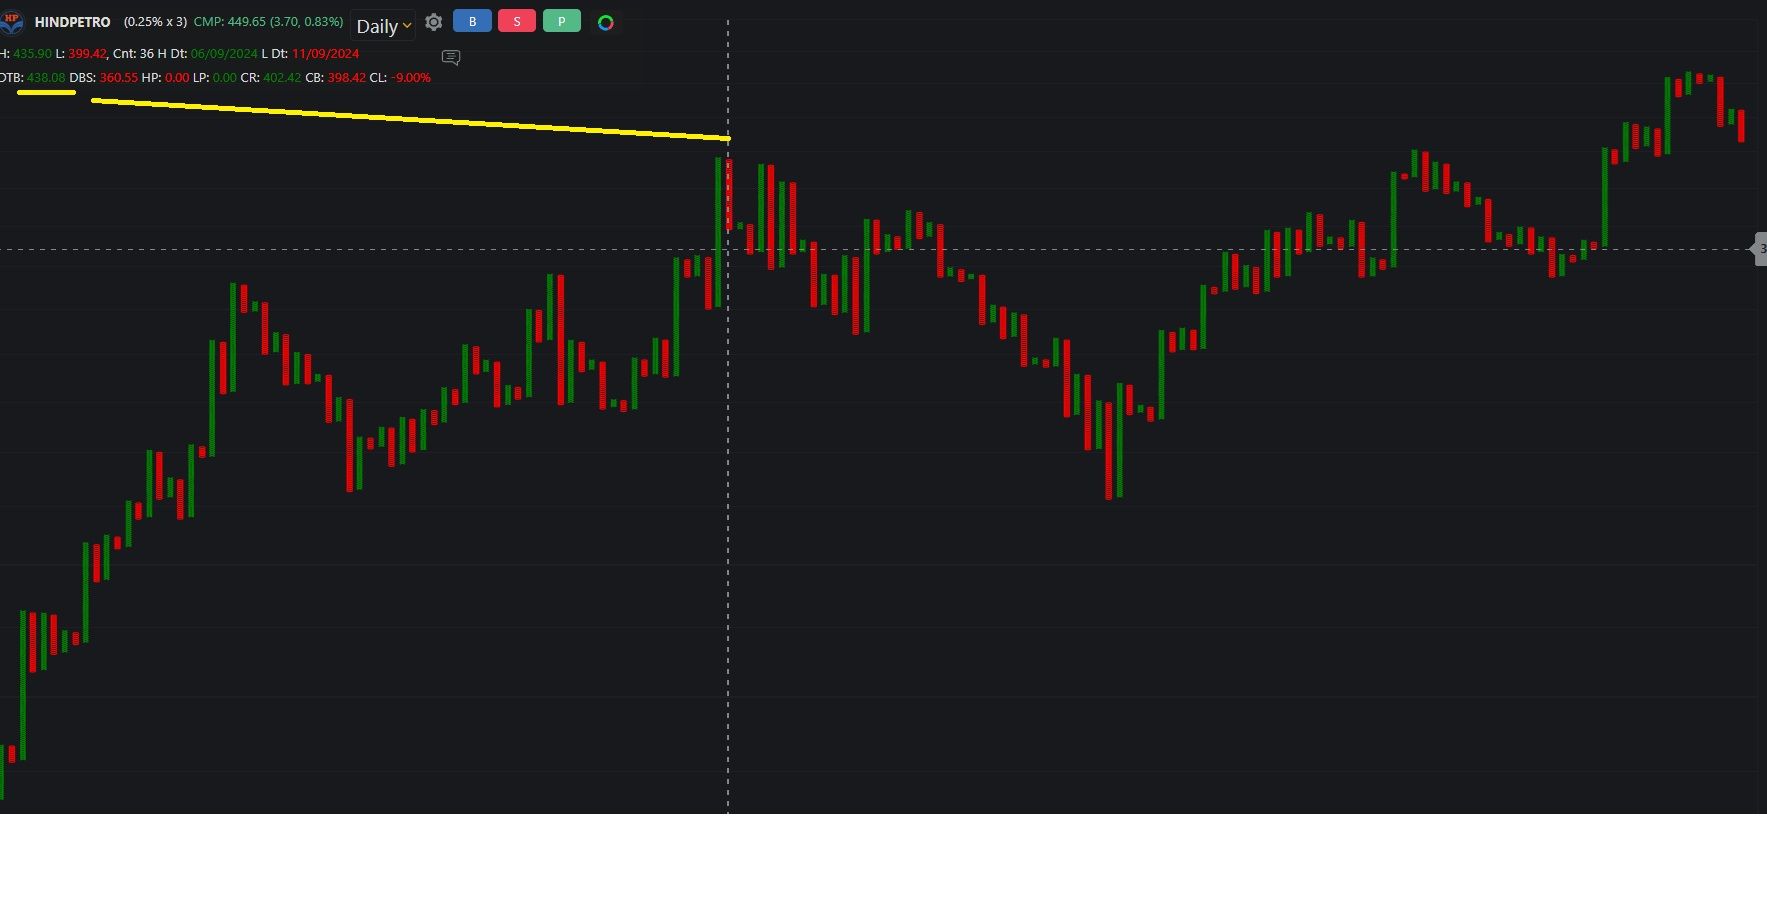
Hello, I observed again the chart of hind petro, but the issue is still here, the chart is still wrong and its been more than2 months that I brought to your notice.
Pls understand, its not about a chart but data, that can impact our trading decision and can affect the backtesting results as well (there can be many charts, I just observed once, and hope its the only one). Hope you will do something regarding this. Tradepoint shows the correct price and chart but zone app chart n data is different, every time we can't check both apps for every chart.
@Brijesh-Bhatia sir, pls look into this.
I am attaching a screen shot for your reference again.
Thanks & Regards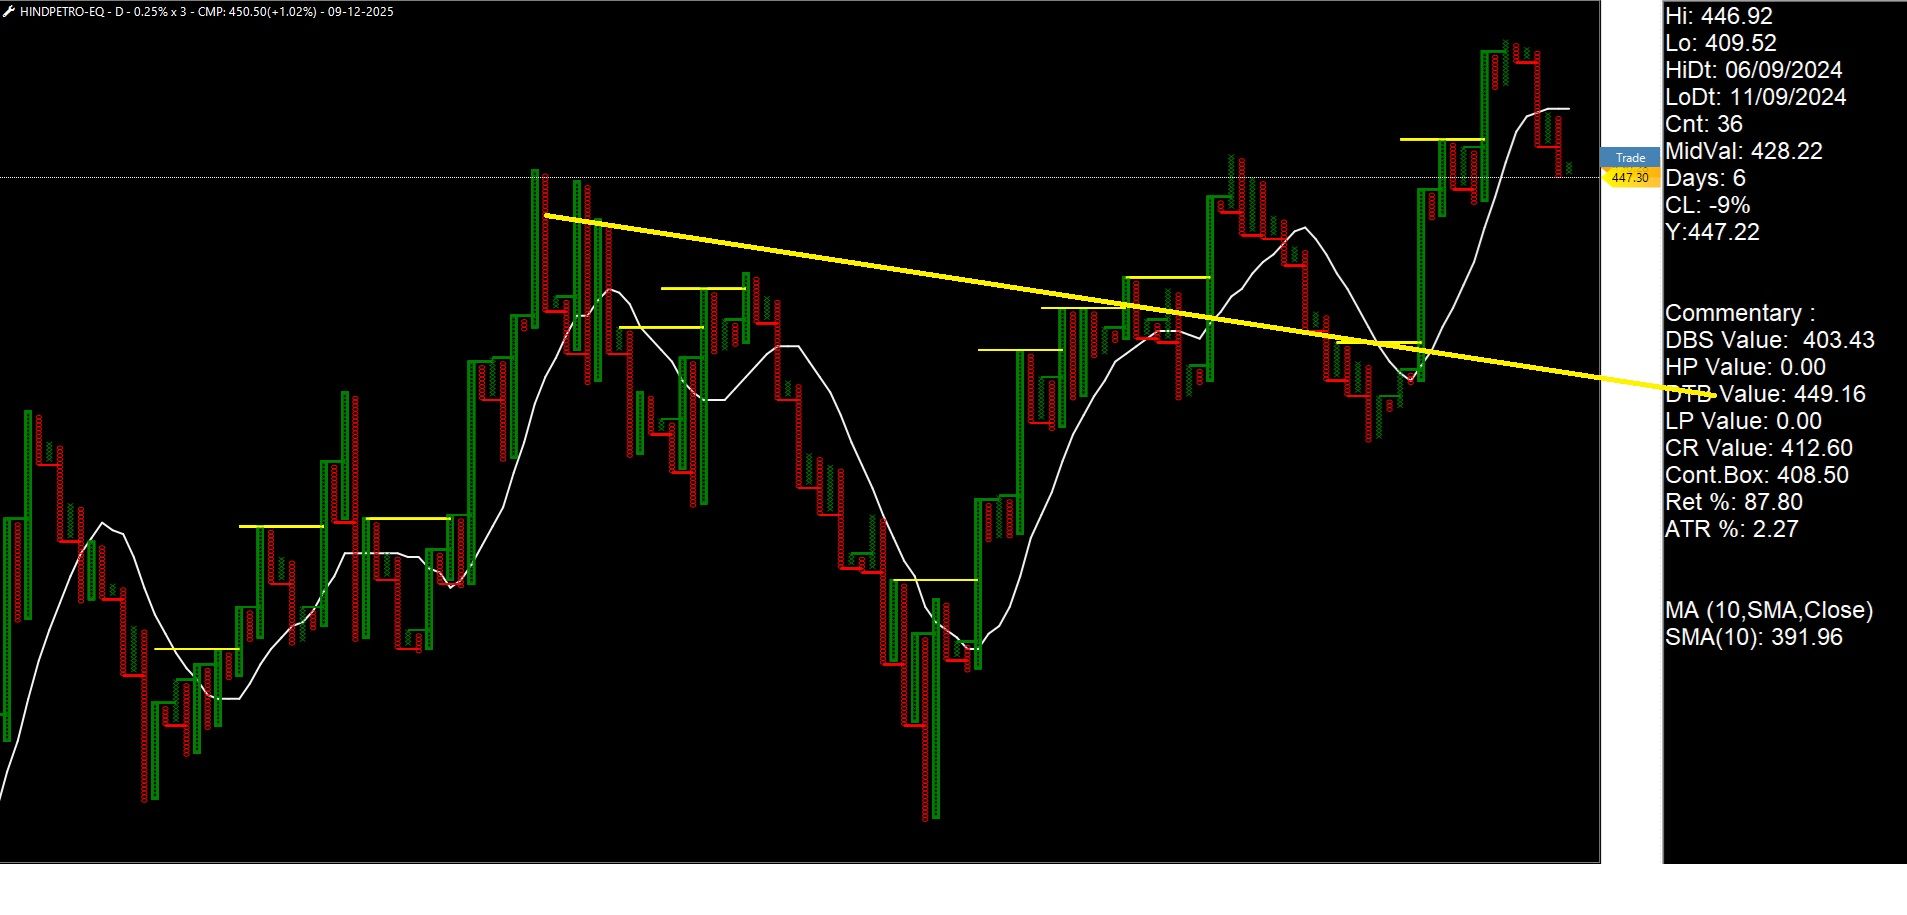
-
I got a call regarding this but I am not satisfied, they say, in backtesting it takes the Eod data and there might be some difference, to which I replied " yes, some difference, but in backtesting, next month(2nd month) it shows 20 stocks after squaring off some stocks n gave entry to some new one, while executing the real portfolio through momentify, I was left with only 6-7 stocks in my real portfolio and as far as eod data is concerned , momentify also pick stocks as per last day ending price."
So, I am bit confused and unfortunately can't rely on backtesting, it is good on paper, but in reality the story is completely different. The explanations I got , don't satisfy and encourage me to go further until they fix these issues. We are not putting only money, but investing our time and efforts. Thanks & Regards -
I have also raised the concerns regarding backtesting and data's accuracy, moreover, momentify software picked 7-8 stocks but in backtesting for the same time duration, showed different result (20 stocks). Been a month raised this issue but still did not get any reply or resolution. Disappointed...
-
@Brijesh Bhatia Thank you Brijesh Sir,
Regards,
Yogesh Kumar -
@Definedge @@Definedge-Experts @Prashant shah,
its unfortunate and really disappointing that its been a month and there is not a single acknowledgment from Definedge Team.
What should I do in order to get a reply and get it resolved.
Pls advise. -
@G-Heble Thanks. Yes. I understand, difficult to get conviction.
-
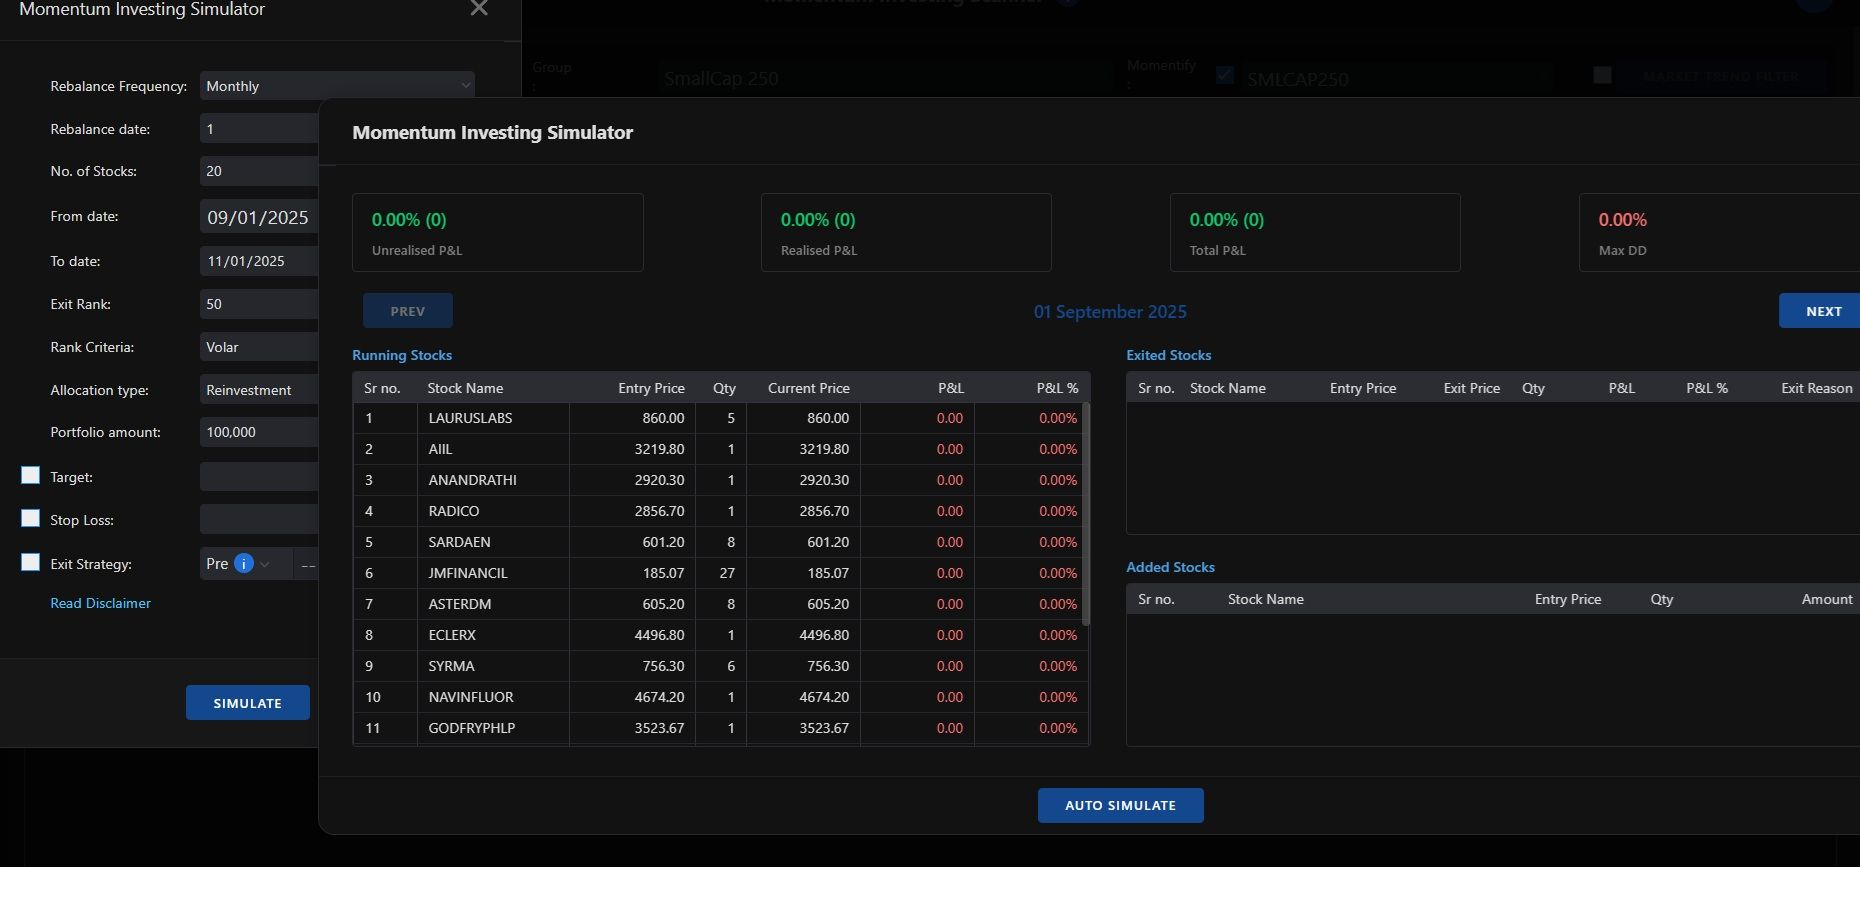
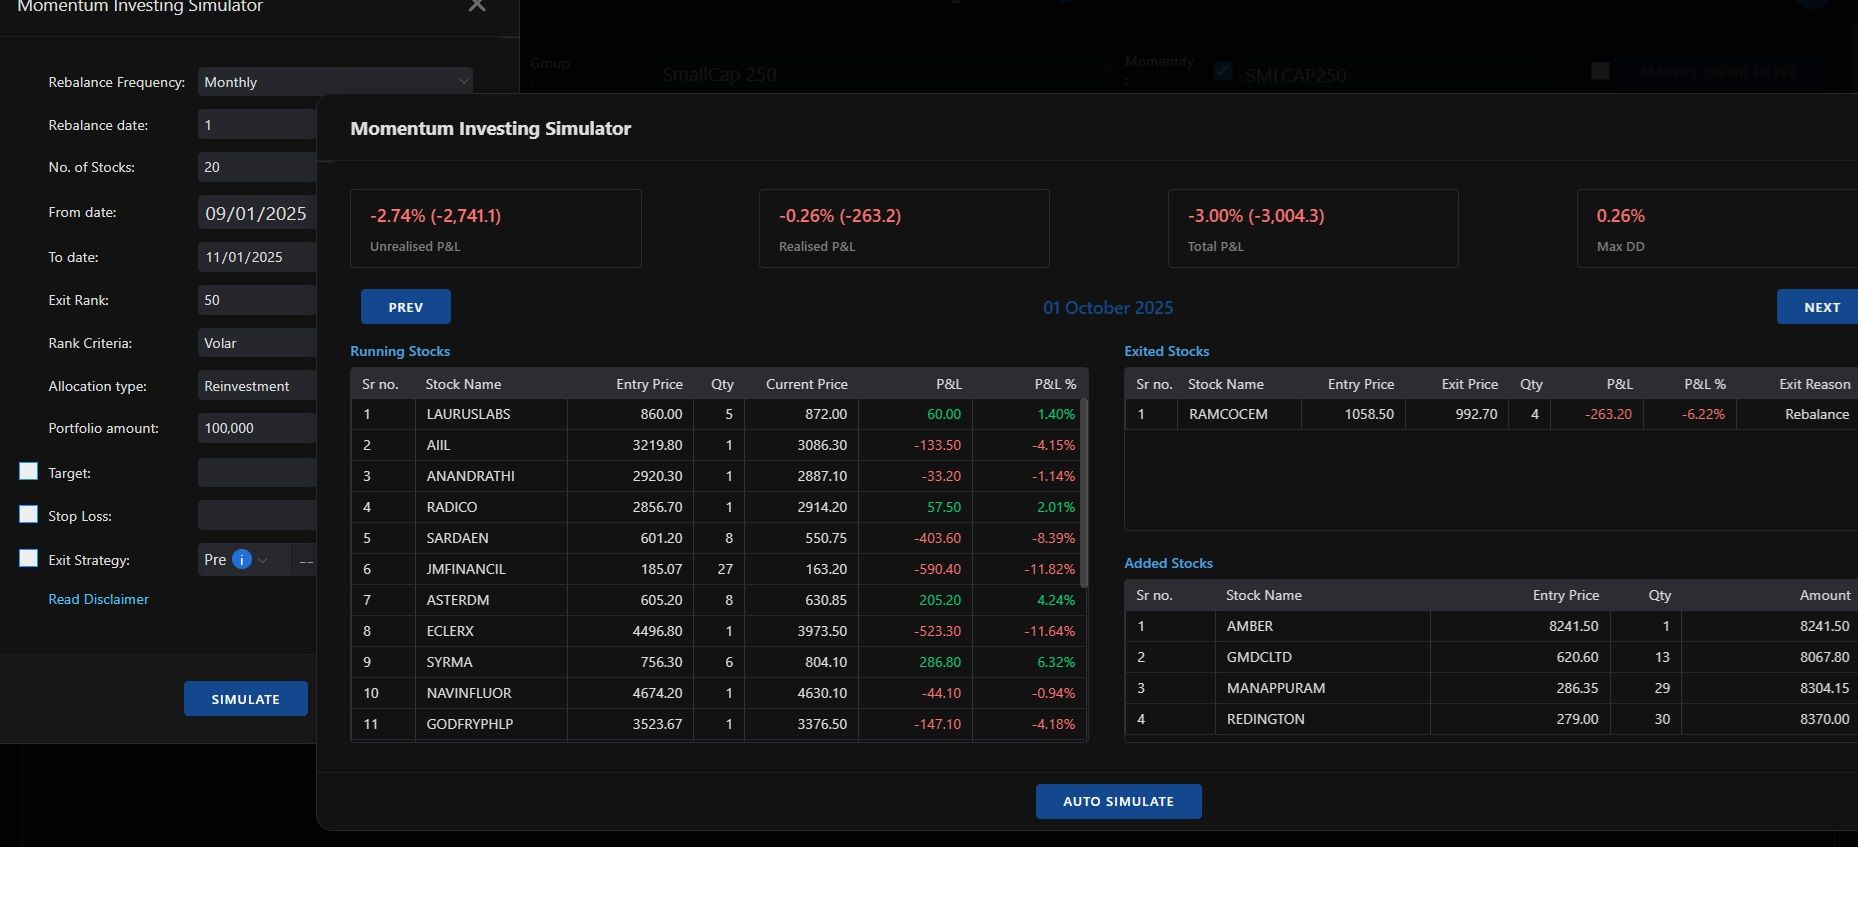
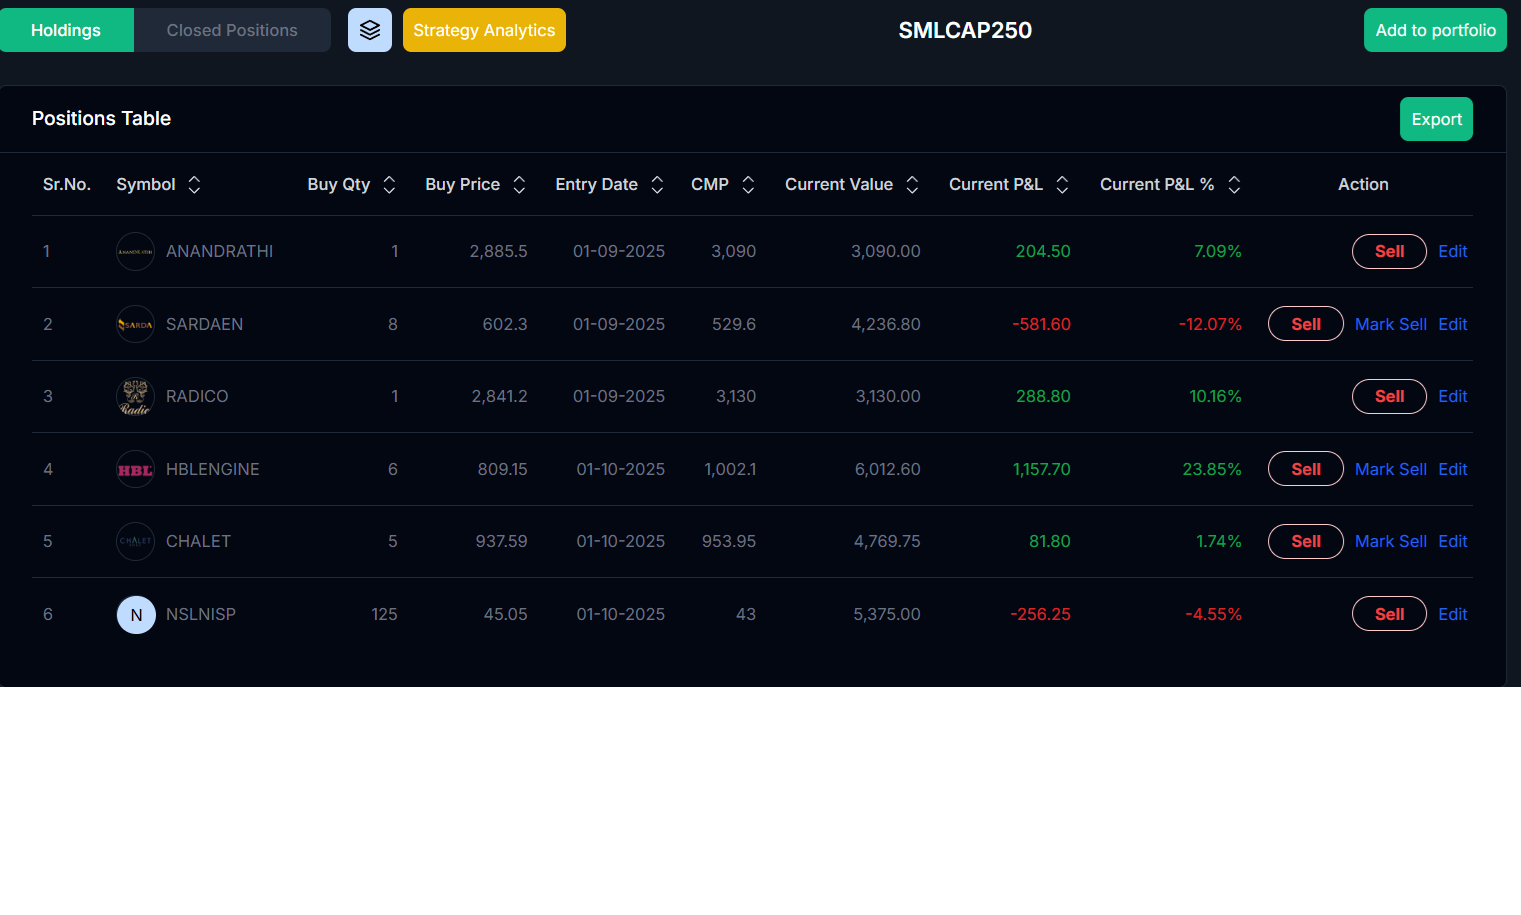
Hello Definedge team,
I made a portfolio and invested through Momentify (after doing backtesing for several days ) on 01-Sep-25, I got 17 shares as per scanner conditions and strategy (Allotted 1 lakh on 20 stocks, but got 17 as per stock selection criteria). On 1-Oct-25 , did rebalancing as per rules , the strategy squared off 14 stocks and gave entry to 3 new stocks, so I have total = 17 -14 +3 = 6 stocks on 31st-Oct-25. Now rebalancing date is on 01-Nov-25 (Saturday is off, will do on 03-Nov-25). I got a mail for rebalancing, I checked the basket so it is showing 3 outing stocks and 3 incoming as per strategy criteria. All is okay till here because we have to rely on Momentify and don't have to do the changes manually as advised by Mr Prashant ji and it's the core and important idea of investing through this method for long term.
Now, out of curiosity and after reading some feedbacks of users about the wrong backtesting result and discrepancies. I ran the backtesting with same conditions of my real portfolio, same date i.e 01-sep25, it shows 17 stocks ( same result when I started), but next month on 1st-Oct-25, backtesting is showing entry of 4 stocks and exit of 1 stocks , so it makes 17-4+1 = 20 stocks for the month of October whereas in my real portfolio it made me exit 14 stocks and now I am holding only 6 stocks.
Pls look into this, how can we trust the backtesting? what is the point of spending hours with a hope of investing in good strategy through platform? it is really a serious issue, if such issues persist, I am afraid that, users will consider other alternatives available in market.
Hope to hear from you soon and you fix this issue asap.
Attaching backtesting result and real holding for reference.
Thanks & Regards, -
I have also observed the difference between back testing and real portfolio through momentify. Will post with images.
-
@@Definedge-Experts no reply ?
-
Hello Definedge Team,
Hope all the members are doing well.
While looking at the charts, I have observed that in Rzone charts and data are not always correct, earlier also I have raised a query regarding discrepancy in Rzone data.Instrument - HindPetro, as per Zone chart, it is at all time high( CMP -446.3) closing basis, there is no resistance but same instrument on Trade point shows that there is a resistance the high is around 453.6
(you can check it on any chart type, OHLC or P&F, I am attaching a PnF for reference). Pls look into this.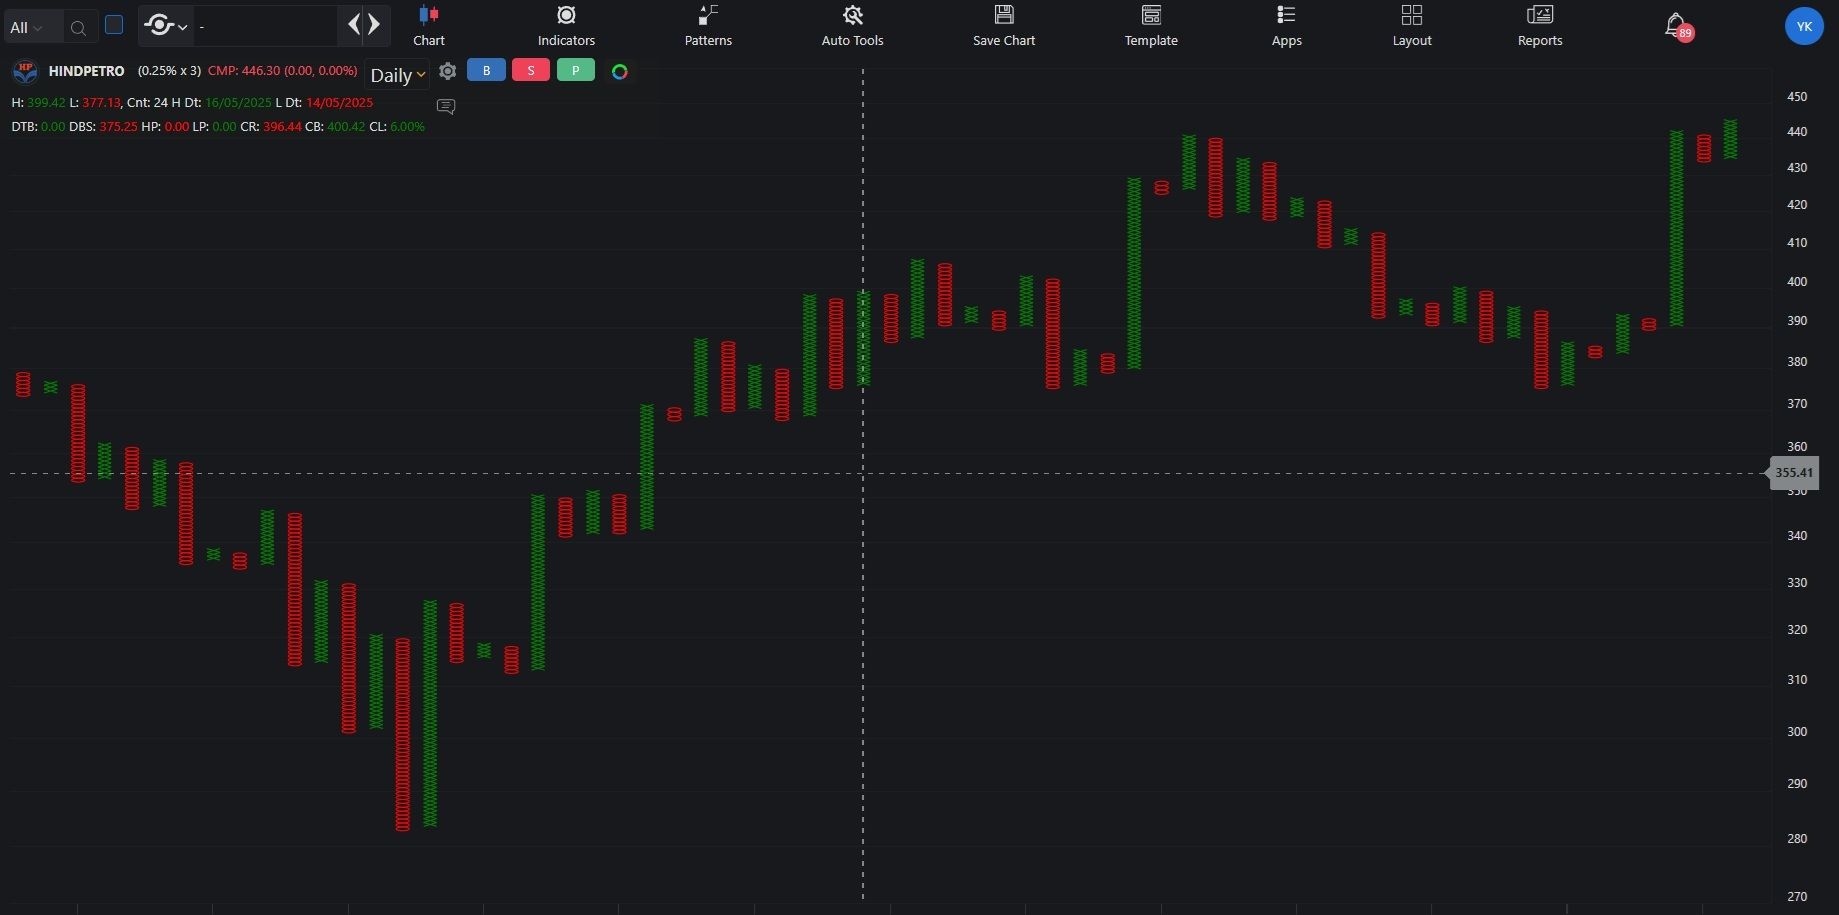
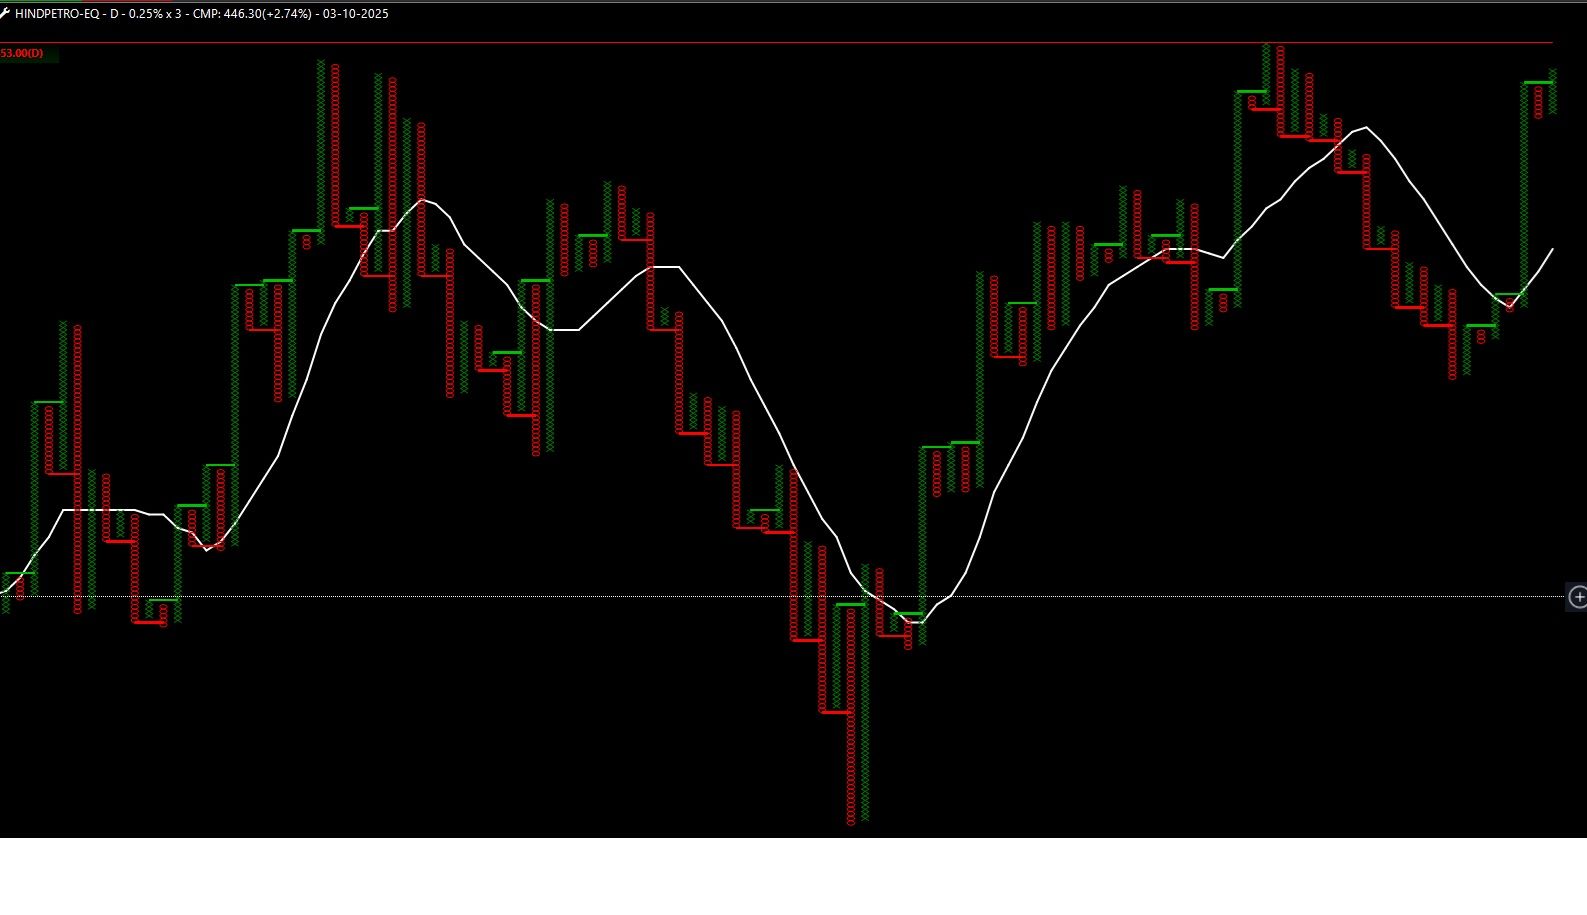
you have created a beautiful web platform (Zone) but such issues ruin the experience and we might end up taking the wrong trade if we don't recheck on other platforms and we can't do this every time. ( Trade point is showing the correct data and chart as always )
Wish you all a great weekend !
Thanks & Regards, -
Thanks !
-
Hello Definedge Team,
I invested in some stocks through momentify's strategy, earlier in my portfolio, I had a symbol (momentify's logo) with the stock name , so it was very easy to see and segregate the stocks. If momentify logo is there, I know , I am going to play for long time , and If logo is not there with the stock, it means that they are for short term or swing positions or as per other study, but now the logo is no more there with the stocks and it does not give a good experience while trading as its a big list ( 20 of momentify and other stocks for trading or investing as well). Pls look into this.
suggestion - Pls provide a filter or drop down menu ( like to select the momentify stocks or other positions ). Pls think about it.Thanks & Regards
-
Hello Definedge Team,
Hope all the members are well ! I have some observation regarding the data, while checking some charts, I have seen that CMP or one can say Closing price is not always correct on Rzone app, Specially 0.15*3 - 1 minute chart.
For example - Eicher Motors - on 15 sep 25 closing price is "6801"
on Rzone 0.153 - 1 min, it shows - "6799" , on 0.253 - Daily , the price is correct - "6801"
On Trade point - on both the time frame the price is correct "6801"You can check , Dr Reddy as well, there are so many charts.
Both the platforms are excellent but I prefer Rzone and its frustrating to juggle from Rzone to Trade point.
even when we scan data, sometimes, I find discrepancy in result data (rare but it happens), R zone scan result does not show the same result done on Tradepoint.
Please look into this .
Thanks & Regards
Fetching dividend statement
Backtesting and Scanner slowdown
Wrong enty exit and differences in Momentify Portfolio and RZone backtest
Wrong enty exit and differences in Momentify Portfolio and RZone backtest
Not a Crash, Not a Rally; Just a Warning!
Wrong enty exit and differences in Momentify Portfolio and RZone backtest
Wrong enty exit and differences in Momentify Portfolio and RZone backtest
Wrong enty exit and differences in Momentify Portfolio and RZone backtest
Wrong enty exit and differences in Momentify Portfolio and RZone backtest
Wrong chart data on Zone (Web)
Wrong enty exit and differences in Momentify Portfolio and RZone backtest
Serious Issue in Backtest Position Sizing Logic – Inflated CAGR Results
Wrong enty exit and differences in Momentify Portfolio and RZone backtest
Wrong enty exit and differences in Momentify Portfolio and RZone backtest
Inconsistent Backtest Results
Wrong enty exit and differences in Momentify Portfolio and RZone backtest
Inconsistent Backtest Results
Wrong chart data on Zone (Web)
Wrong chart data on Zone (Web)
Momentify logo disappeared in Portfolio
Momentify logo disappeared in Portfolio
Wrong closing price showing on P&F Chart ( R Zone )