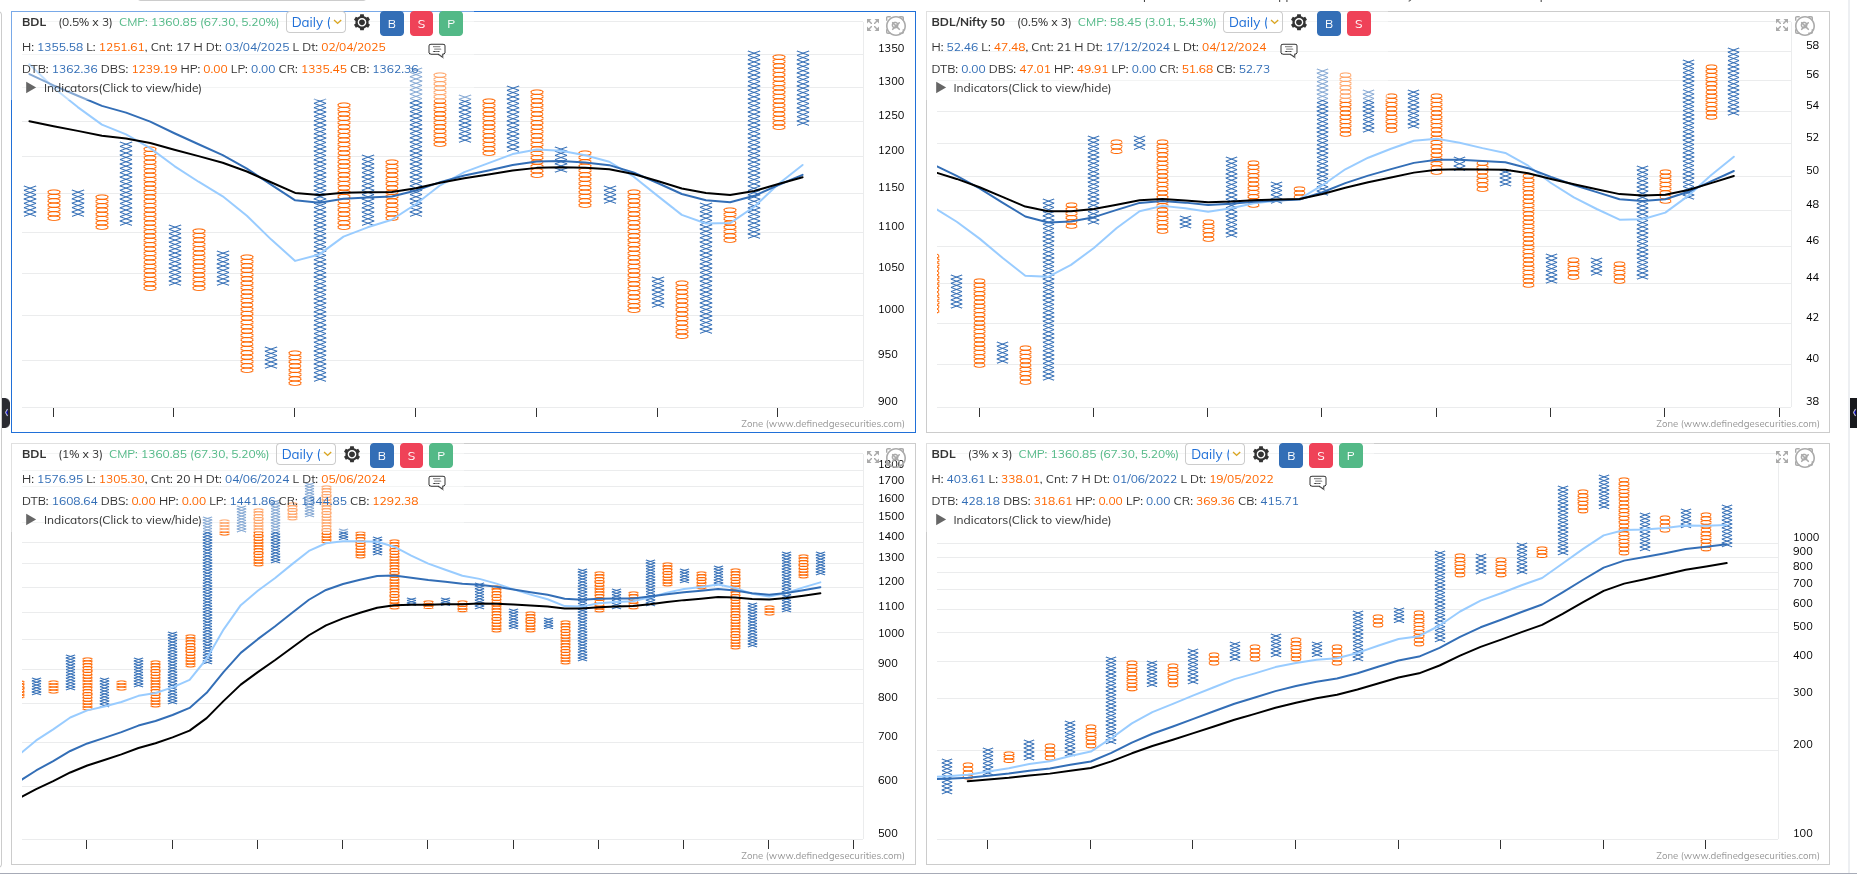
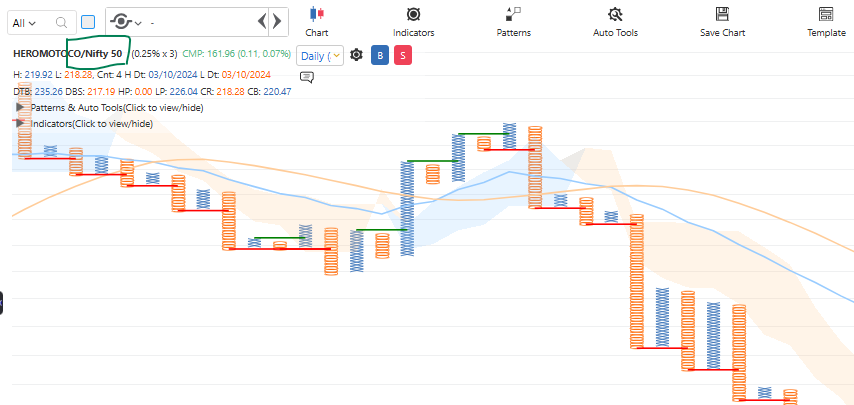
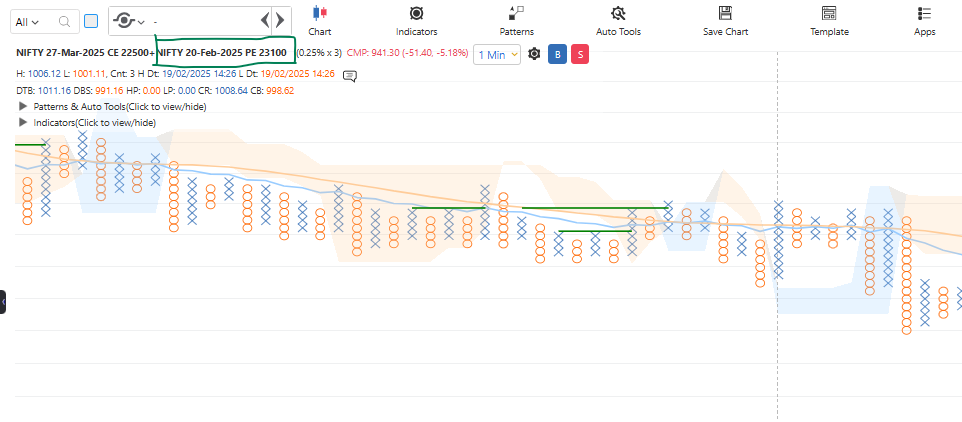
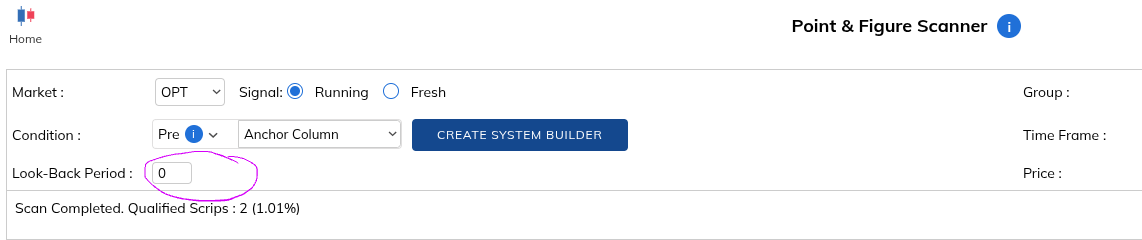
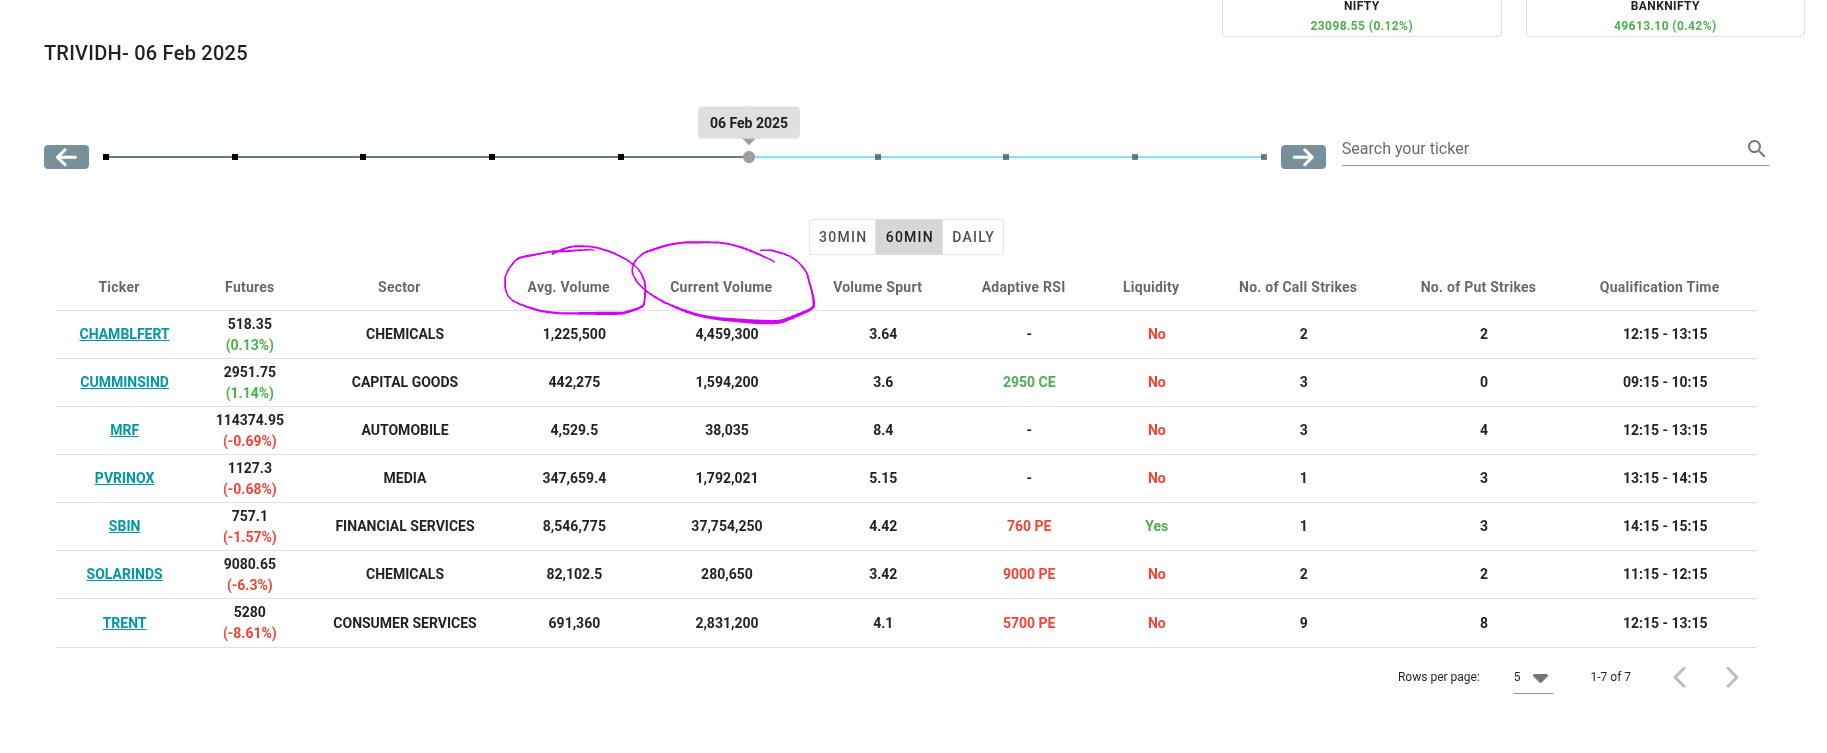
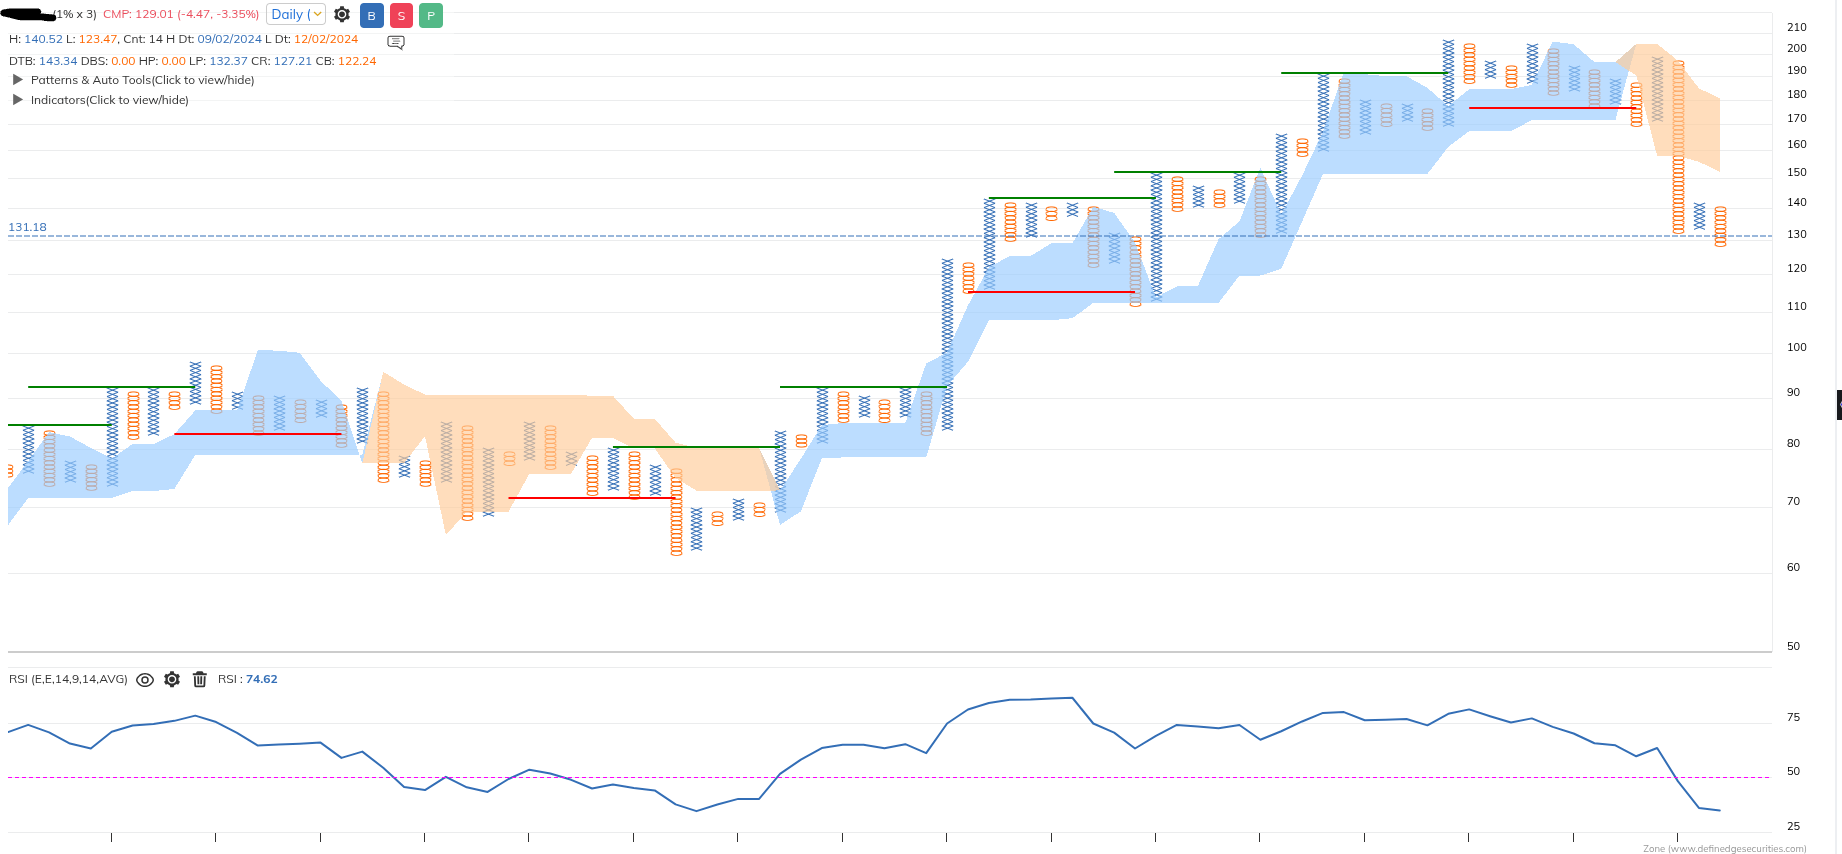
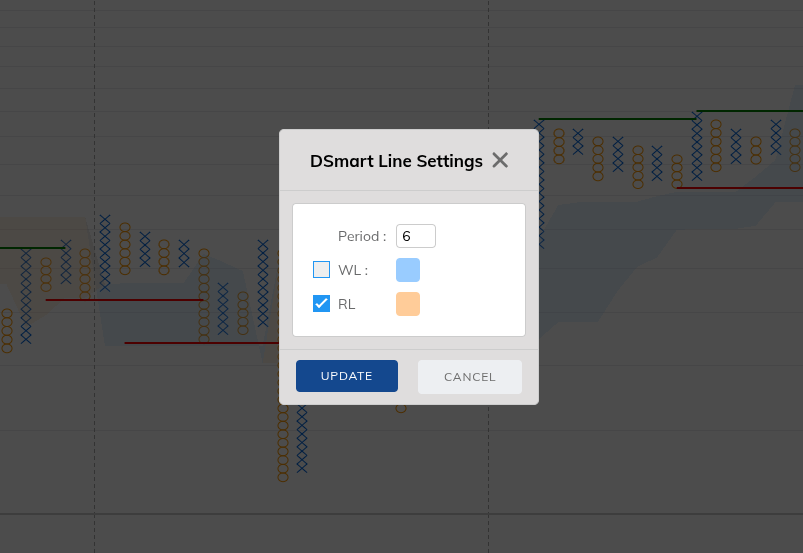
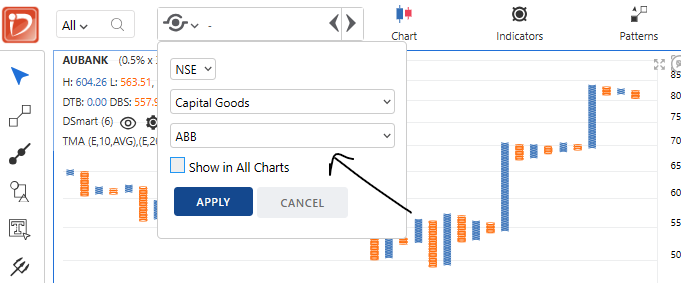
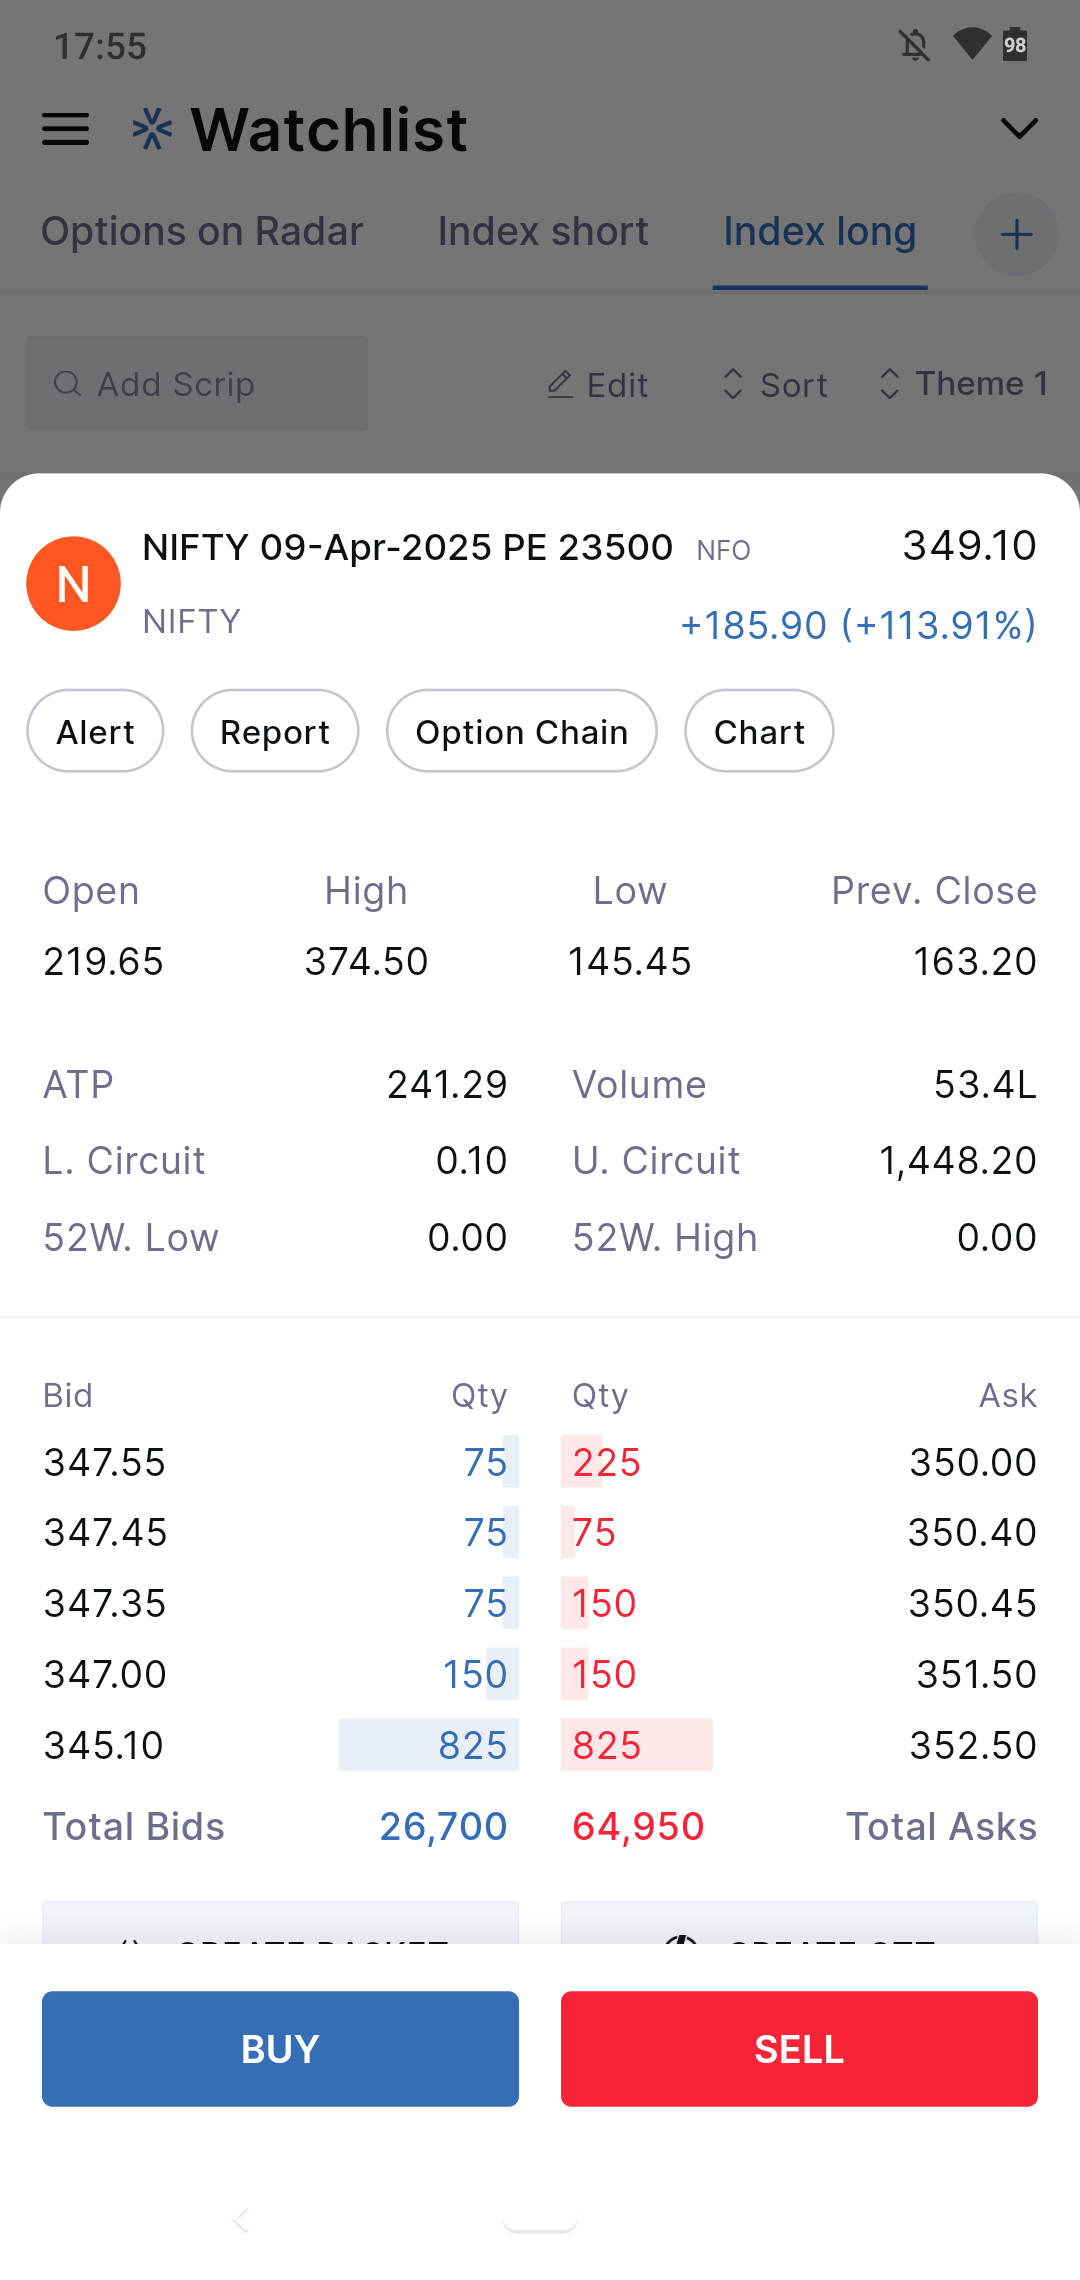
@Prashant Shah
Sir, I have some question as well,
- Can we used "RS-Alpha" as a Breadth mean how many stocks are outperform index at any timeframe??
- Does Breadth include weightage of stocks of nifty50 ?
Pro User
@Prashant Shah
Sir, I have some question as well,
One of the study I have read and watched some of the video that in Bollinger Band above/below 0.7 std. stock is in momentum.
But are scanner does not allowed
please allowed us to apply

@Prashant Shah
some of the study I have observed :
MACD signal line > 0 on 15min

MACD Histogram > 0 on 15min

Above VWAP on 15 min

above 20EMA on 15 min

RSI > 60 on 15 min

above Supertrend on 15 min

@Definedge please update it..
@Definedge no response till now??
As Prashant sir explain in Breadth video I have explore this to many extend and I realize that it is very well to make trade in intraday/daily/weekly timeframe and nothing can beat the Definedge but for intraday it has less facility could you please add small timeframe in OHLC indicator or other indicator to use it in intraday trade.. some of the method are
and many more
we can explore its timeframe 5/15min/1h/2h as well
so could you add the timeframe in this..
and whatever group select automatically open that chart as well (if possible)
Breadth Charts Reimagined: Apply Indicators & Strategies Like Never Before!


@Definedge PIN based login in mobile app as well... What if biometric failed..
@Prasiddh-Shroff or @Definedge could you please Explain these symbols?
@Prasiddh Shroff
Thank you sir, I know it thoroughly...But @Definedge didn't explain its TAIL'S SYMBOLS which are I have mention in the post.
when we go to its tail, chart is showing some symbols, I have seen most of the DeMAP related videos 4to5 times but the didn't mention that symbols..


just like intraday lines can you add week separated line and month separated lines for better understanding?

could @Definedge team explain what is the meaning of the expressions in DeMAP chart stock's tails has following
and can you add the section where we can select our watchlist and the portfolio to track that stocks with the help of DeMAP?
By the way this is a very great product for stock selection with the help of visual form..
@Definedge no response till now??
could you please merge all Breadth charts in single window? it is very cumbersome to open every chart and check..

|| श्री गुरुभ्यो नमः ||
Happy Teachers Day to all @Definedge team; special all the mentors... Thank you so much to Introduce us and specially me; the Noiseless charting method; and made a very incredible platform called "Definedge"...
There is a famous dialogue which I also use for it that " There are two kind of traders one who love definedge and other don't know about it".
Something I thought " kya hota agar apka platform Other country me hota to Hum to is knowledge se aware hi nahi ho paate or vice versa Now for the other countries...
thank you so much for listening our suggestions.. and not just that even implemented it that is really commendable. A lot to say but words are not supporting me. Hope will meet
Thank you so much Prashant Sir
Your Eklavya
Yogesh Varhadpande
@Dhiren Desai Try it again; 2-3 time.. sometime it is due to our internet issue..
@Definedge could you make a indicator or script info button (available on candle chart ATH-ATL) which show on chart the Percentage Value of DTB; DBS; HP; LP from the current price..
Because percentage values always give the confidence to enter in a stock or not and if it is displayed on chat so it would be very convenient...
@Definedge CL Value of "O" Column is showing wrong Calculation Result..
@SANTANU BEZ sir, your every post is a case study for trader who want to learn something new.. Thank you
@Nishshkumar Jaani,CFTe @Definedge , please also add RS-Alpha and RS-AV in same window
No response by @Definedge till now...
@SANTANU BEZ your explanation of consepts are really so good... Thank you 
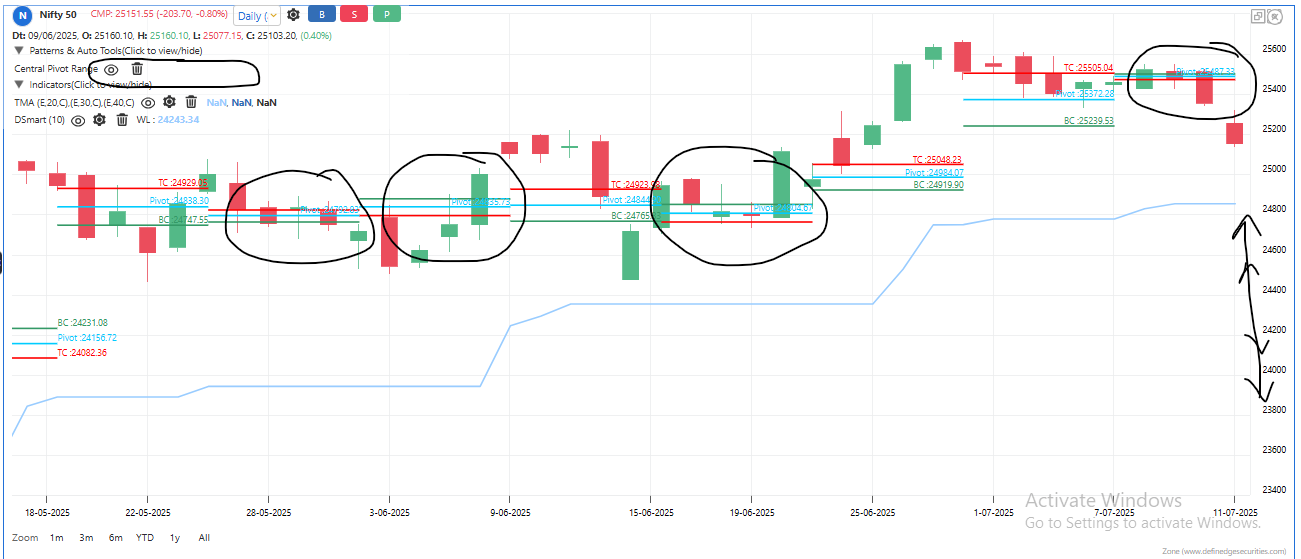
️ “The Abhimanyu Context and Exit Problem in Modern Trading”
@SANTANU BEZ Ultimate explanation... Great work 
@Definedge Put this "sort by" option there.. It would be very helpful..

@Rabi Hota They update whichever request you do.. you Just post your query to them.. they will solve.. they have solved lots of mine so you can try as well...
My experience is very great about @Definedge team
Could you please add a sort option in Chart Scroller like % - change ascending/descending.. A-Z sort.. etc
Because when we need to scroll Nifty 500 or more then 100 stocks it is very frustrating to start from A to Z and always confuse which are top gainer or loser on a particular day or checked time in the selected group...

Could you please allow the price scale to expend and shrink so that we can see the values of the CPR or other different types of levels... it is also not visible in the left commentary bar.. so how can we understand this levels..
and allow it to all chart types like PF, Renko, candles HA etc.

could you please add a new condition Near 52 week high in ratio scanner... condition like 3-5% range from High...

@Definedge When will it be update?? waiting since February..
@Definedge thank you to accept this suggestion...
For more ideas go to the Atlas Dashboard on chartink site... It is my humble request.
please suggest how to trail it..
Could you Please Add the TOI feature in Rzone Scanner as well as on deshboard... just like you have added in mobile app..
Can we make a personalized dashboard in RZone so that what scanners we have made can Pined... and a small refresh button... so that it will real time scan...
No response by @Definedge till now...
No responses by @Definedge till now...
+1 we must need... Sometimes chart stuck and we have to refresh the full page.. so it must..
Please add Breakeven in percentage from spot...

@Prashant Shah Thank You sir..
Please provide Users saved groups to copy in Watchlist and auto Update feature as we change user defined groups stocks...

@Rajesh Khadkikar
I also want to know!!
Could you please provide greeks of the options in the description... And what are the other necessary according to you?? Mension in the description..
bolded text
BDL in all Percent frame..

BDL sustaining it's level.. lets see what will happen

Try this video and also search D smart indicator query on Youtube... you will get lots of videos by Definedge .
Introducing D-SMART - The Intelligent Fusion of Multiple Studies! | Definedge | Prashant Shah |
earlier I was also have doubt in this... then I dig in deep
firstly understand this slide..
it works in both PF as well as Renko..

BDL Stocks near Breakout.. made Double Bottom already.. keep it on radar

Stock filtered through Top-Down Approach.. a must watch video in Definedge universe..
A method of picking winning stocks | Prashant Shah | Mangesh Joglekar Definedge #Marketरुबरु | Ep 16
Problem resolved thank you...
session expired in every 2 min

@Nishshkumar Jaani,CFTe on candle chart or P&F and breakout trade in intraday or daily could you please explain, sir..
@Ajay Chaudhary
Try this A Proven Intraday Momentum Trading Strategy By @Prashant sir
could you please provide a lots size calculation view on mini size or replace quantity with lots like 11 lots - 17 lots..

Why can't we change denominator just like the nominator in RS chart... as well as in strangle or straddle chart without opening another chart?
please update it.


@Definedge when will it going to resolve..?
Could you please add a Refresh button on chart. Sometime Chart was not update automatically due to any reason and when I refresh the whole page it will loose my all script ...
@CHITRA V , Yes this is a different segment so you have to submit it... but if you are not trading it so why are you activating it; Sir is already posting #MKLH chat.. analysis it that's all..
@CHITRA V , you need to activate Currency Segment in Account Details page..
may I ask which box size is this ??
@Rajesh Rohra If you set your Timeframe to 1 min it will not repaint... But it will narrow down your view to intraday to 1 week depending on how price move...
Could you make a video on Options Trend Scanner, how to use it...

Could you please add the function Onetime or Every time Buzzar ... So that every time stocks pass the criteria of the strategy it will buzz.. it will very useful for Intraday Traders.

@Definedge ! also it is not in candlestick chart...

As Prashan sir says never go to the debate of which is the best charting method...
It is a subjective thing...
Start with Renko chart eventually you will understand both of them.
@Dhanapal-PERIASAMY @Vishal-Shah Thank you
Could anyone please explain these values CR, CB, HP, LP?
Because I have seen lots of video but It is not mention..

@Definedge thanks, could you please add stock volume as well
Could you please provide the RANGE in look back period like 0 to 5 candle or columns.. so it would be very easy in options ...

Interesting study Nifty FMCG sector is more then 70% of the time has showed Bullish strength in next three to four month from March on words... and when checked Breadth chart, it is 0 on 13 Feb 2024

to Understand check this Video :
Understanding Seasonality Analysis of Stock Market | Brijesh Bhatia | Definedge Securities
in Trividh Strategy Scanner current and average Volume represent all Options cumulative volume or Stocks's (1h) volume... and Adapt

why cmp line is not drawn on chart as well as indicator values on price scale ??

Could you please add the options in DSmart indicator like turtle, pullback, star(disparity)..
Just like it is available in TradePoint..

Could you please remove redundant option strike price from zone mobile app which is displayed in the every stocks' f&o section... Displayed only limited strikes whatever parameter you decide..

could you please provide the Feature Screenshot or copy image just like the save image feature in Trade Point or Copy image in Trading View so that one can take a high resolution picture for sharing or saving. But with Definedge LOGO at Right or left Bottom..
If someone is confuse to study the Noiseless chart, So SRF is the good example of it...
A Flag and Pole pattern is clearly visible in it..
