Sarda Energy: Base Formation with Spread Pattern Breakout
-
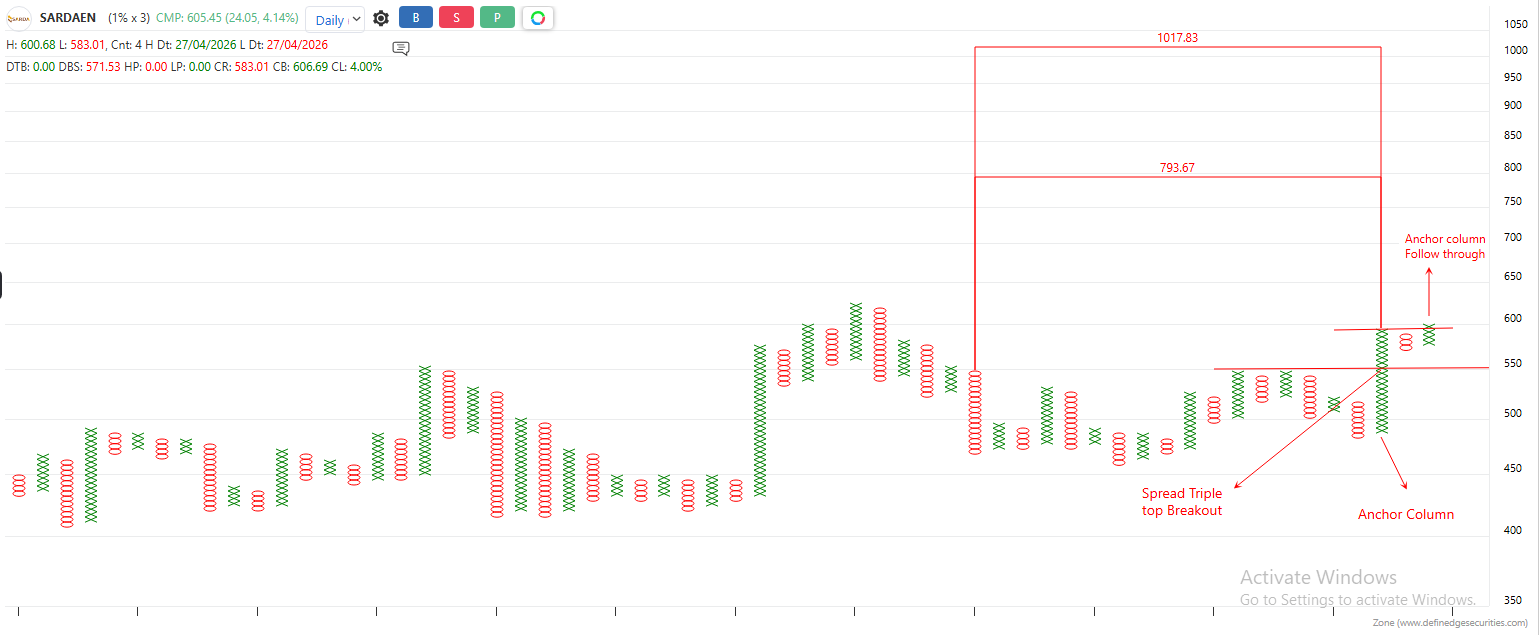
Looking at Sarda Energy on the Point & Figure (1x3) chart, the stock is currently consolidating after a strong uptrend and forming a healthy base.
An anchor column is visible, followed by a follow-through breakout, showing continued strength. The chart has also formed a spread pattern breakout, which is a 7-column structure — the 3rd column falls short, the 5th and 7th columns form at similar levels, and the final column gives the breakout, showing gradual accumulation before the move.
Horizontal counts have also been plotted, which give an idea of the possible zones where the move can extend.
Overall, the structure shows base building followed by a breakout, which can be watched going forward.
If the pattern continues, strength may sustain. However, if the price closes below the anchor column, it may indicate weakness and the trend could change.
Sharing this as a chart-based observation for learning and discussion.