The Smile That Tells You Everything
-
All option strike prices will have different IVs. High IV shows that options are expensive and low IV shows they are comparatively cheap. When we plot the chart of various IV of Options, the curve looks like a smile. It is known as a volatility smile.
The chart shows that ITM and OTM strike prices are relatively expensive compared to ATM strike price options. The IVs of ITM Calls, OTM Puts, OTM Calls and ITM Puts are relatively higher than the ATM Call and Puts.
A Volatility Smile chart assumes that equidistant strike prices of Calls and Puts will have the same IVs and when we plot them on the chart we will have this smiley curve.The demand for calls and puts at equidistant strike prices is assumed to be the same.
But practically, things can differ.
When there is an imbalance in the IVs of OTM Puts and OTM Calls, it is known as volatility skew. The demand for put options compared to call options can differ. If the IVs of equidistant OTM Calls are higher than equidistant OTM Put options, then volatility is skewed towards the upside. This indicates that there is a higher demand for the calls.
When the IVs or demand for equidistant calls or puts differ, it results in a volatility skew. The chart will not look like a smile. It will be skewed on one side.
There are two types of volatility skew: Reverse skew and Forward skew.
When OTM Puts are more expensive than the equidistant OTM Calls, it is known as Reverse Volatility skew.
Therefore, when demand for calls is higher than the puts, the IVs for calls are higher than the puts - it is a forward skew. When demand for Puts is higher than the calls, the IVs of puts are higher than the calls - it is a reverse skew.Forward skew is bullish and Reverse skew is bearish.
Currently in nifty OTM Puts are more expensive than the equidistant OTM Calls, and as we know , it is known as Reverse Volatility skew.
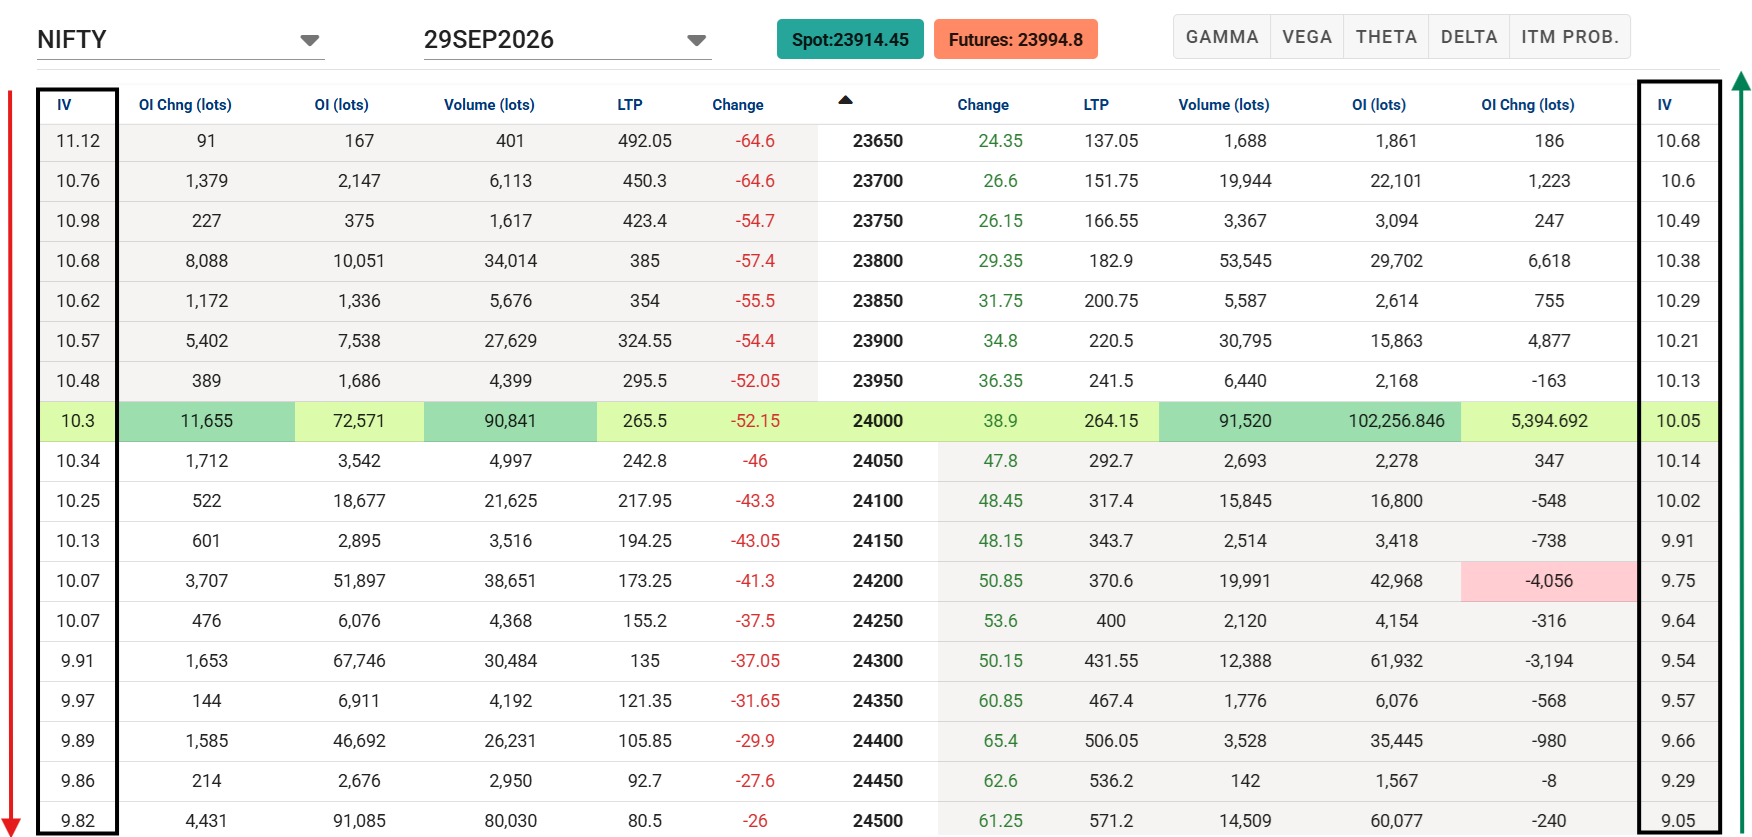
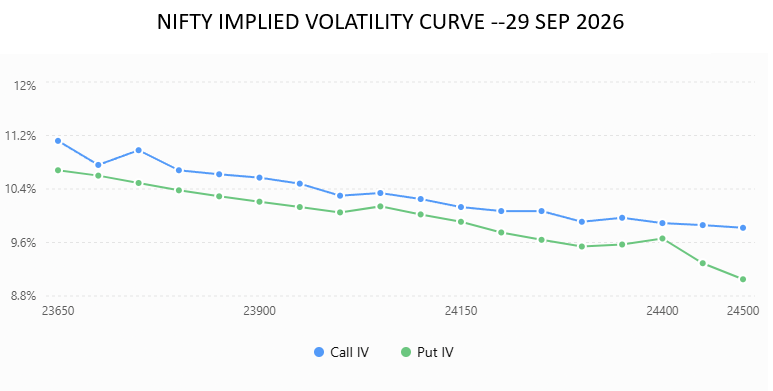
There is a reason why this happens: the reason is that markets are bearish for some reasons and there is more demand for puts. These factors can make the put more expensive than calls. Similarly, when markets are very bullish and in strong trends, the demand for calls can be higher than the puts.
Put Ratio spreads are more favorable when there is a reverse skew because put options are more expensive. The debit put spreads will be cheaper than the call spreads in such a case.
-
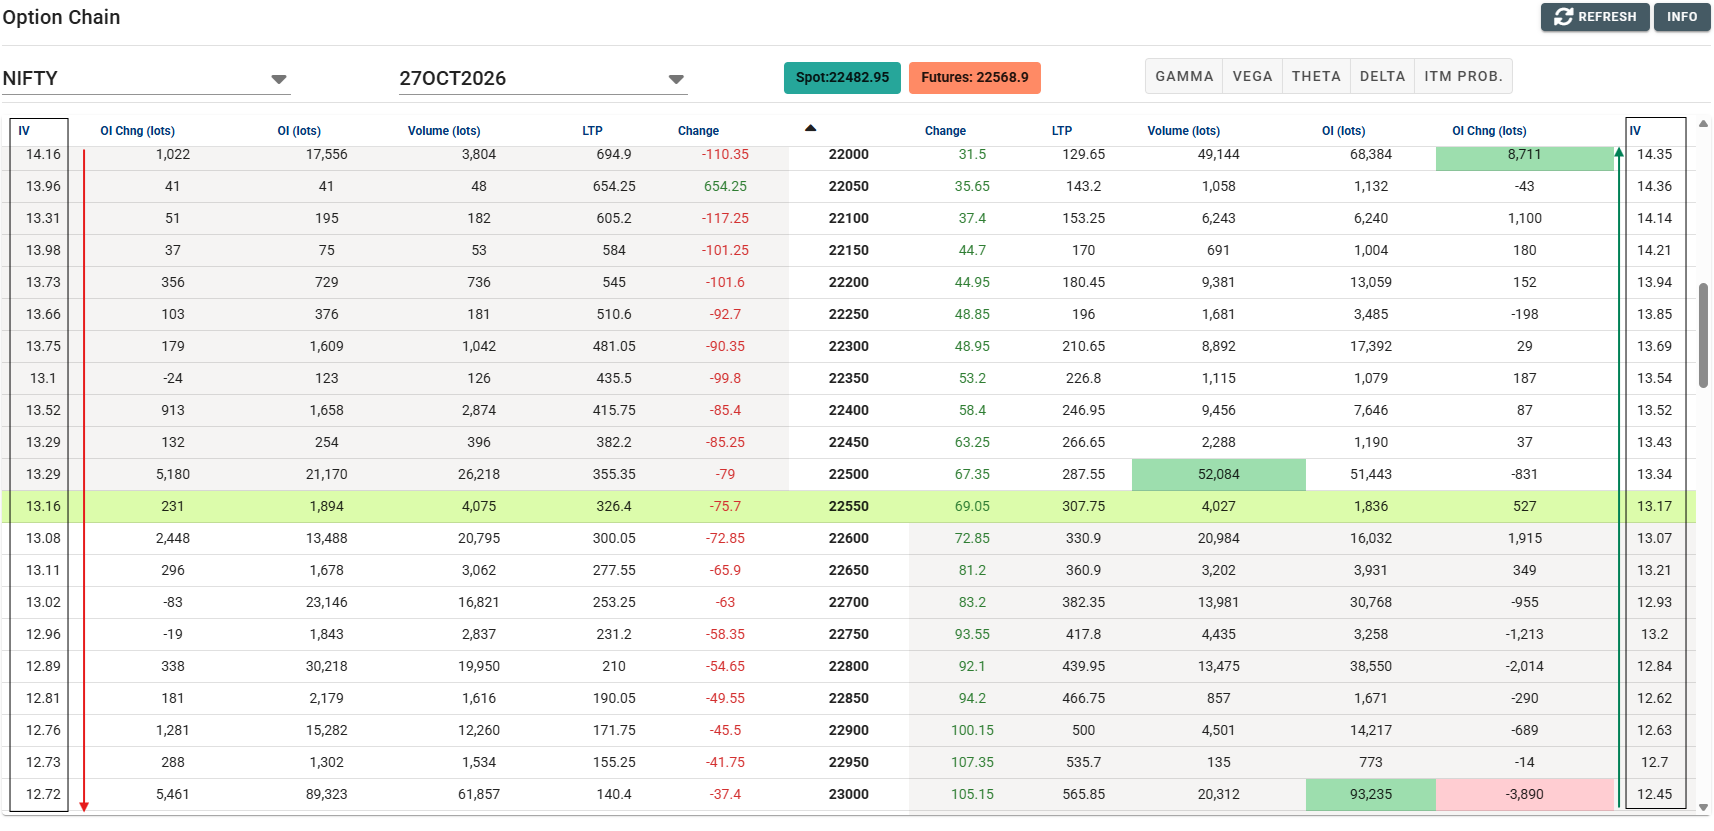
In September, I wrote about how OTM puts on Nifty were trading at higher implied volatility than equidistant OTM calls, a pattern known as reverse volatility skew. Now that it's October, I checked the option chain again, and the structure has not changed. OTM puts are still more expensive than OTM calls at the same distance from ATM, which tells us there is still steady demand for downside protection.
A persistent skew like this is not a one-day event. It suggests traders continue to hedge or position defensively, even after a month has passed. For option sellers and spread traders, this matters: the richer put premiums continue to favor structures such as put ratio spreads, and debit put spreads remain cheaper than comparable call spreads.
As always, skew shows positioning and sentiment, not a prediction.