Where Is Relative Strength Emerging?
-
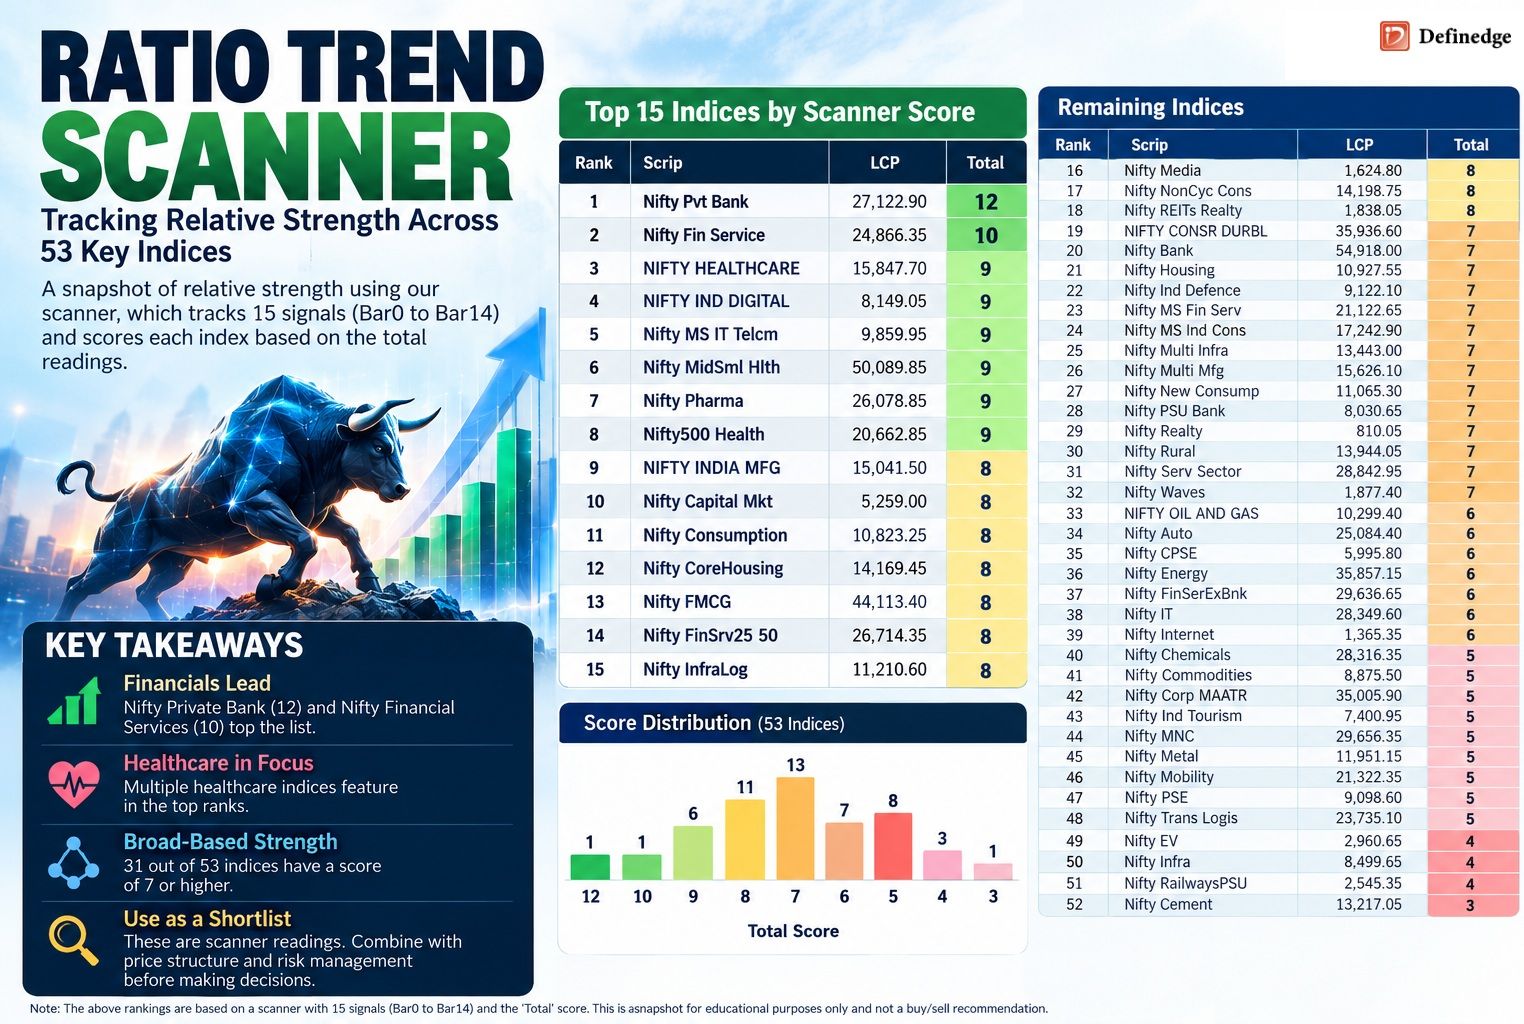
The 53 indices and ranks using the scanner's Total score alongside 15 signal columns (Bar0 to Bar14).
The clearest standout is Nifty Private Bank, with a score of 12, followed by Nifty Financial Services at 10.
Healthcare-related indices, including Nifty Healthcare, Nifty Pharma and Nifty MidSmall Healthcare, also feature prominently, each scoring 9. Nifty India Digital and Nifty MidSmall Telecom are in the same score group, suggesting that financials, healthcare and digital-related indices deserve closer examination.
A broader look reveals that 31 of the 53 indices have scores of 7 or higher. This indicates that elevated scanner readings spread across several market segments rather than concentrate in just one index. However, the score is a scanner output, not proof of future outperformance.The practical takeaway is to use the ranking as a shortlist for deeper analysis. Traders can examine the underlying ratio charts, price structure, breakout levels and volume before making a decision. Relative strength can help identify where capital may be finding opportunities, but confirmation and risk management remain essential.
The data does not establish the observation date or define the individual signal labels, so these rankings should be treated as a snapshot, not a standalone buy or sell recommendation.
-
Sir please explain the process of the sbove how to run this
-
Dushyant Thakkerreplied to Muhammed Zuber Saleem Mansoori on last edited by Dushyant Thakker-1733574956821
@Muhammed Zuber Saleem Mansoori
In RZone Analytics --> Matrix: Price & RS --> Ratio Trend Matrix - Scan on 'NSE All Sectors' or 'NSE All Indices' . Since this is ratio so we need a denominator. We are trying to see what sectors are really stronger than the market. We use 'Nifty 50' as it represents the market index. You can also use Nifty 500 or 750 if you want a broad market view or total market view. You can see the total and sort.
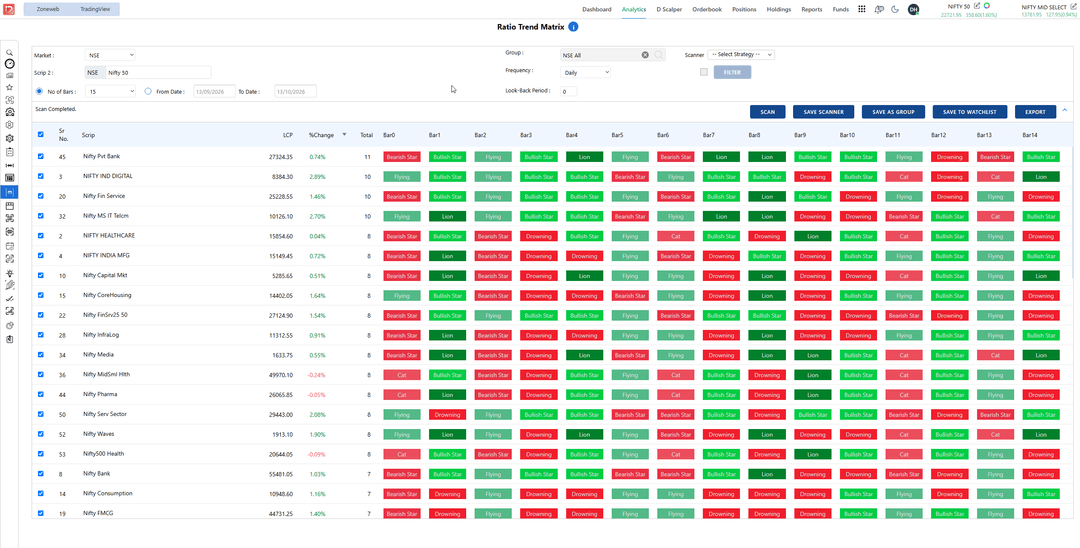
What Ration Trend Matrix does
Users can use this function to compare performance of a scrip to any denominator of their choice. Each candle in the user selected period is divided into 6 patterns:Bullish patterns:
Flying: Scrip is rising, Denominator is rising & Ratio is rising.
Lion: Scrip is rising, Denominator is falling & Ratio is rising.
Bullish Star: Scrip is falling, Denominator is falling & Ratio is rising.Bearish patterns:
Drowning: Scrip is falling, Denominator is falling & Ratio is falling.
Cat: Scrip is falling, Denominator is rising & Ratio is falling.
Bearish Star: Scrip is rising, Denominator is rising & Ratio is falling.For each candle in bullish pattern score of 1 is added and for bearish patterns score is zero. Thus, users can see relative performance of their scrip vs the denominator for each candle.
You can watch this video on youtube to learn more.
There is also a video on Insight.A Sample Strategy
For ideas on how to use this, pls read Asset, Sector & Stock Selection and Top Down Approach. They are must read in Prashant Shah's book on Relative Strength. In short, identify asset classes --> identify sector / indices --> then drill down into individual names.In above example we are seeing Nifty Private Bank is relatively strong... now what stocks in that sector --> do same scan on "Pvt Bank Index"
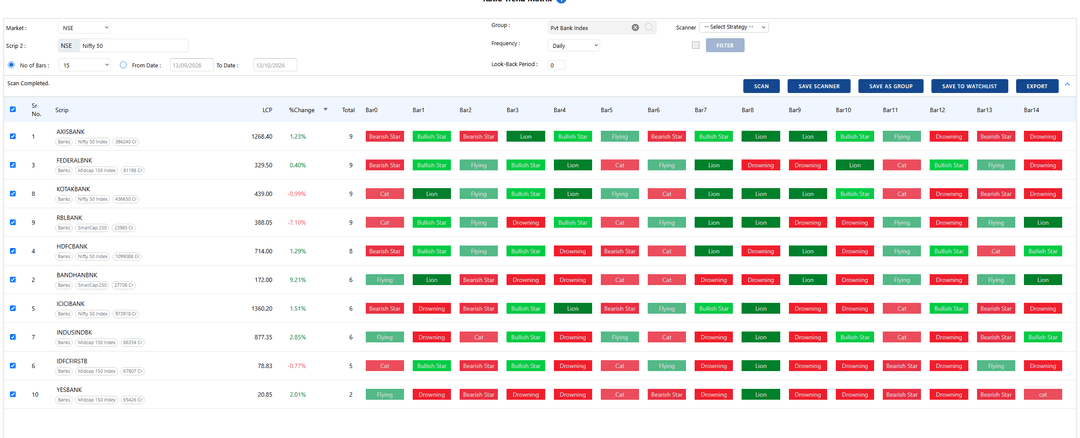
You can explore and combine many such ideas.
Good luckRegards,
dushyant