Please add Date in the X axis of P&F and Renko Charts
-
Dear Team,
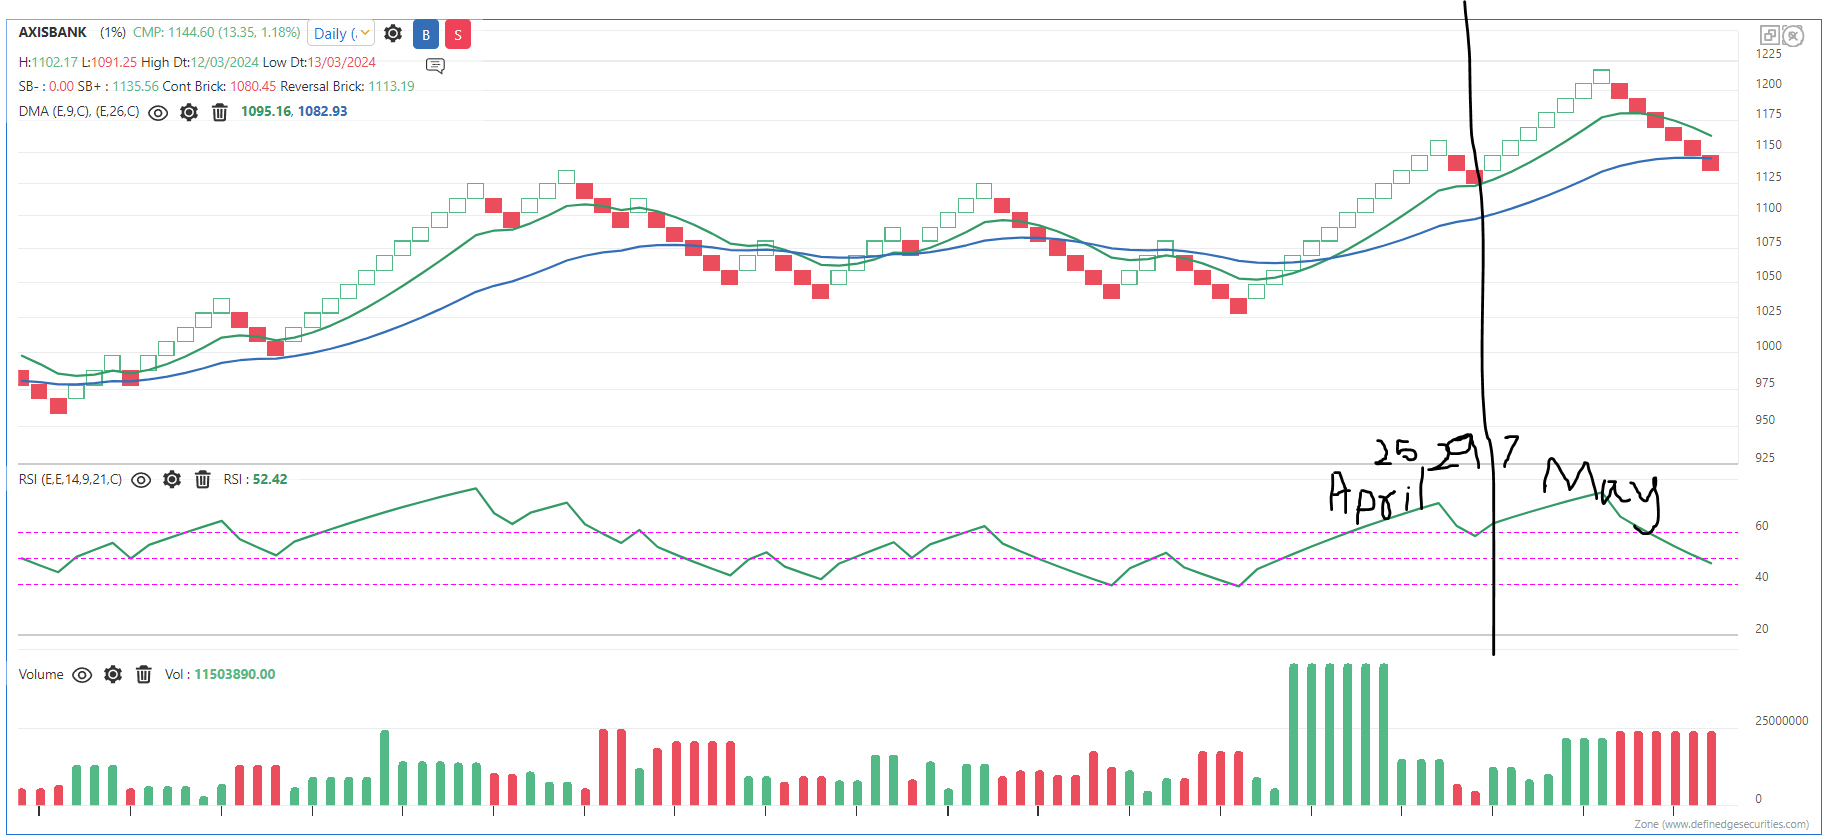
In P&F and Renko charts provided in Zone web, if we want to see the dates, we need to see in the header where open and close prices are mentioned which makes analysis a little difficult. Here, X-Axis or Horizontal Axis actually represents the time, or the date on which the column or box occurred. Hence, request you to add 'Date' in the X axis so as to easily understand the chart, and we don't have to keep looking for dates on the top column which is not easy for visualization.
-
We have taken note of your suggestion and the same has been forwarded to the concerned team.
-
Hello Team, plotting Year, Month at least and some significant dates on Noiseless charts will make it more visually appealing and easy to read. For example, at present, in a PNF chart, we need to keep pointing our cursor on one particular column, then look at the data on the top left menu to understand which are the days, how many days it took to build that column. We also need to check one earlier column and one next column to get the feel of the time. It will be much more simpler if the dates are plotted on x axis or if it is not possible to build in chart then some indicator which can give info about date on bottom of the chart. Please consider this feature request.