Worried About the Downtrend? Could the Market Bottom Be Near?
-
Worried About the Downtrend? Could the Market Bottom Be Near?
They say fortunes are made in bear markets. What you can earn in one year of a downtrend might take a decade in a bull market.
If that is true, why do traders panic when markets fall?
Investor portfolios are declining, and sentiments are low. But why should traders be worried?
Because they are not prepared.
A bearish market or a downtrend is a golden opportunity for traders who follow a systematic and process-driven approach. Bull markets can create bad habits that lead to trouble when the trend reverses.
Investors too make the mistake of not ensuring timely exits from stocks, often leading to getting trapped. They constantly search for support levels during a downtrend, hoping their stocks wouldn’t decline further. But hope is not a strategy.
In a bull market, almost everything works, and it’s easy to believe you have mastered trading. But the real test comes when the market trend changes suddenly.
So, how can you stay prepared and adapt to any market condition?
By becoming a disciplined trader with a strong trading system in place.
Will market form a bottom and bounce from current levels since it is extremely oversold?
Your process and system should provide an answer to this question, rather than relying solely on your judgment. If judgment is involved, it should be backed by meaningful and well-grounded analysis and a well-defined process.
There are countless trading systems available.
But here is the catch: while trading systems can be borrowed, conviction cannot.With countless strategies and trading courses out there, it’s easy to feel overwhelmed. But within this challenge lies an opportunity—the chance to create a system that aligns with your unique approach. That is where your true edge lies.
See below chart.
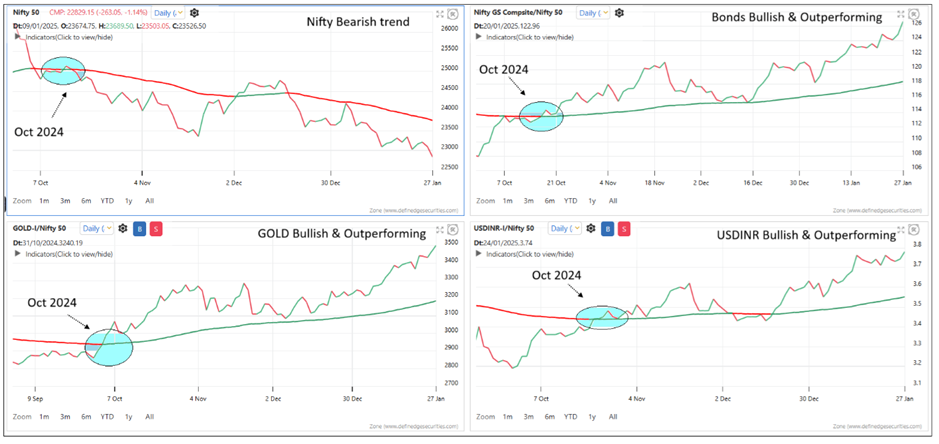
The first chart displays the Nifty line chart. The second chart compares the Bond Index versus the Nifty through a ratio chart. The third chart shows the Gold versus Nifty ratio, and the fourth chart plots the USDINR versus Nifty ratio. A 100-period EMA (Exponential Moving Average) is applied to all these charts as a medium-term trend filter.
When the Nifty chart moves below the moving average, it signifies a bearish trend. If other asset classes remain above their respective moving averages, it indicates Nifty’s underperformance relative to those asset classes, suggesting that money is flowing out of equities.
To simplify analysis, I have used ratio charts with a medium-term moving average, making the concept easy for everyone to grasp. However, for those familiar with P&F (Point & Figure) charts, I recommend plotting this equation on P&F charts for deeper insights.
This template is easy to create on the Zone platform. Here's how:
-
Visit zone.definedgesecurities.com.
-
Click on Layout and select four charts.
-
Configure the charts as follows:
- Chart 1: Line chart with the Nifty 50 symbol.
- Chart 2: Ratio chart:
Scrip 1: Nifty GS Composite
Scrip 2: Nifty 50 - Chart 3: Ratio chart:
Scrip 1: Gold-I (MCX segment)
Scrip 2: Nifty 50 - Chart 4: Ratio chart:
Scrip 1: USDINR (CDS segment)
Scrip 2: Nifty 50
If you don’t have access to the CDS segment, you can use Crude Oil or the Nifty Mid-Small 400 Index as Scrip 1 for Chart 4.
At Definedge, we focus on creating a process that gives you an edge and helping you become a disciplined trader. Our complete ecosystem of proven tools is designed to support your success.
We’ll explore more strategies like these in the Free Webinar I conduct every month, exclusively for Definedge Securities members.
Join us to learn and enhance your trading approach!
Prepare yourself to thrive in any market condition. See you at the webinar!Regards,
Prashant -
-
sir can we also have dollar index chart
-
@Prashant-Shah Sir, what is logic behind replacing USDINR with Nifty Mid-Small 400 Index?
-
A admin moved this topic from Ask Prashant