Nifty Pharma Index: Gearing Up for a Breakout?
-
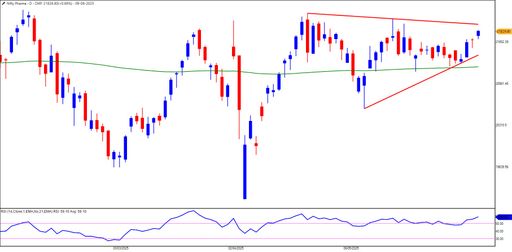
Nifty Pharma index is trending within a symmetrical triangle pattern on the daily chart, a classic formation that often precedes a breakout. What adds conviction to this pattern is the base of the triangle forming above the 200-day Exponential Moving Average (200DEMA), a key long-term support indicator that signals strength in the underlying trend.
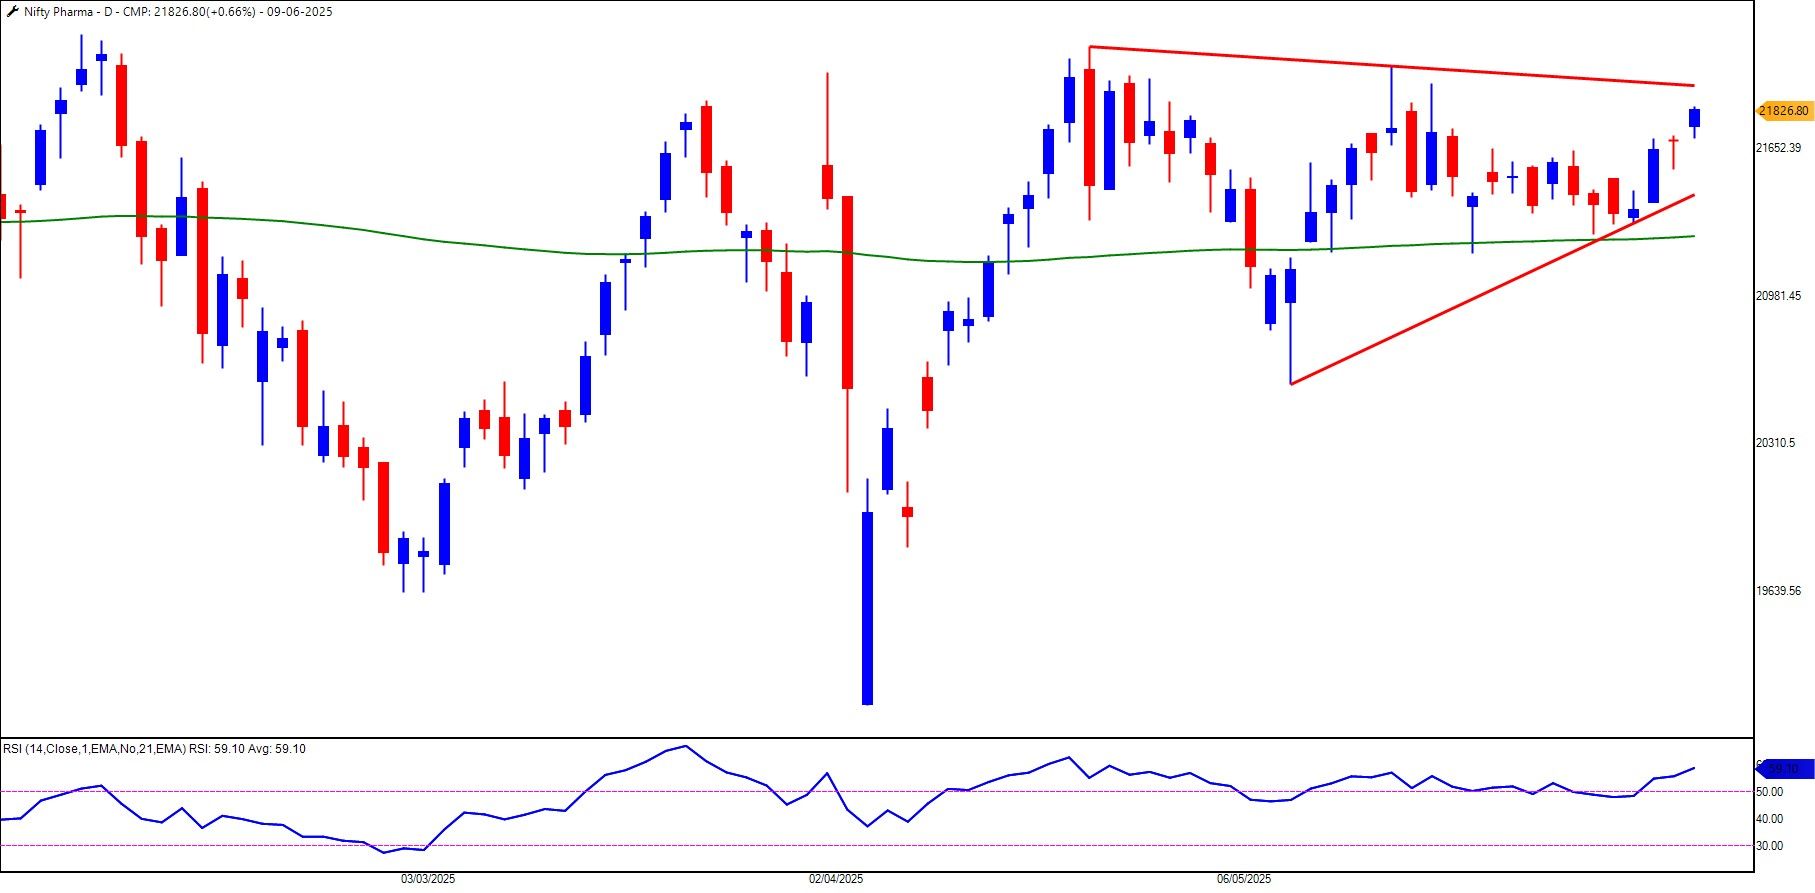
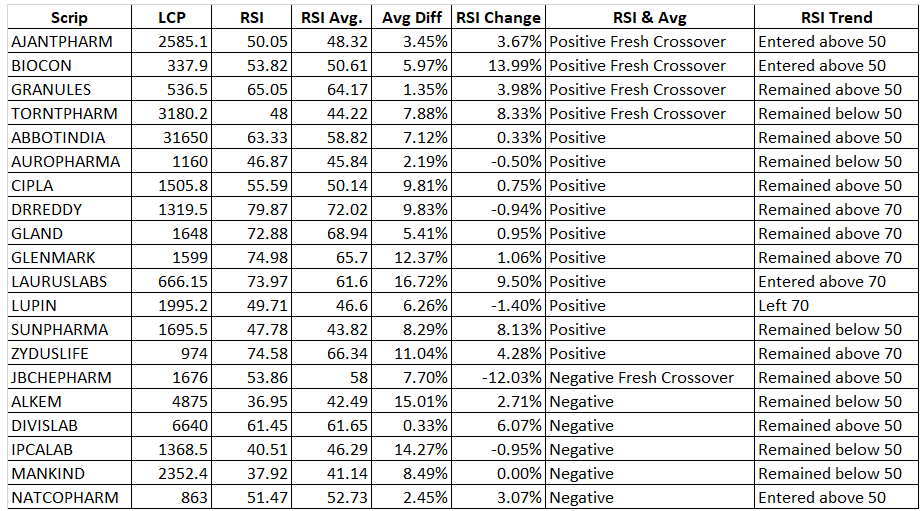
What truly caught my eye is the Relative Strength Index (RSI) performance of the index’s components. Using Indicator Digger, I analysed the RSI values across all 20 constituent stocks of the Nifty Pharma Index. Interestingly, 15 out of 20 stocks show a bullish RSI structure in the daily timeframe. This widespread strength beneath the surface suggests that there is accumulation happening across the sector — a potential precursor to a broader move.
-
Good stuff. Thank you. Can you please help to understand RSI Avg, Avg. Diff and RSI change is calculated or the Indicator Digger pulls this data?
-
I just happen to find the session on this. @Brijesh-Bhatia . This was a good and detailed coverage.
Please take up a session how to isolate the strategy and and pick one or two. RZone has the ocean of it.
")
 Mastering NIFTY Trend Days with 200± Straddle, CAM Levels, and VWAP: The 30th June 2025 Case Study