10/07/2025
-
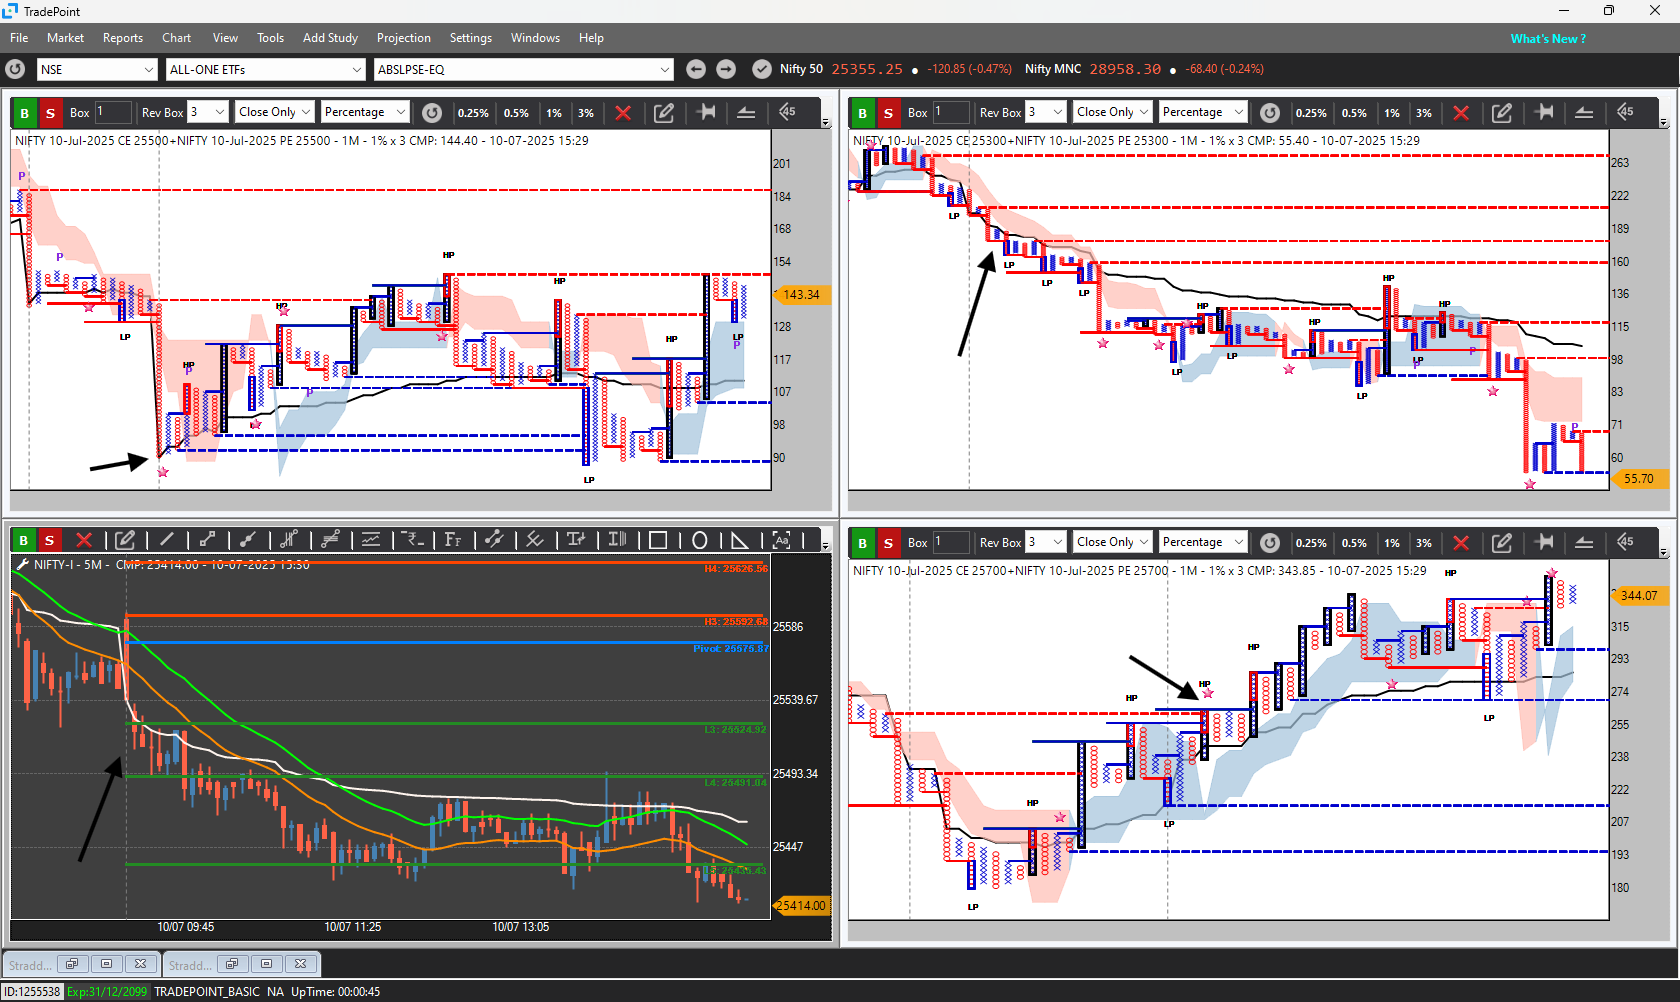
In the spot chart, we observed that the market opened near the H3 level and the PRB mid-level. This suggests that the market took support from that zone, although it formed a big red candle initially.
Based on the opening price action, we plotted the 25700 and 25300 straddles in our setup. We also considered the 25500 straddle due to the highest Open Interest (OI) at that strike.
At the time of market opening:
• The 25300 straddle was trading below VWAP, previous day’s low (PDL), and also below the D-Smart level.
• On the other hand, the 25700 level was trading above the D-Smart level and above VWAP.
In the futures chart, the price was trading below the 21 EMA channel and showing a downward trend.
After a long time, the 25500 level turned bullish, which indicates that at least one leg of the straddle started making Higher Highs (HHs).
This raises the question: How can we predict that the 25300 straddle is becoming weak and moving down? -
https://forum.definedgesecurities.com/topic/3955/using-200-straddles-with-d-smart-to-decode-market-pressure-a-structural-approach by this we can see clearlt upper straddle 25700 become bullish & 25300 become weak as below d-smart , so 25300 short good with some personal stop-loss level with cam based or custom target