NIFTY 50 Technical Outlook – Short-Term Support Testing Zone
-
NIFTY 50 Technical Outlook – Short-Term Support Testing Zone
 Date: 28 July 2025
 Time Frame: 120 Minutes
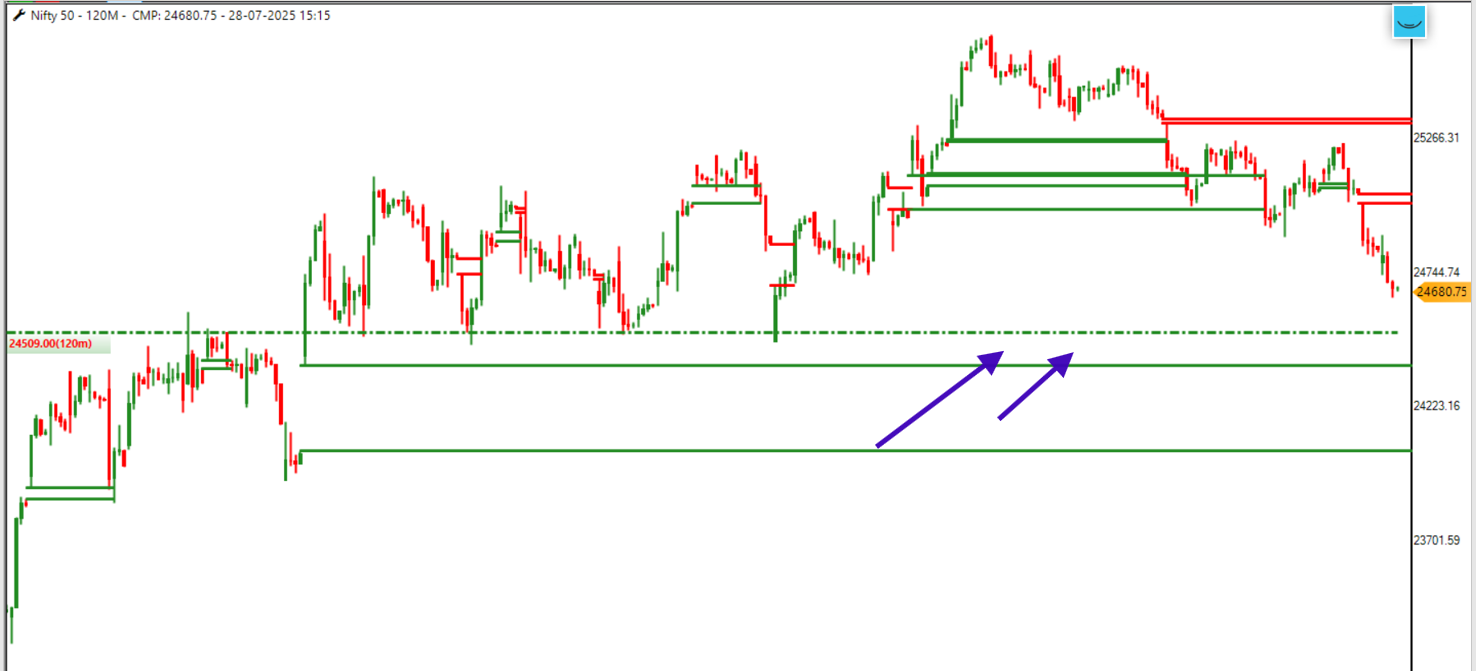
 Current Market Price (CMP): 24,680.75
 Recent Price Action: A Quick Recap
After attempting a rally toward 25,266, the index failed to break higher and faced a clear rejection from that resistance band. What followed was a steady descent, now taking prices below key minor demand zones (marked in green), with the index nearing a critical short-term support cluster between 24,390–24,500.
 Support Cluster Zone: 24,390–24,500
 The area marked with purple arrows on your chart highlights an important demand belt formed through:
- Multiple prior swing lows
- A base of accumulation zone
- Breakout retest area
This price band has historically acted as a springboard, rejecting bearish attempts and inviting fresh buyers in the past. The more recent bounce from this zone adds credibility to its structural strength.
 Key Technical Observations
-
Volume-Weighted Behavior: Though not visible in this image, if volume increases near 24,500 with a long lower wick or consolidation, that would affirm institutional defense.
-
Structure Breakdown Alert: A clean breakdown below 24,390 may invalidate the support. Below that, eyes shift toward the next major base near 23,900, indicating ~2% downside risk.
-
Resistance Above: Any upside relief rallies may face a ceiling at 24,744, followed by the supply wall at 25,266 (marked in red). This area needs a high-momentum breakout to flip trend.
 Bulls vs. Bears: Short-Term Battlezone
This 24,390–24,500 pocket is now a make-or-break support zone for bulls. If held:
 Expect quick 150–200 point mean reversion
 If broken, sellers could aggressively aim for 23,700 support
 Strategy Pointers
For Positional Traders:
- Watch price behavior on 15m–1H timeframes at 24,400 zone
- Look for bullish candle confirmation before considering long entries
For Option Sellers:
- A straddle/strangle can be considered only after market confirms base
- Implied volatility analysis needed before trade sizing
🧠 Final Take: “Respect Structure Until Broken”
The 24,390–24,500 zone is the last short-term fortress for bulls. If broken, the tone may turn risk-off. Hold it – and it’s a possible launchpad for short-covering rallies. Let price action and market tempo guide your next move.