NMDC: Strength Across Timeframes
-
Looking at NMDC across multiple Point & Figure (P&F) timeframes, the picture becomes clear.
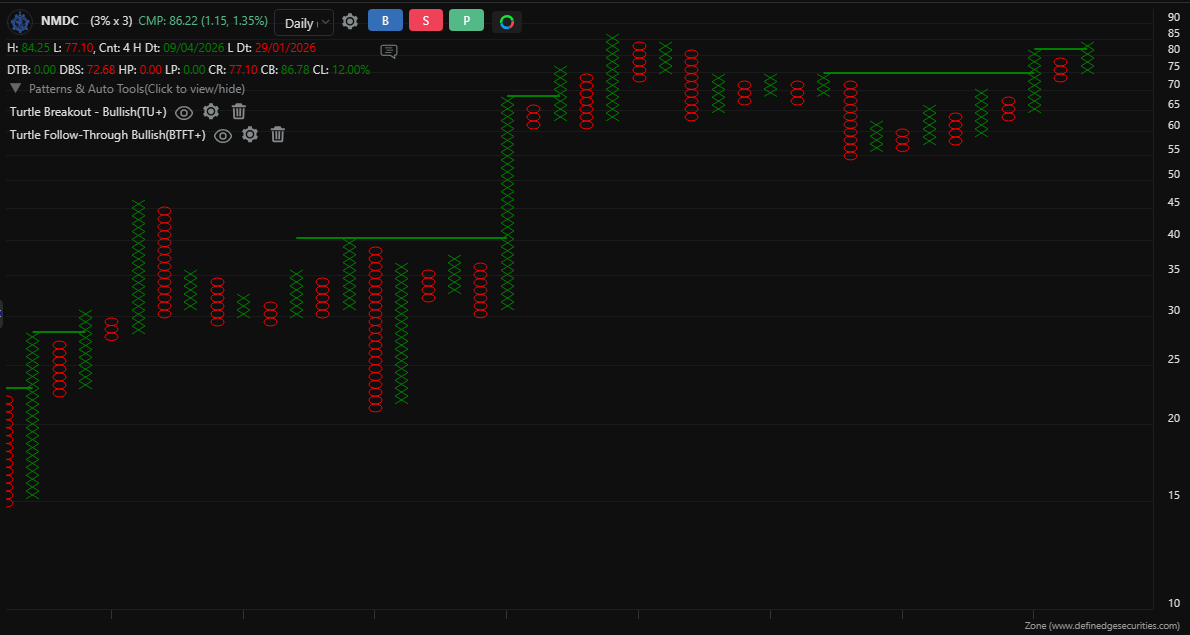
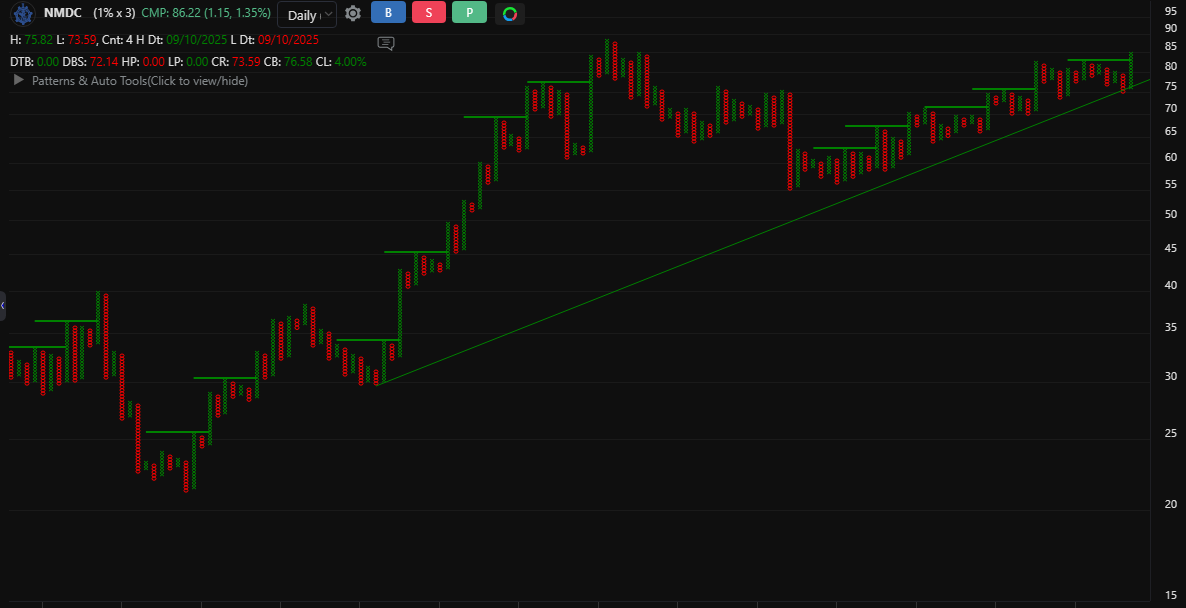
Higher box size shows a Turtle Breakout, while lower box sizes show rising support with higher lows, along with a 45° diagonal breakout, a simple structure of support holding and then breakout.
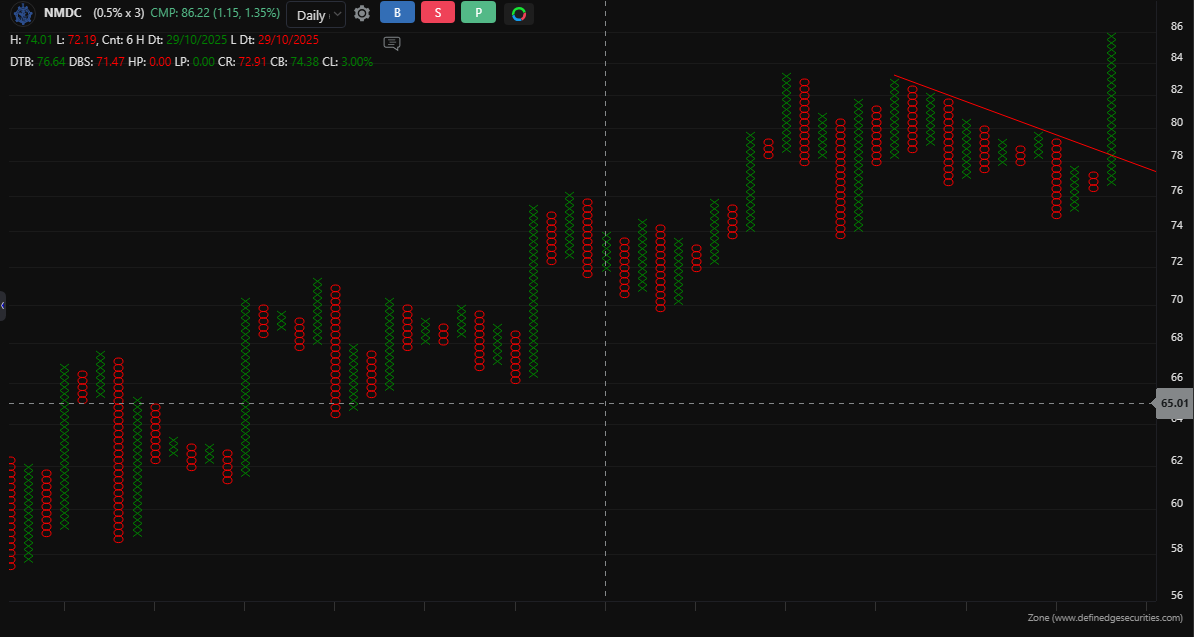
On the 0.5% chart, the structure is strong, but a large anchor column of X is visible. Entering here may not offer a favorable risk-reward, so it’s better to wait for a follow-through buy signal.
When a stock looks good on all timeframes, it means the trend is aligned and more reliable, not just a short-term move.