• Recent
  • Categories
  • 0 Unread 0
  • Popular
  • Tags
  • More
    • Guidelines
    • Disclaimer
  • Users
Skins
  • Light
  • Default
  • Cerulean
  • Cosmo
  • Flatly
  • Journal
  • Litera
  • Lumen
  • Lux
  • Materia
  • Minty
  • Morph
  • Pulse
  • Quartz
  • Sandstone
  • Simplex
  • Sketchy
  • Spacelab
  • United
  • Yeti
  • Zephyr
  • Dark
  • Cyborg
  • Darkly
  • Slate
  • Solar
  • Superhero
  • Vapor
Collapse
Definedge Forum Logo

Levels Based on VIX

Scheduled Pinned Locked Moved Suggestions & Feedback
3 Posts 2 Posters 148 Views
    • Oldest to Newest
    • Newest to Oldest
    • Most Votes
Reply
  • Reply as topic
Log in to reply
This topic has been deleted. Only users with topic management privileges can see it.
  • N Offline
    N Offline
    Nishshkumar Jaani,CFTe

    Pro User

    wrote on last edited by
    #1

    Hello prashant sir and Team definedge

    my suggestion is that the way we have pivot levels based on yesterdays close can we have levels based on VIX

    1 SD Up & Down levels (68.2 % probability that instrument remain in this range )

    2 SD Up & Down levels (95.40 % probability that instrument remain in this range )

    3 SD Up & Down levels (99.70 % probability that instrument remain in this range )

    That will help to find good support resistance-strangle writing for intraday etc

    @Prashant-Shah @Definedge @@Definedge-Experts

    Thanks and Regards

    Nishesh Jani

    1 Reply Last reply
    0
  • Neha Pandey Offline
    neha.pandey@definedge.comN Offline
    Neha Pandey

    Definedge

    wrote on last edited by
    #2

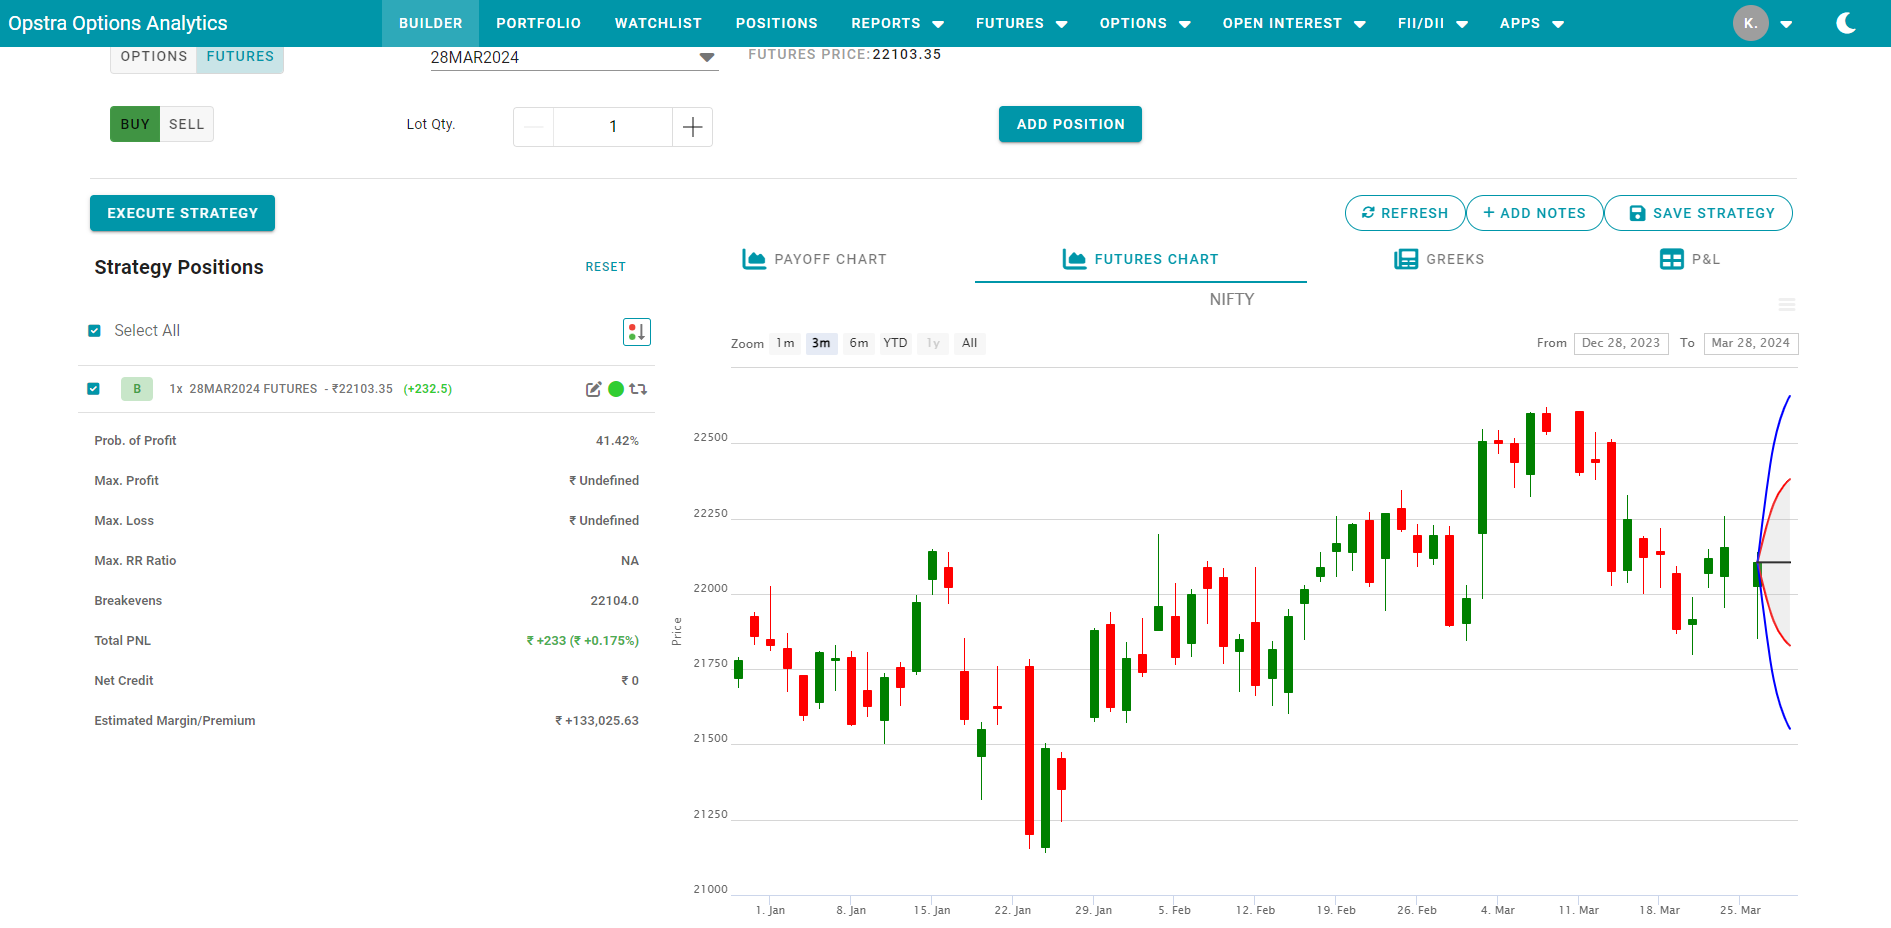
    We will look into the feasibility of co relating with Vix. However, this feature in Opstra is also widely used.

    You can refer Futures chart in Opstra, besides Payoff Chart in Strategy Builder, you can see 1 and 2 Standard Deviation curves on underlying Futures chart. Kindly find the attached screenshot for your reference:
    329a5f2d-d9bd-49be-b80a-177a45f0bc99-image.png

    1 Reply Last reply
    0
  • N Offline
    N Offline
    Nishshkumar Jaani,CFTe

    Pro User

    wrote on last edited by
    #3

    ok but on what basis this line plots -whats calculation behind it ?

    1 Reply Last reply
    0


Recent Posts

  • Sundeep Dedhia-1718521129700S
    Renko | Nifty Short Options | Swing Trading System
  • SANTANU BEZ-1707666167730S
    Boring vs Exciting Trading Systems: ROI, Pros, Cons, Mental Health, and Long-Term Truth
  • A
    OHLC chart
  • H
    Momentify login Not working
  • R
    Feature Request : Price scale Expansion and Contraction
  • Login

  • Login or register to search.
  • Blog
  • Youtube Videos
  • Refresh
  • First post
    Last post
0
  • Recent
  • Categories
  • Unread 0
  • Popular
  • Tags
  • More
    • Guidelines
    • Disclaimer
  • Users
  • Login

  • Login or register to search.
  • Blog
  • Youtube Videos
  • Refresh