Sector Momentum Analysis
-
Sector Momentum Analysis
Sharing some charts showing sector momentum analysis.
Sector momentum analysis
Using some simple examples to analyze trends and momentum.
-
RSI above 60
-
Price above multiple moving averages
-
Near the 52-week high
-
Swing analysis
If more stocks in a sector are in a strong trend and momentum, it shows the strength of the sector.
Currently, Nifty 50 index stocks are in momentum. If the reading of the sector is more than the Nifty, we can say that the sector is outperforming.
Below is data.
RSI above 60 can be defined as a strong momentum.
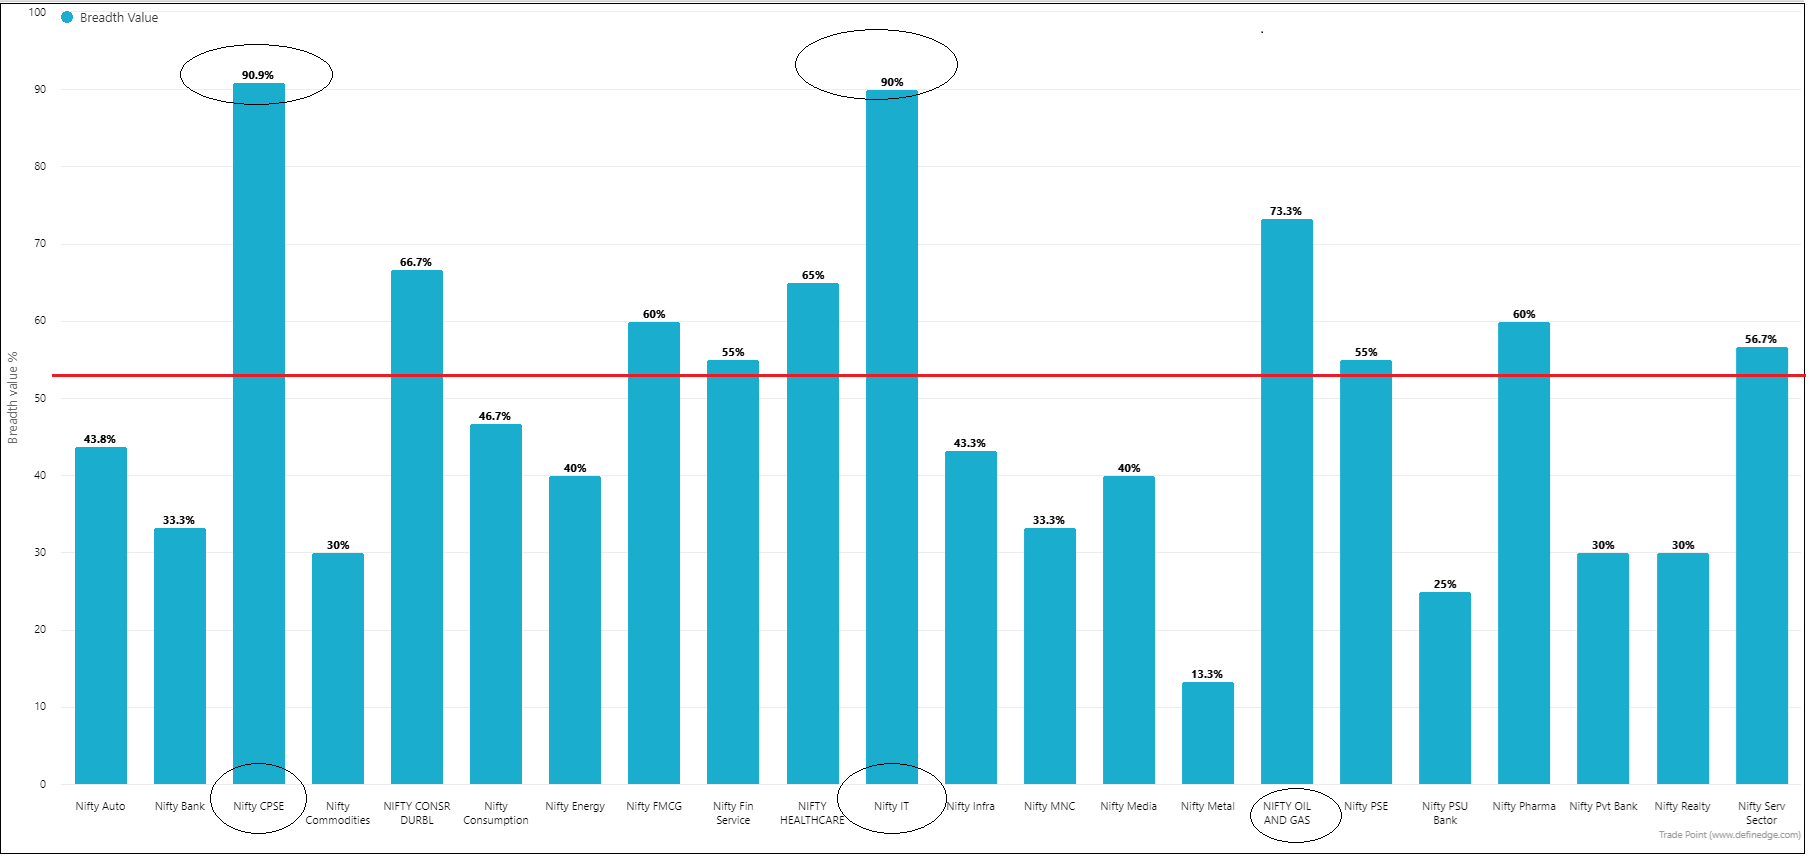
Chart showing sector wise reading of RSI above 60.
54% of Nifty 50 stocks and 41.50% of Nifty 500 stocks are trading above RSI 60.
Sectors with more than Nifty have better performing stocks.
Price above 20-day, 50-day and 100-day moving average shows stocks in strong uptrend and momentum.
Chart showing the percentage of stocks trading above all three averages in each sector.
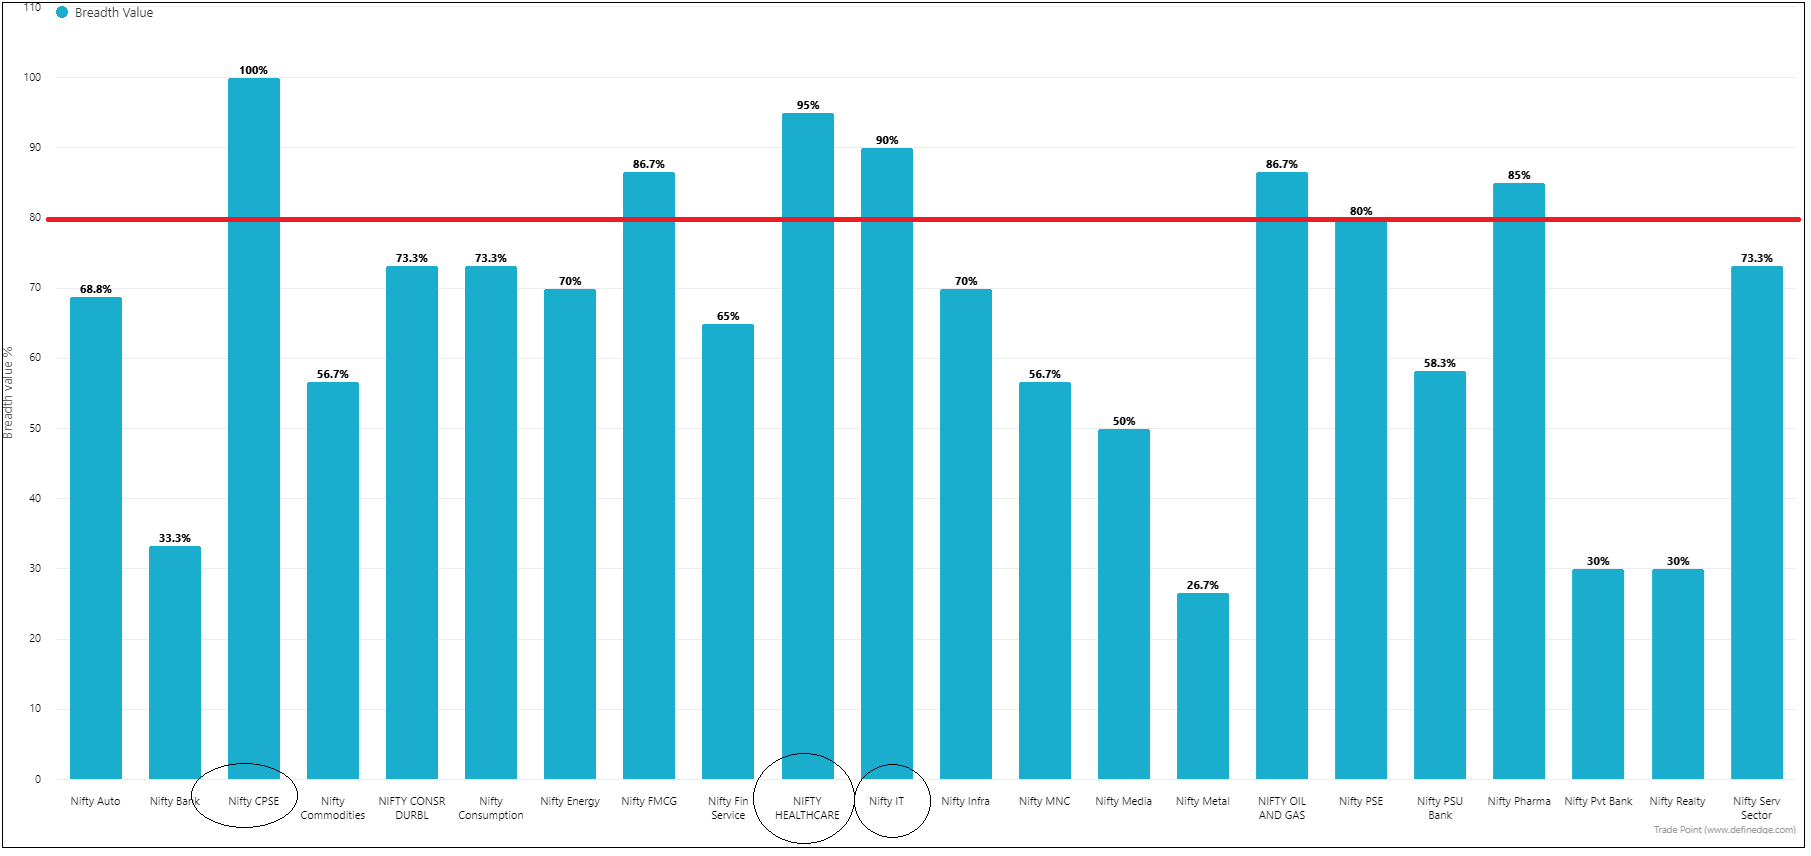
80% of Nifty stocks are trading above all three averages and 59.70% of Nifty 500 stocks are trading above all three averages.
Stocks trading within 5% of their 52-week high shows that the stock is in strong momentum.
Chart showing the percentage of stocks trading within 5% of their 52-week high in each sector.
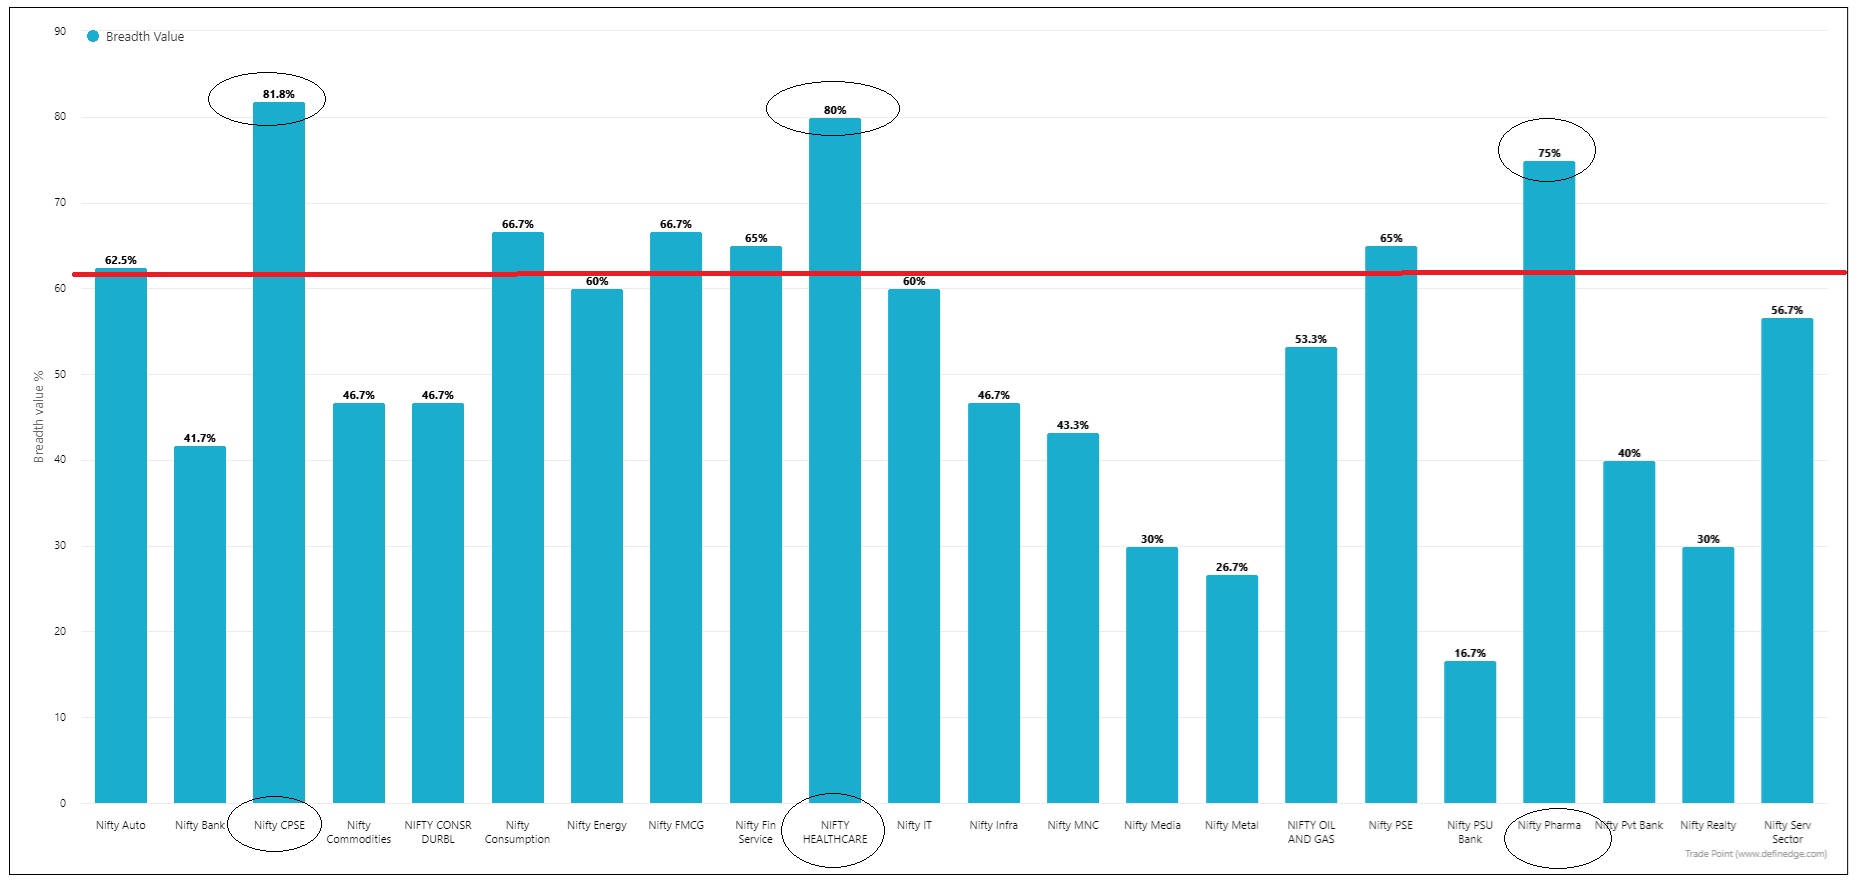
62% of Nifty 50 and 37.70% of Nifty 500 stocks are trading within 5% of their 52-week high.
P&F is a swing chart.
X% = Percentage of stocks in an uptrend
DT% = Percentage of stocks given a breakout
X% = Percentage of stocks with strong upside momentum - the higher the better
O% = Percentage of stocks with strong downside momentum - the lower the better
Nifty 50: 78% in uptrend, 60% breakout, 33% upside momentum, 4% downside momentum.
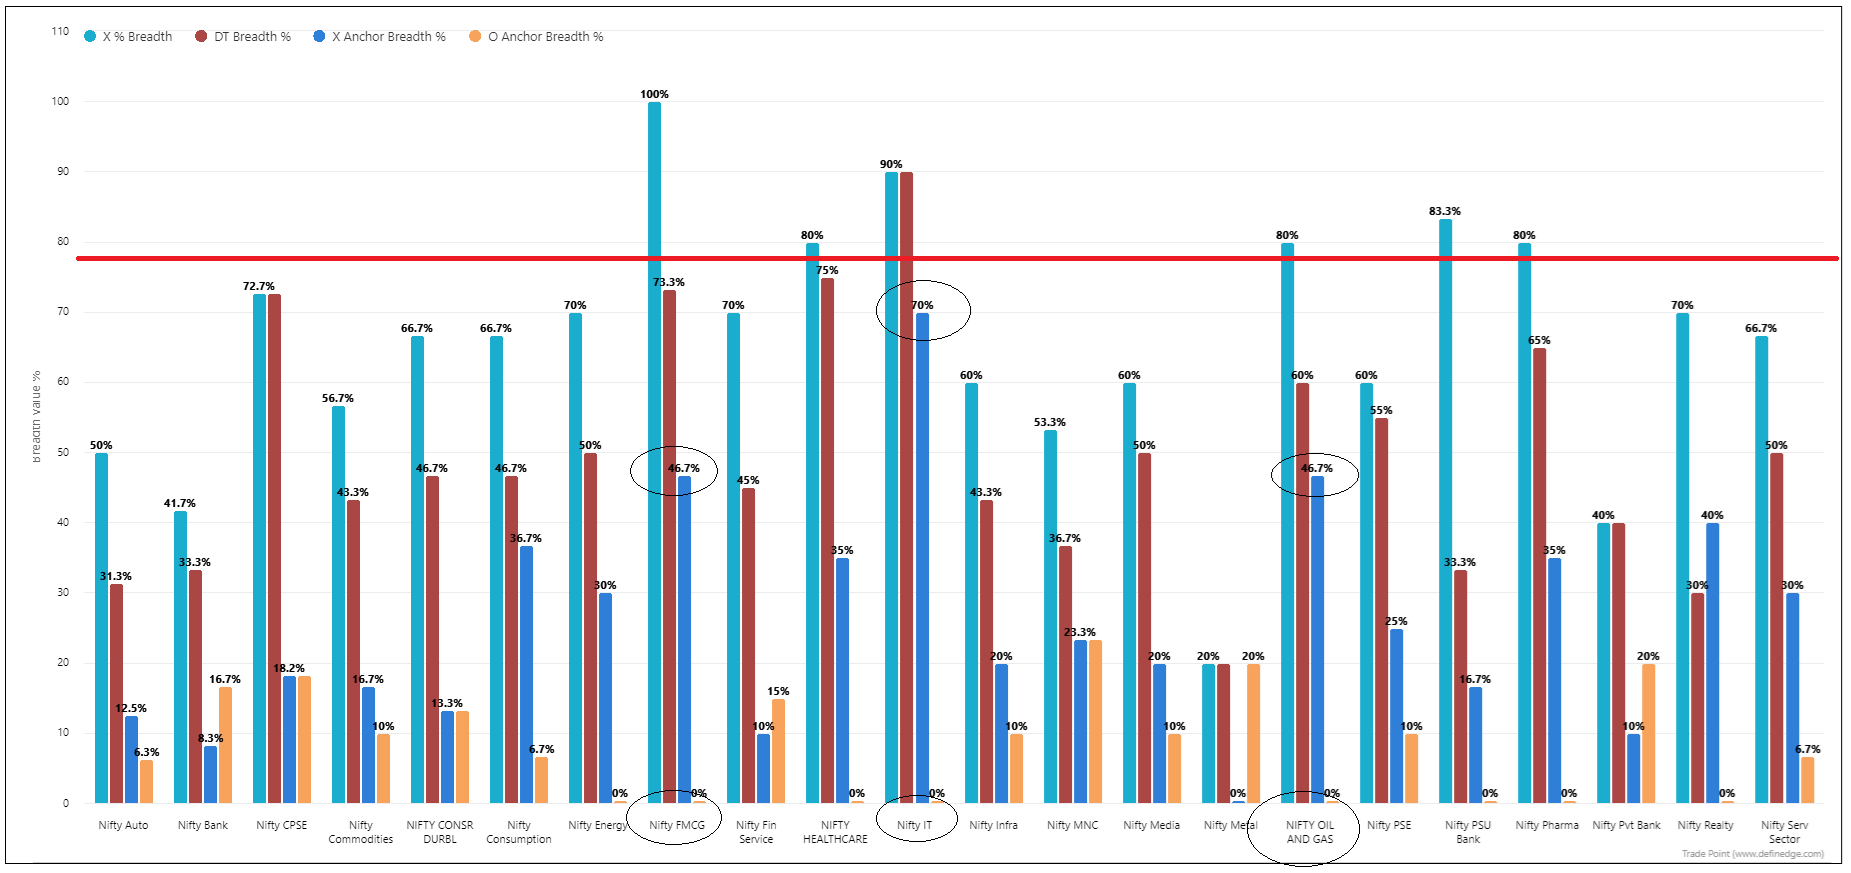
Sectors like CPSE, IT, Oil & Gas, FMCG are in momentum. More stocks in these sectors are in momentum than broader market indices.
These sectors may continue to remain in strong momentum in medium-term.
How about sectors turning to bullish momentum?
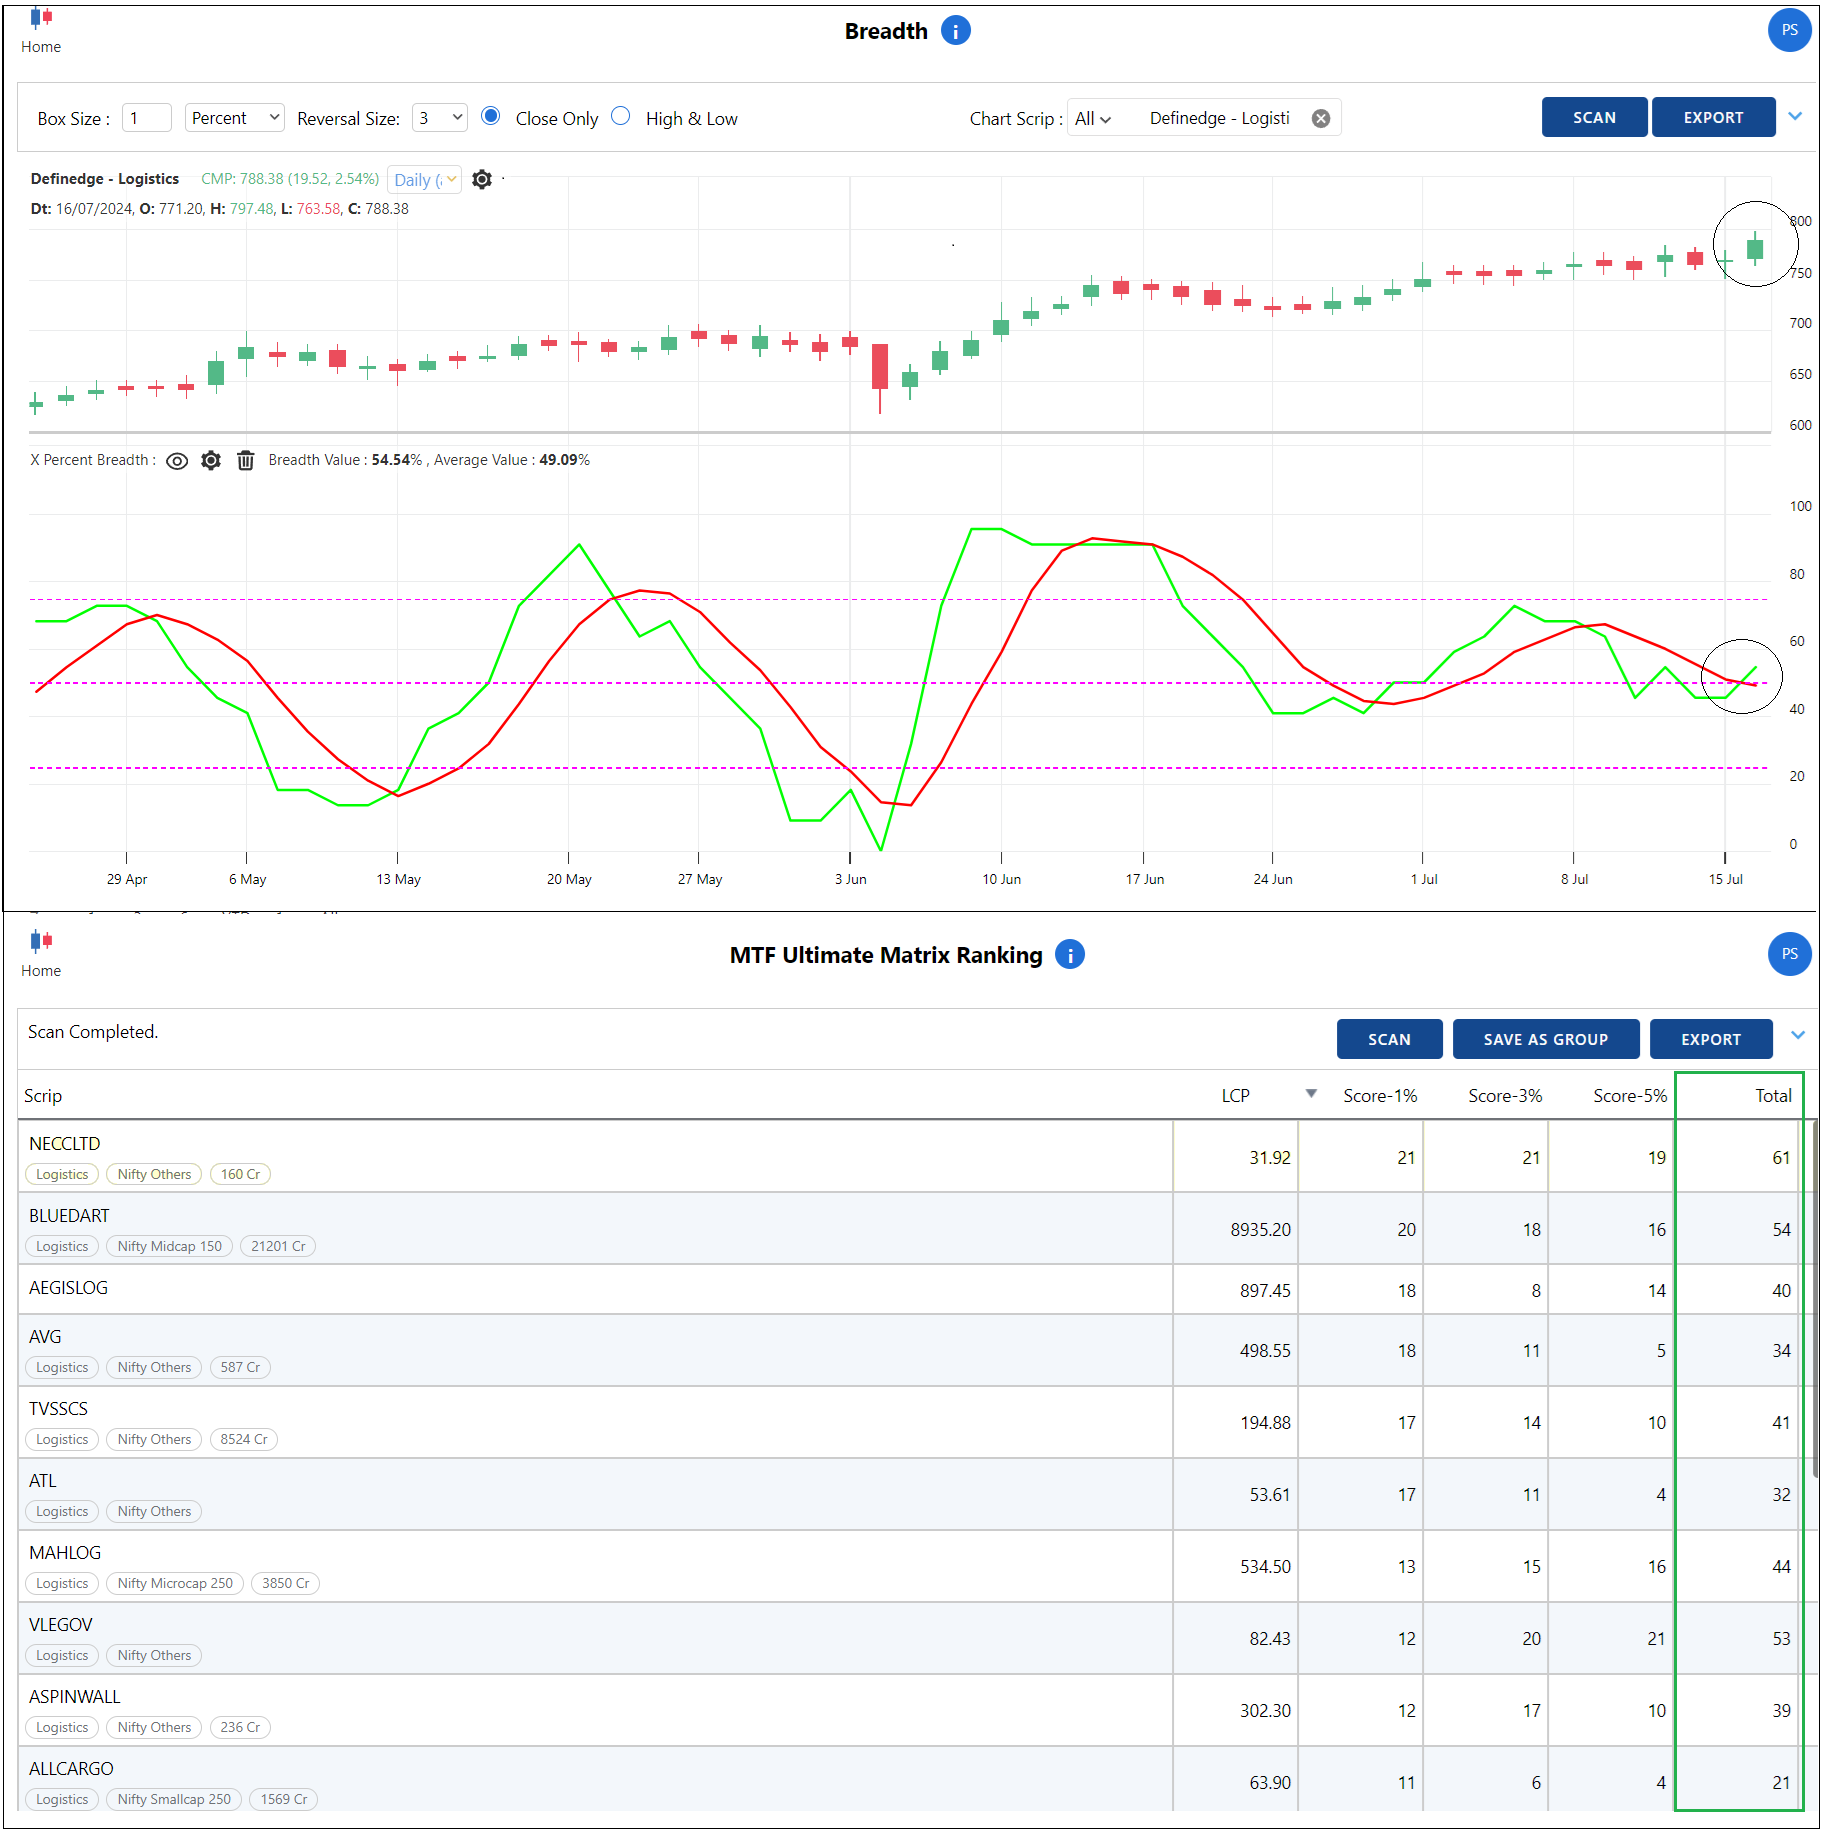
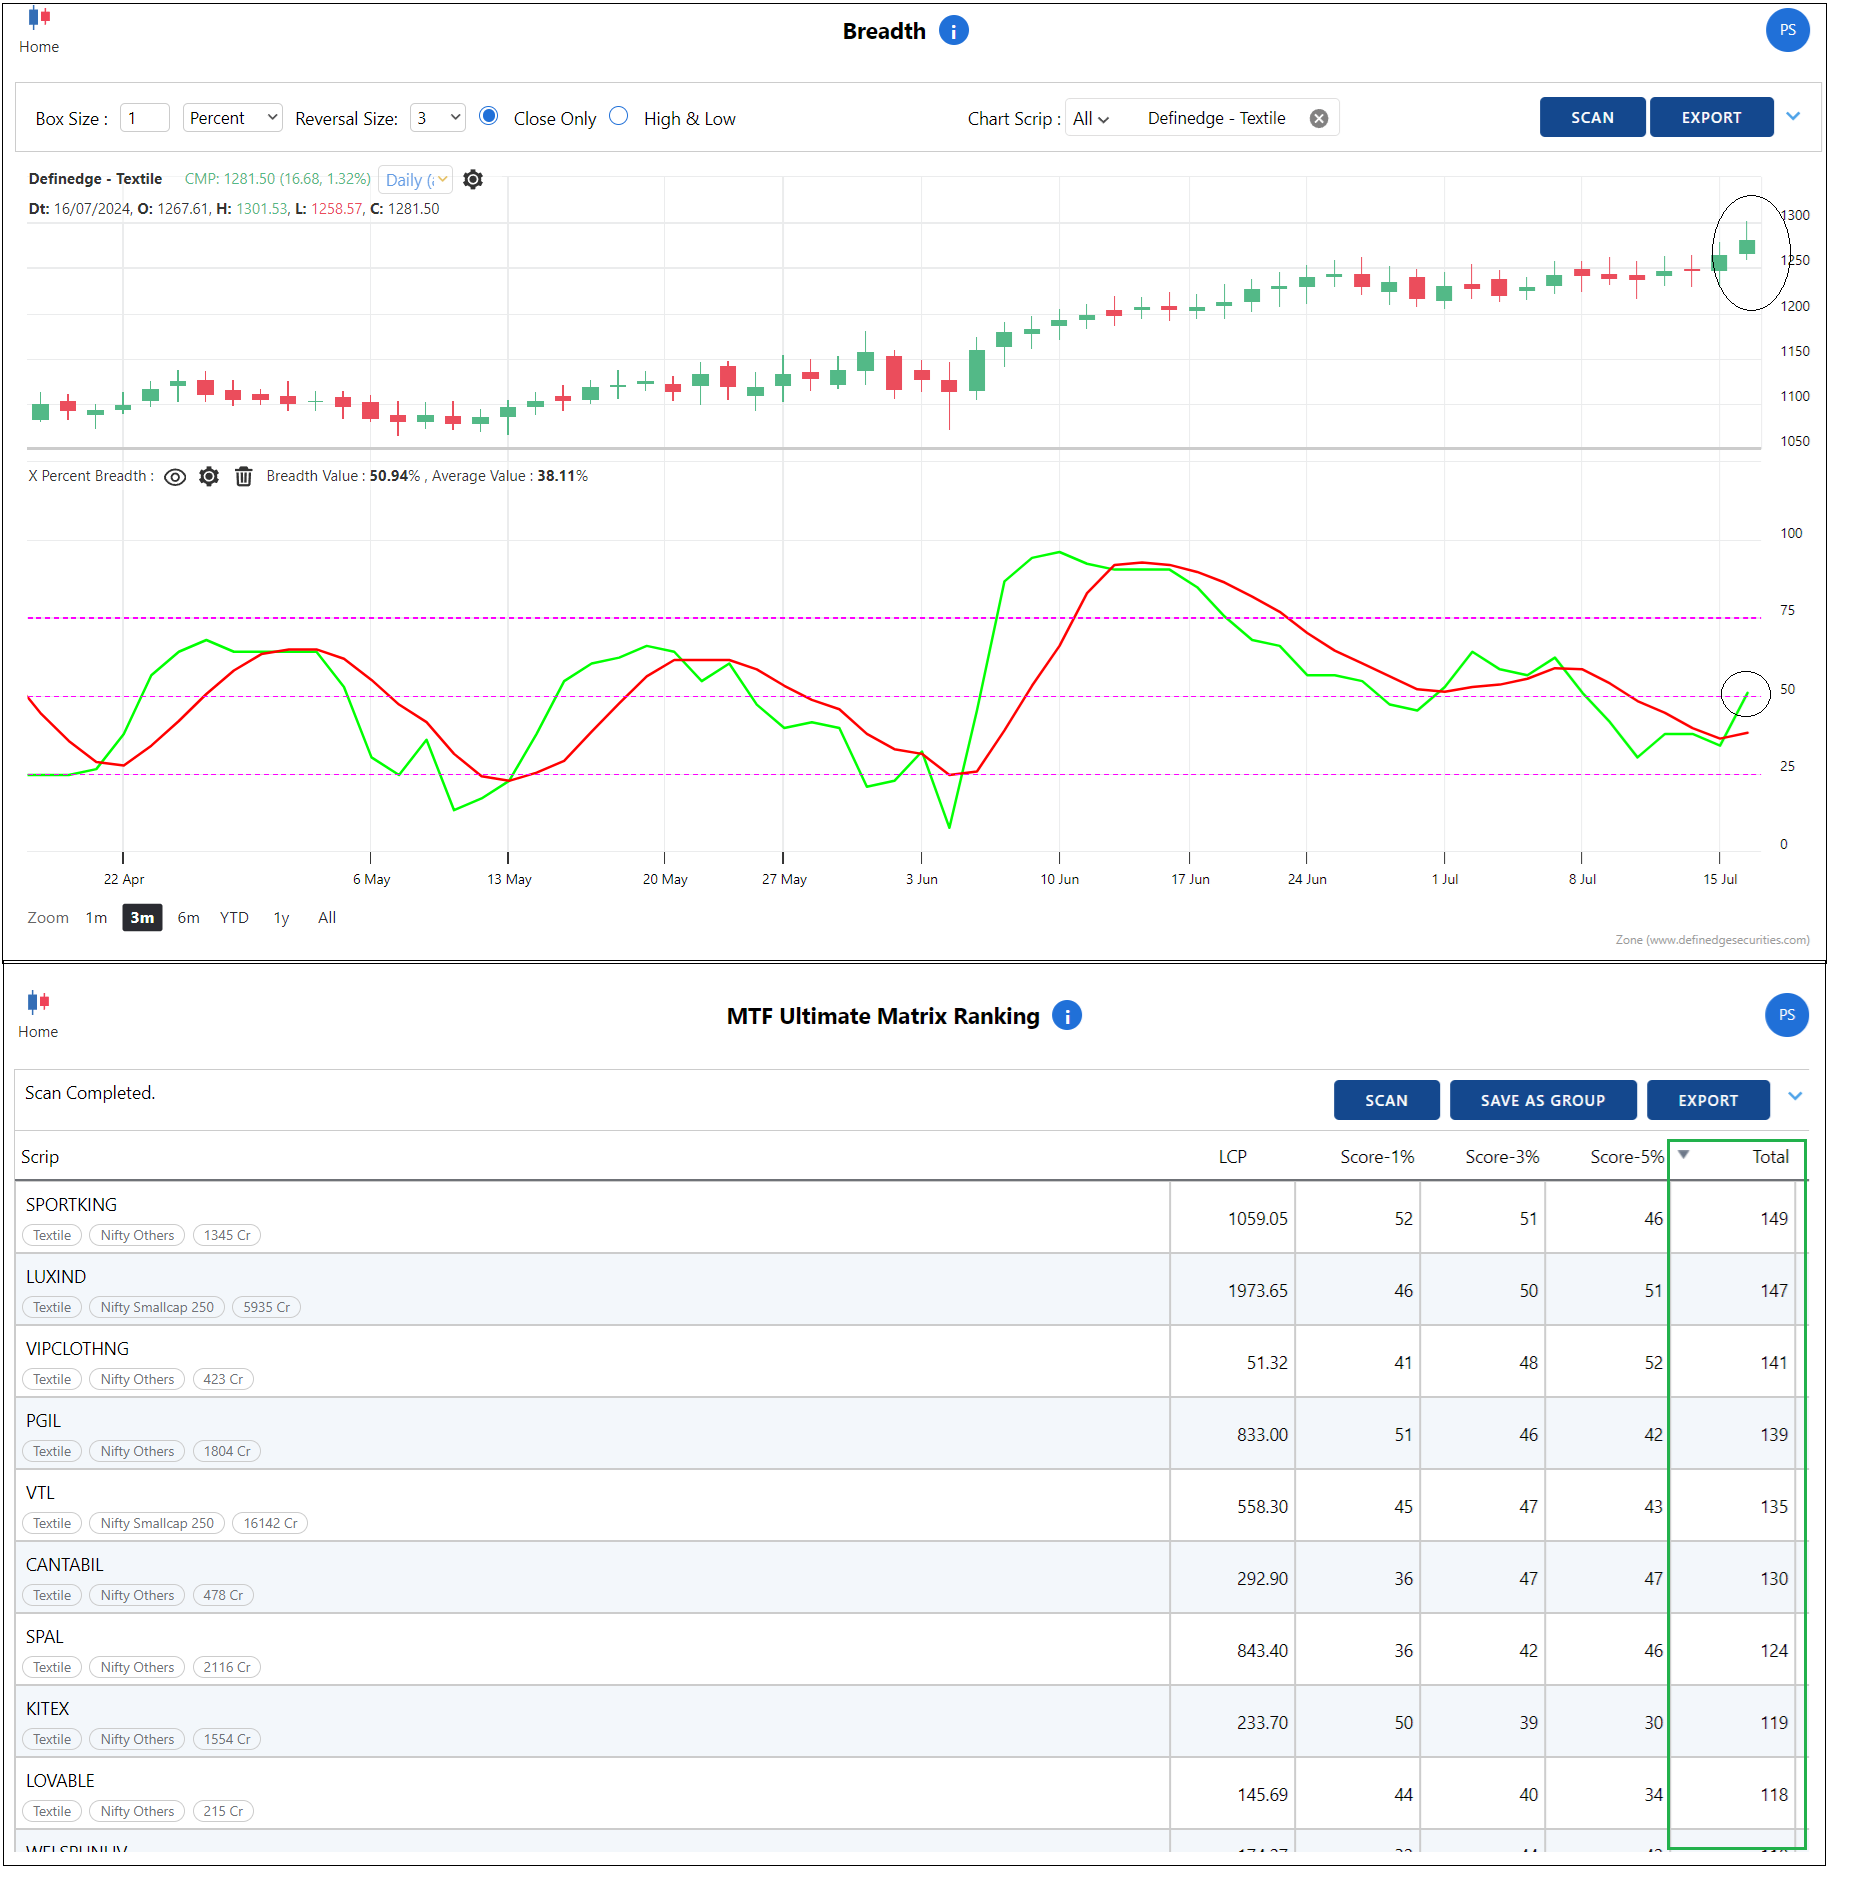
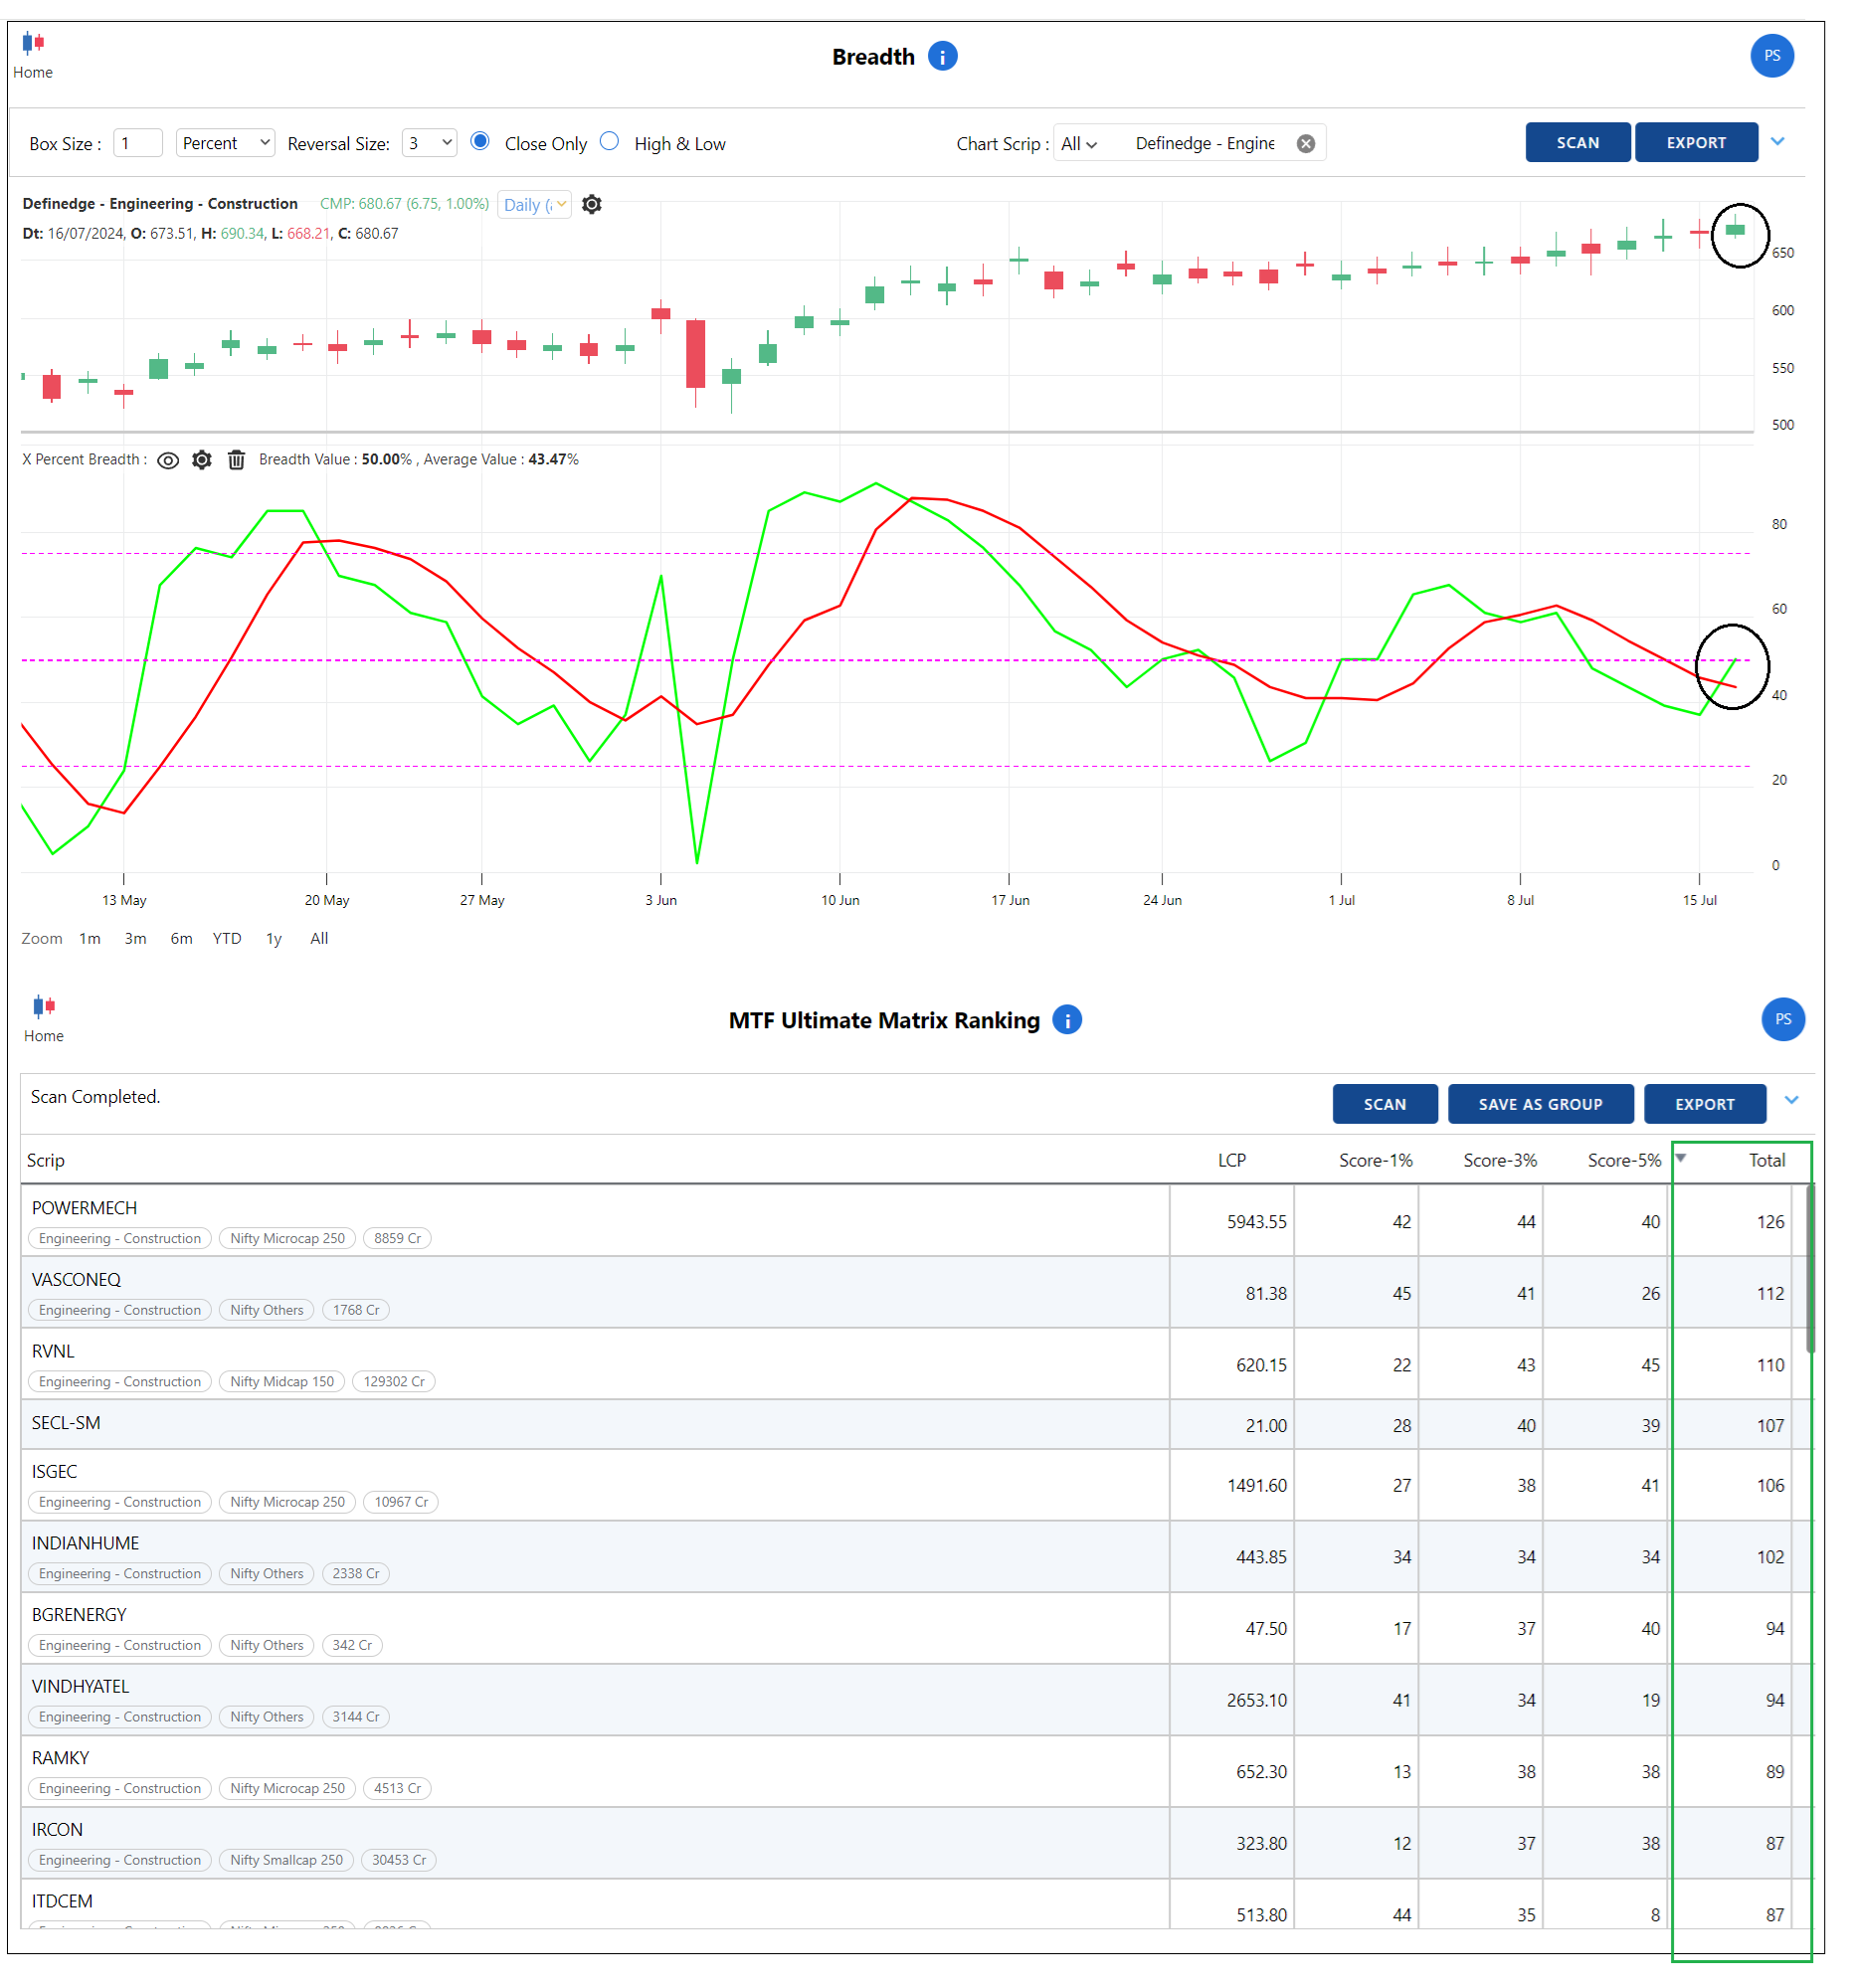
When a sector crosses the 50% mark during bullish swings, there is a likelihood that it will gain momentum. Picking the outperforming stocks of those sectors is an effective strategy.
65 Definedge sectors were scanned to check sectors crossing 50 mark. Below is their chart with performing stocks of the sectors based on the ultimate matrix study.
Definedge - Logistics Sector
Definedge - Textile sector
Definedge - Engineering & Construction Sector
Definedge - Pharma Sector
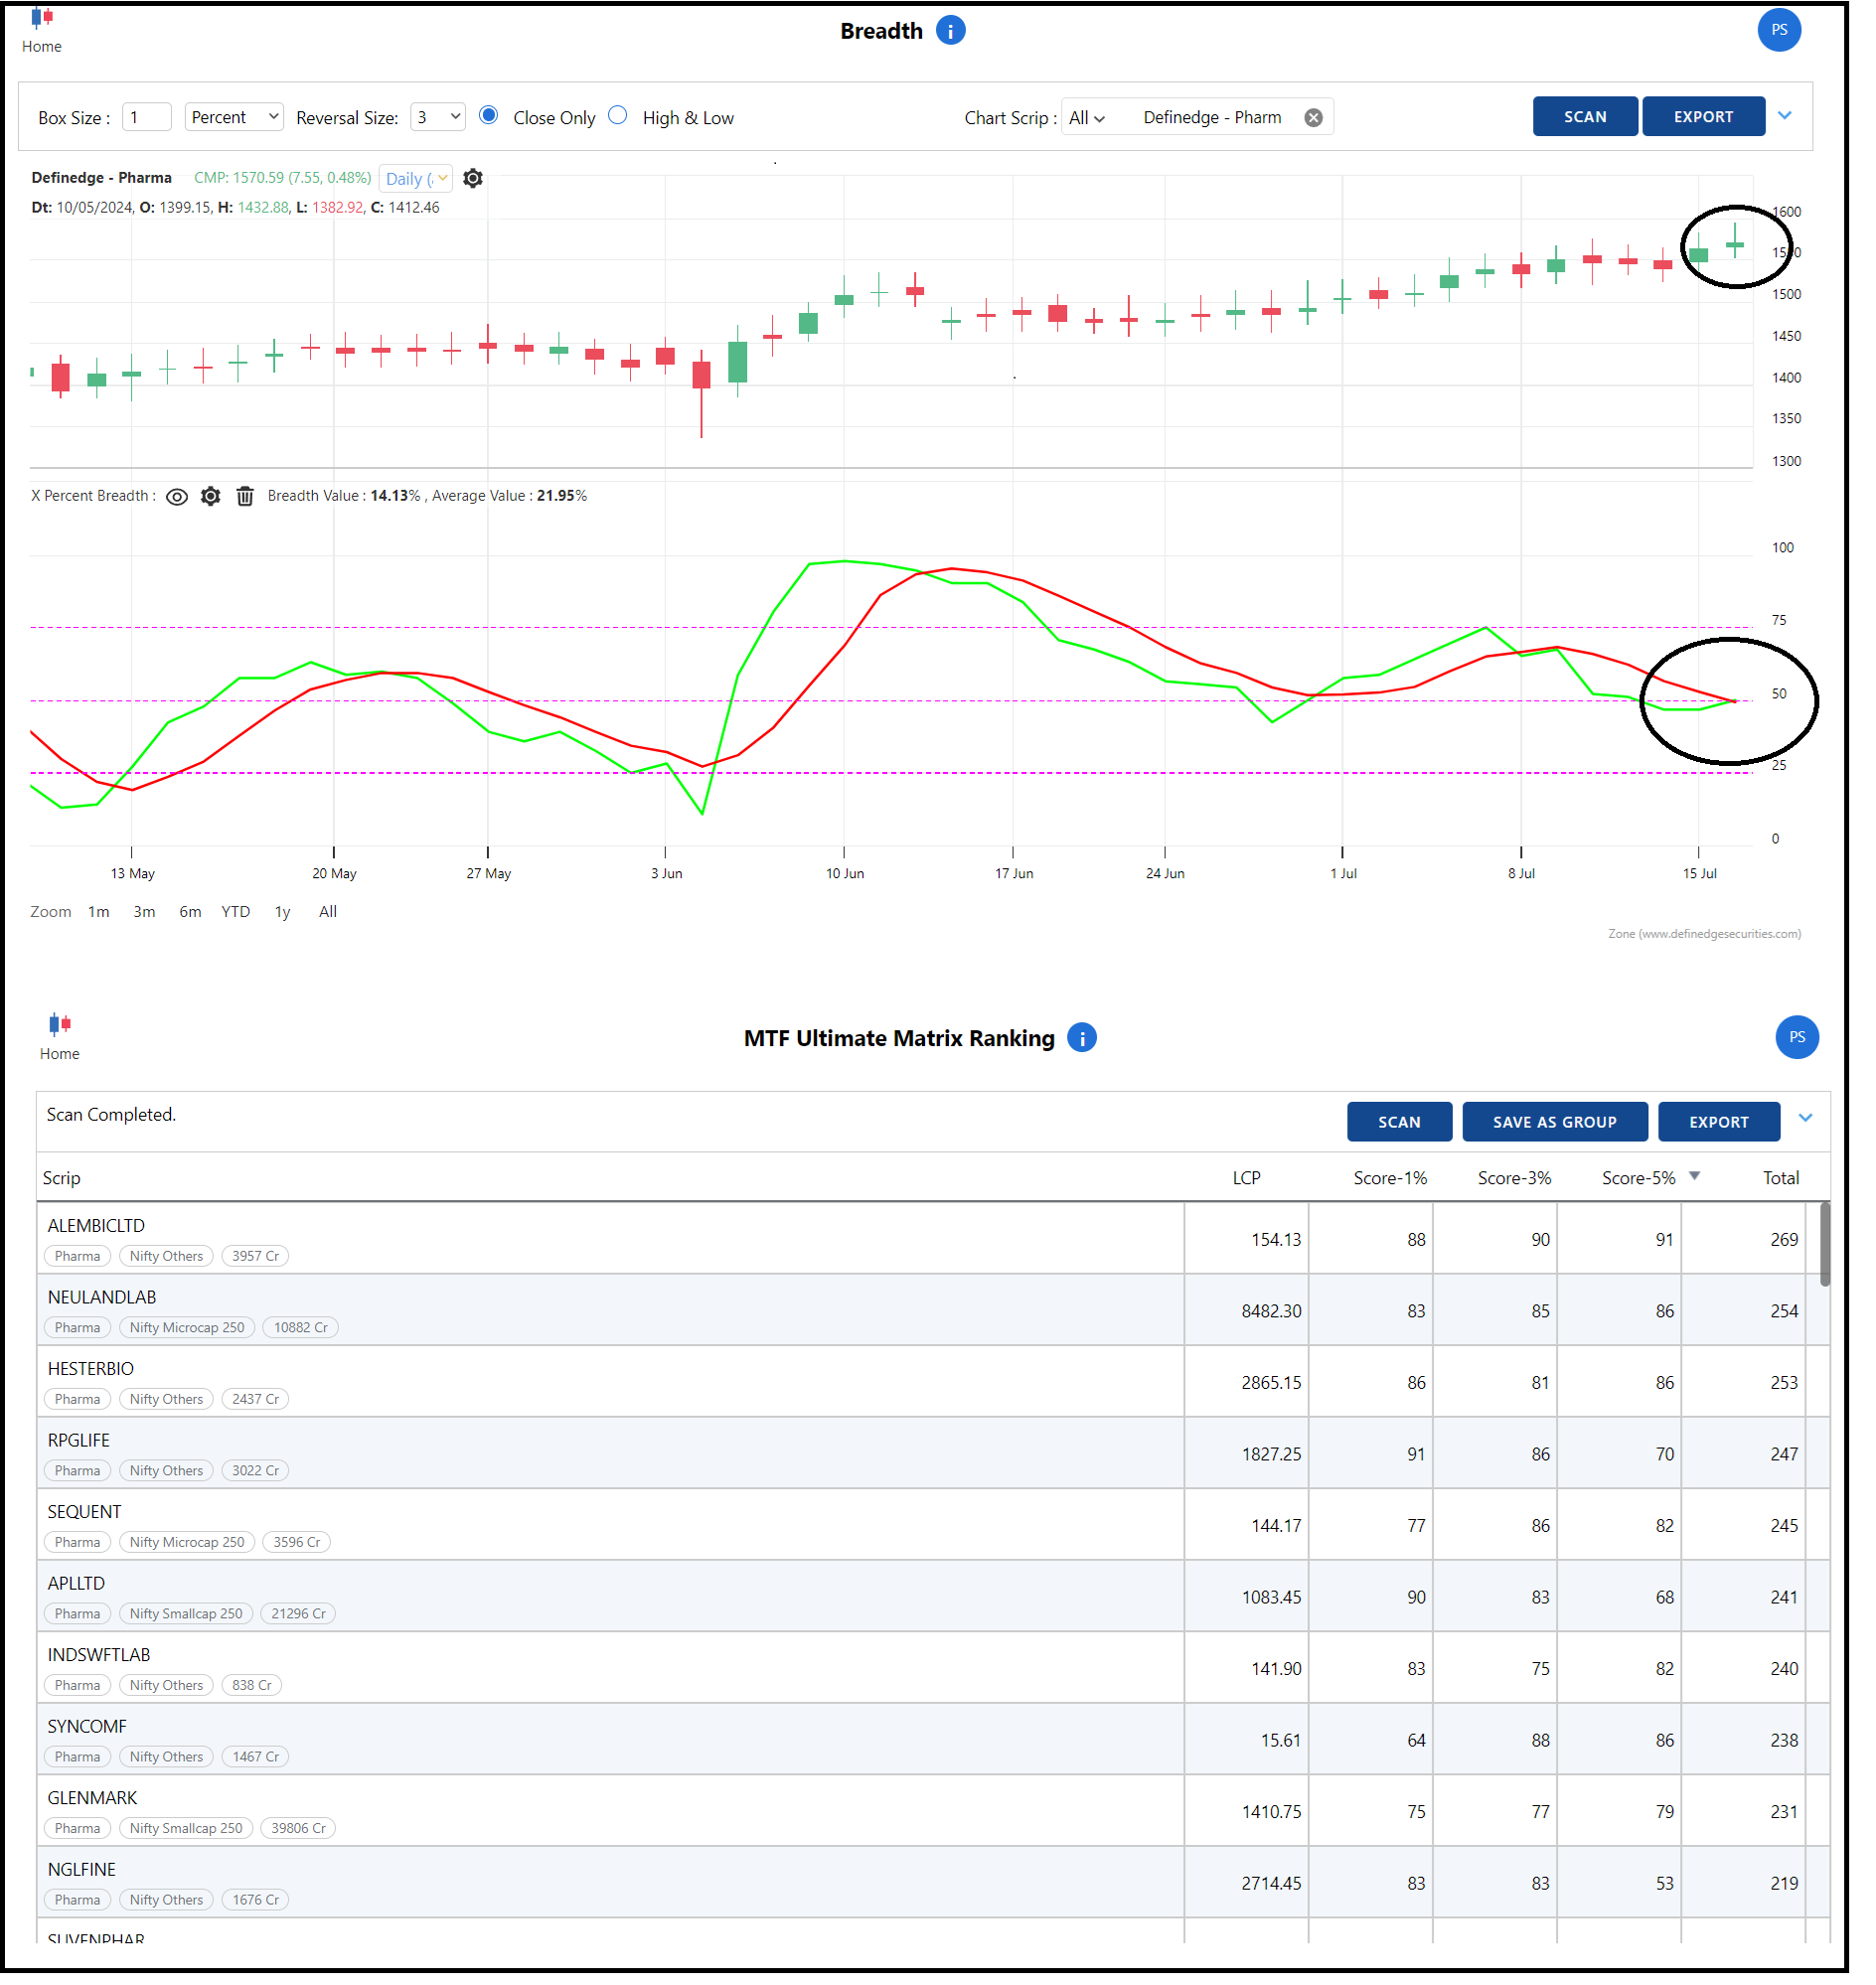
Process:
Step 1: Look for sectors crossing the 50 mark (Breadth chart and Breadth scanner)
Step 2: Run the Ultimate matrix of that sector to find better performing stocks
Step 3: Price analysis of those stocks to determine entry points and stop-loss
-
-
Thanks....this was helpful. Breadth chart in Rzone is quite exhaustive, but difficult to understand how to use it better. This will work as a guide.
-
Very logical and easy to track the sector performance. Thank you for the write-up.
-
So effectively explained and so very logic. Thank you Prashant sir.
Wonder why it did not came to my mind..")
-
Can we create smallcase of momentum stocks to trade in Definedge securities and do rebalance accordingly
-
Sir Nifty 50 is outperforming than Nifty 500 with above data but RS charts of Nifty 500/Nifty 50 or Nifty Midsml 400/Nifty 50 are still bullish. How to interpret this please guide.
Thanks
-
It is a simple yet effective way to look at momentum strategy, but how do you check over bought situation or end of momentum ? How do you compare stocks for their strength ?
-
Very simple & basic logic combined well to make superb tool to scan potential momentum stocks
-
@Prashant Shah said in Sector Momentum Analysis:
Stocks trading within 5% of their 52-week high
Can you please tell me how to get the 3rd chart where we get the stocks trading within 5% of their 52-week high? Which indicator to use and the parameters.