D Pivot
-
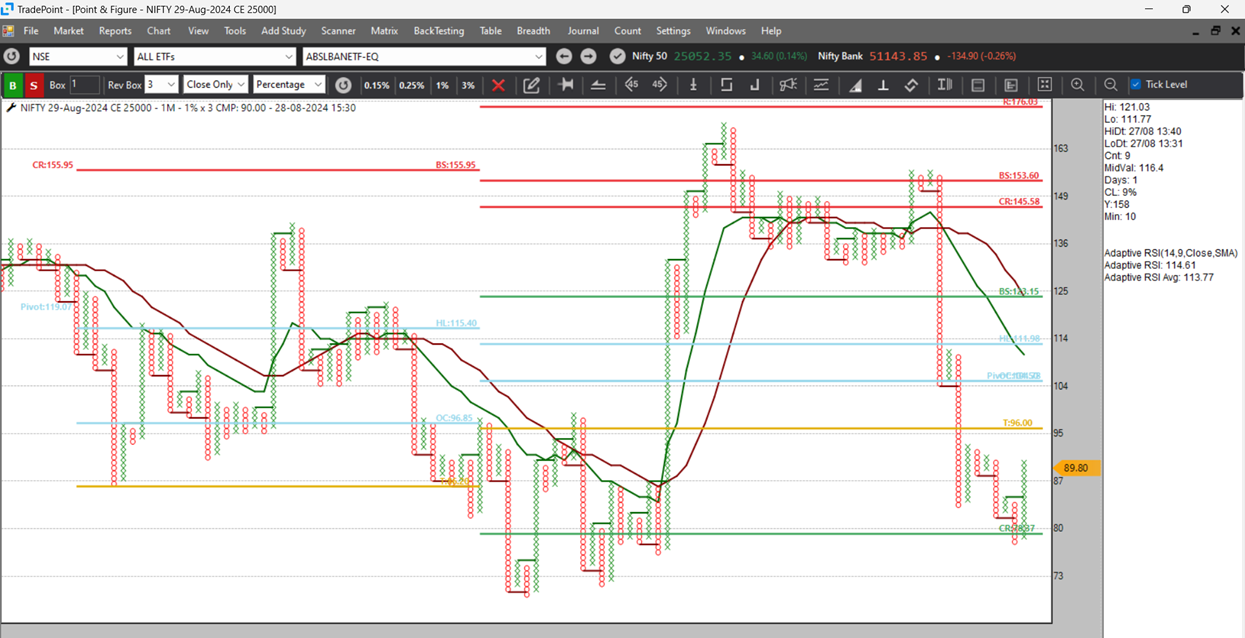
when I plot D pivot, it show some lines as BS (red and green) and OC (blue).. while Mr Prashant shared details of T, C lines and R & S line in recent video, there was no mention of BS & OC lines... kindly help us know what are these and their significance/usage.
-
Please note that there are four major lines: Support, Resistance, Pivot Band (blue) and the Trend line (T).
If you still find any confusion or need more clarity, please share a screenshot highlighting the levels.