Is NIFTY Headed for a Big Move? Reading the 31st July 25,500 Straddle’s Directional Pain
-
 Introduction: Why This Matters Now
The markets are often noisy, but clarity comes when you know where to look. One of the cleanest lenses to understand whether NIFTY is preparing for a major move—or trapping traders in endless decay—is the monthly ATM straddle.
As of 3rd July, NIFTY closed near 25,400, just below the psychological 25,500 mark, and traders are keenly watching the 31st July 25,500 straddle to judge if the market is loading energy for a directional burst.
But here is what most traders miss:
 Straddles don’t just reflect volatility; they reveal institutional intent.
When premiums shrink persistently, it signals that the market is comfortable in compression, and directional hope can translate into directional pain for aggressive traders.
If you are serious about aligning your trading plan with market structure, learning to read the straddle’s behavior can save you from false breakouts and capital erosion.This is why we are decoding the NIFTY 31st July 25,500 straddle using a Point & Figure chart, providing you with a clear, structured read of whether NIFTY is preparing for a breakout or a continued sideways expiry.
 What Is the 25,500 Straddle Telling Us?
The 31st July 25,500 straddle (25,500 CE + 25,500 PE) reflects the market’s volatility expectation:
- High premium = Expectation of a big move.
- Low premium = Expectation of sideways range.
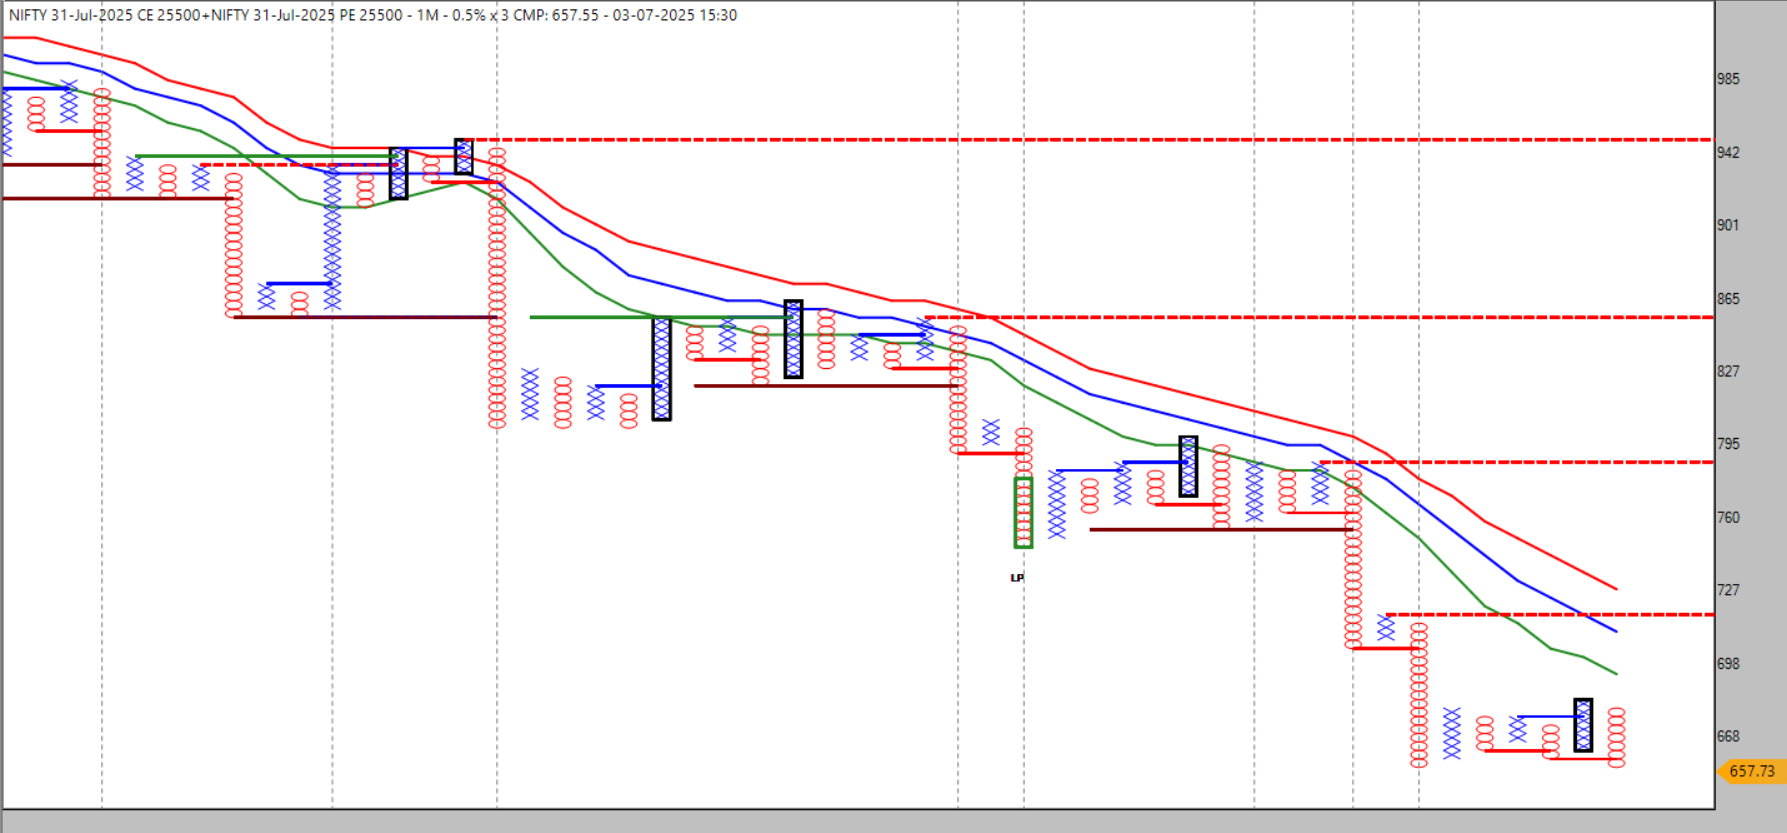
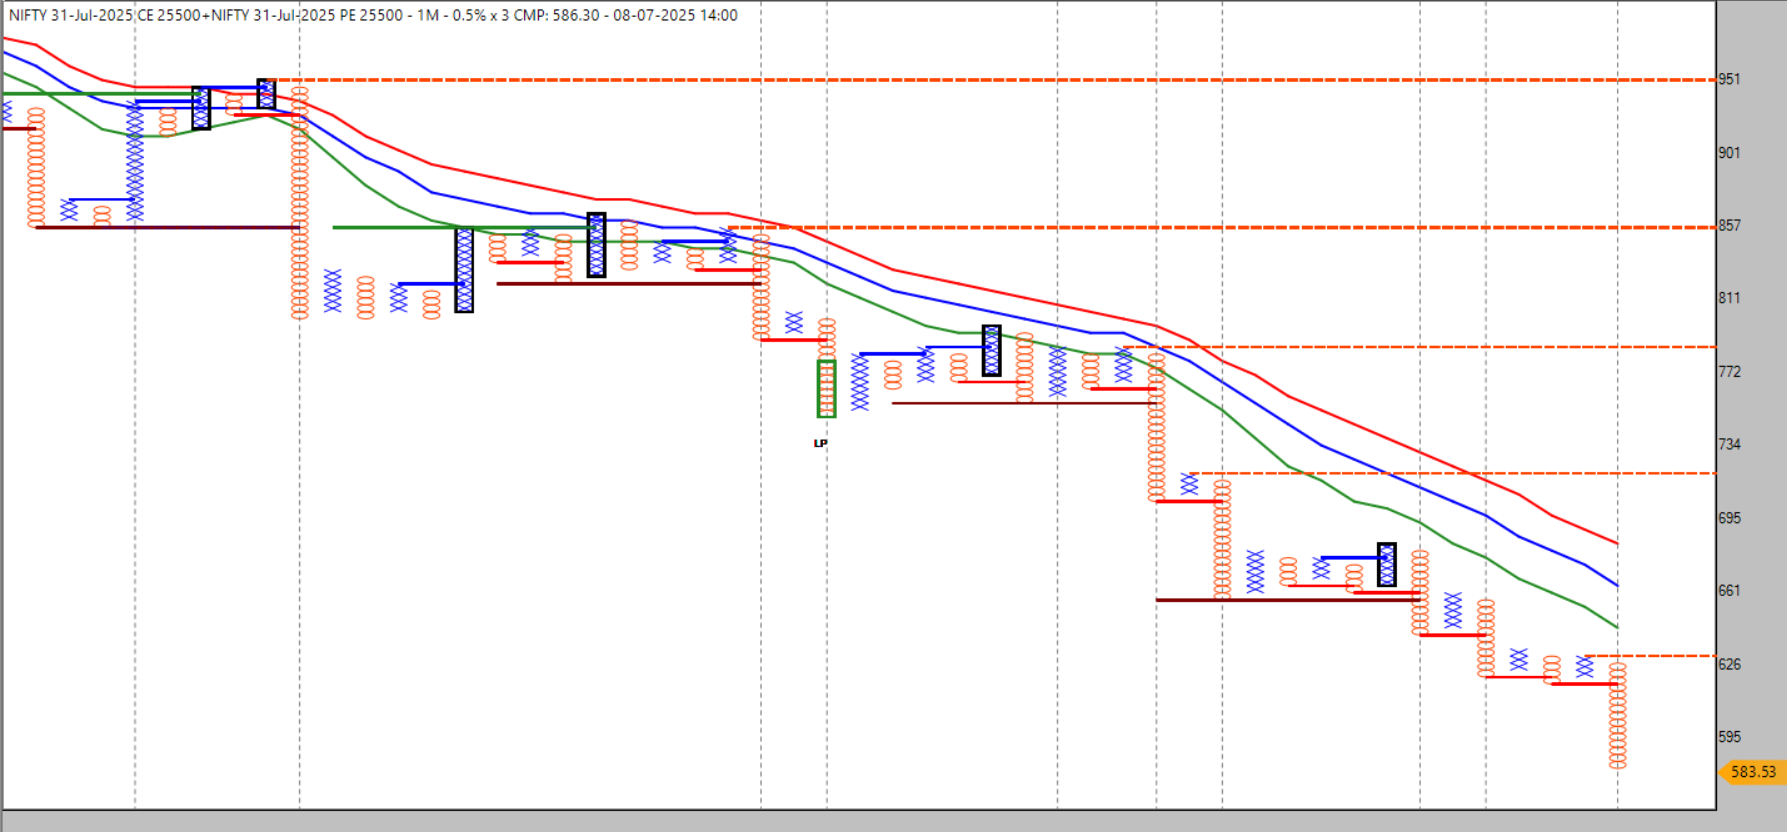
Currently, the combined premium sits near 657, which is low for a monthly expiry at this distance from expiry, suggesting market calmness rather than tension.
🩺 P&F Chart Read: Premium Erosion and Control
Key chart observations:
Persistent lower highs and lower lows → classic sign of premium erosion.
Sloping down moving averages (red, blue, green) → trend against premium expansion.
Multiple failed supply breakouts (black boxes) show that each upward spike in premium is being sold into.
Premium comfortably below 700, a sign that sellers are in control.
 Directional Pain: The Hidden Message
The market is moving just enough to decay both CE and PE but not enough to generate a trend that rewards buyers. This scenario creates directional pain, where traders expecting momentum get trapped while option sellers thrive.
Until this premium compression changes, the straddle is telling you:
“Don’t expect a major move unless I start expanding.”
 Key Levels to Track
- 750–775 reclaim: Watch for a possible volatility breakout and directional play.
- 600–650 drift: Confirms continued premium decay, reinforcing a sideways expectation.
 Actionable Trading Perspective Option buyers: Wait for a clean breakout above resistance on the P&F straddle chart before taking directional positions.
Option sellers: Current structure supports straddle/strangle selling strategies, provided risk management is in place.The straddle structure ensures you don’t fight the market while waiting for genuine opportunities.
🧘 Final Reflection
The NIFTY 31st July 25,500 straddle is your mirror to market behavior:
If the market intends to move, this straddle will show expansion first.
If the market intends to remain sideways, this straddle will continue decaying quietly.When you align your trading mindset with what the straddle is signaling, you reduce stress, avoid forced trades, and increase your longevity as a trader.
 ️ Disclaimer:
This article is for educational purposes only and does not constitute trading or investment advice. Always consult your advisor before acting on market analysis.
-
Nice one man
-
Thank You !!
-
Very good information Thank you
-
-
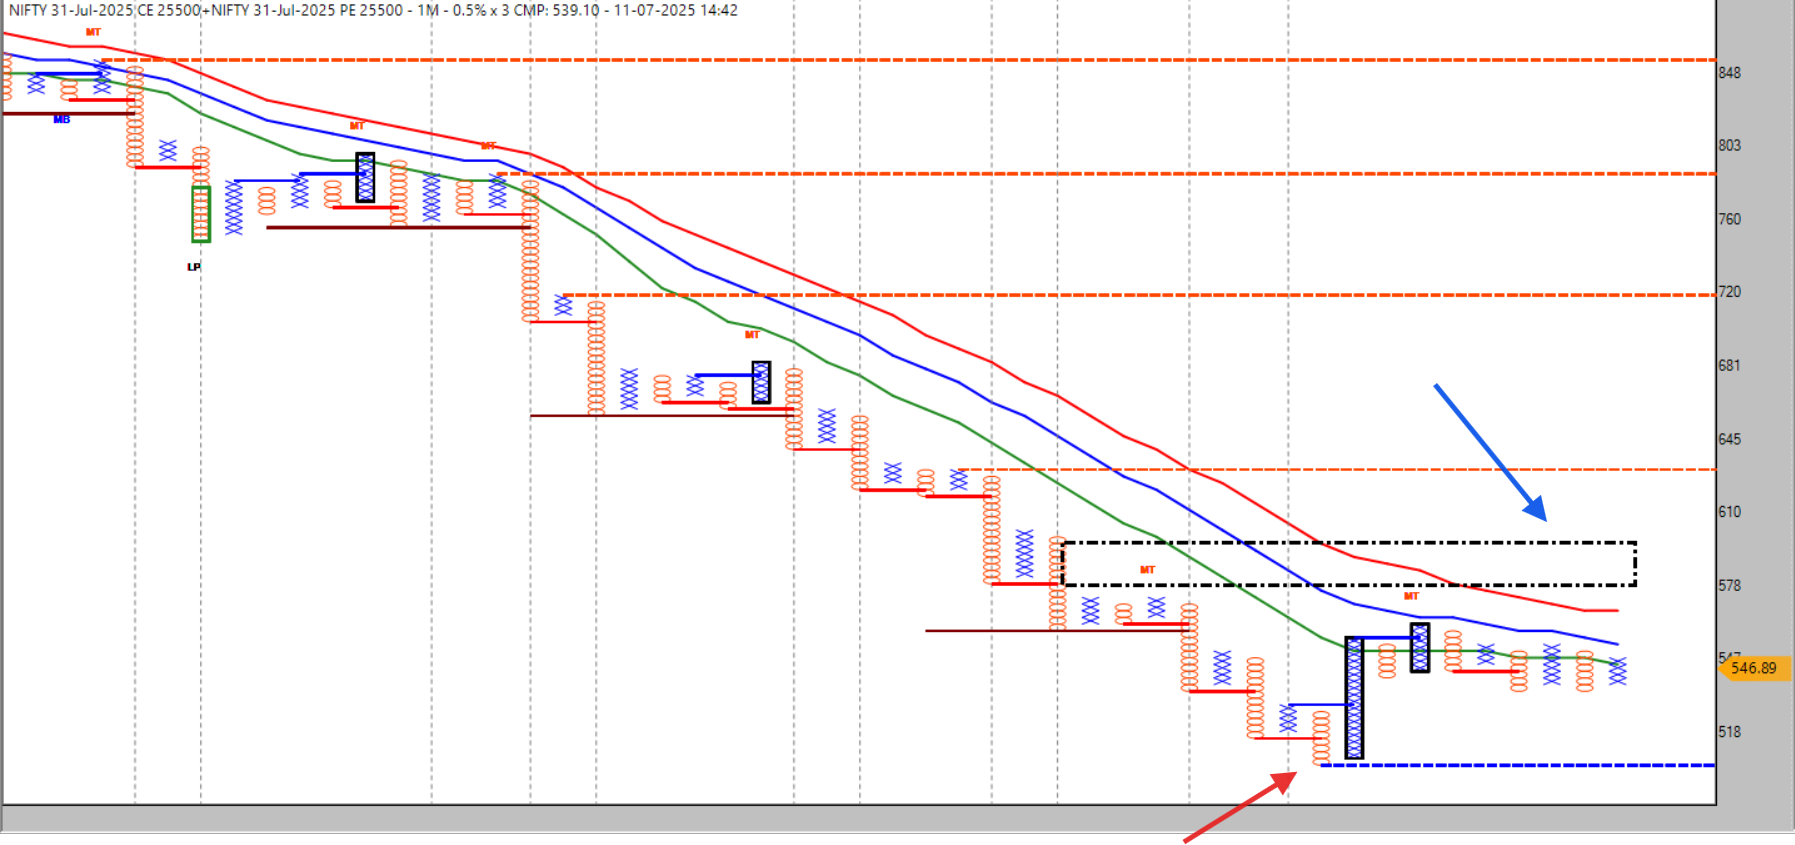 above 600 with folow through , nifty can be good directional smile
 & below 500 again directional pain
 ( enjoy theta eating )