NIFTY Transport & Logistic vs NIFTY 500 – RS Chart Signals Fresh Outperformance
-
1. Chart Type & Parameters
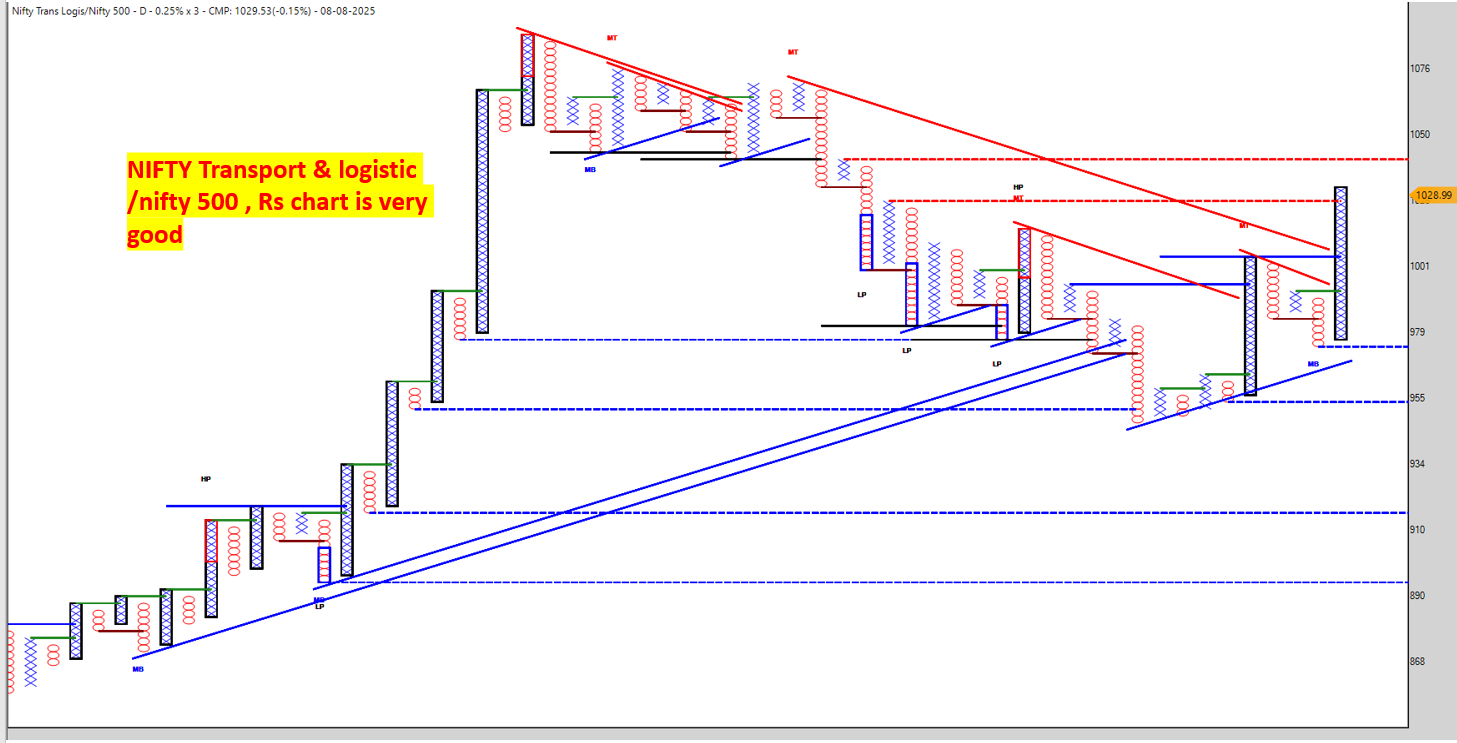
- Type: Point & Figure (P&F) Relative Strength chart
- Box Size: 0.25% x 3 reversal
- Comparison: NIFTY Transport & Logistic index vs. NIFTY 500 index
- Interpretation Goal: Identify whether Transport & Logistic is outperforming or underperforming the broader market.
2. Key Observations
Trend Structure
- Long-term uptrend intact: The lower part of the chart (left to middle) shows a series of higher bottoms and higher tops, confirming strong RS momentum in past months.
- Recent correction phase: Multiple red bearish trendlines (MT) show that the RS strength faced consolidation/decline recently.
- Current breakout attempt: The latest X-column has broken the immediate bearish resistance (red trendline), showing signs of fresh outperformance.
Support & Resistance
-
Support zones:
- 955–960: Strong horizontal & upward trendline confluence (blue lines) – key RS support.
- 978–980: Minor support zone where last pullback held.
-
Resistance zones:
- 1050: Major RS resistance from multiple previous tops.
- 1075–1080: Strongest RS resistance (past highs).
Pattern
- Multiple Low Pole (LP) and High Pole (HP) formations indicating RS volatility.
- Recent MB (Multiple Bottom) and trendline breakout suggests early phase of relative strength recovery.
3. Strength Reading
- The RS chart being above key blue bullish trendlines means Transport & Logistic is still in structural RS uptrend vs. NIFTY 500.
- Breaking past NT (near-term resistance) would confirm a continuation phase toward 1050.
- If RS holds above 979 after breakout, it’s a healthy sign for sustained outperformance.
4. Tactical Interpretation
- Bullish bias as long as RS stays above 955.
- Watch for decisive breakout above 1050 → signals strong sector outperformance ahead.
- If RS falls below 955, expect relative underperformance.
 Trader’s Note:
When RS chart is strong like this, it means money flow is favoring this sector over the broader market. Any bullish setup in individual Transport & Logistic stocks will have higher odds of success when RS is trending up.
5. Theoretical View
In a Relative Strength (RS) chart, the numerator (NIFTY Transport & Logistic) shows its performance relative to the denominator (NIFTY 500).
-
Current RS Trend: The Transport & Logistic sector is already in a structural RS uptrend, showing that it has been outperforming the broader market.
-
Impact of Denominator Recovery: If the denominator (NIFTY 500) begins to recover strongly, it can have two possible effects:
- Positive Amplification – If the Transport & Logistic sector rallies faster than the NIFTY 500, RS will accelerate upward, leading to a sharper outperformance signal.
- Neutralization – If both rise at the same pace, RS may move sideways, but sector momentum remains intact.
-
Why This Matters: A recovering NIFTY 500 often attracts broader market buying interest. In such an environment, already strong RS sectors like Transport & Logistic tend to attract disproportionate capital flow, which could push RS above the critical 1050 breakout level and potentially toward 1075+.
Nifty Transportation & Logistics vs Nifty 500 – RS Stock-Level Analysis
1. Sector Snapshot
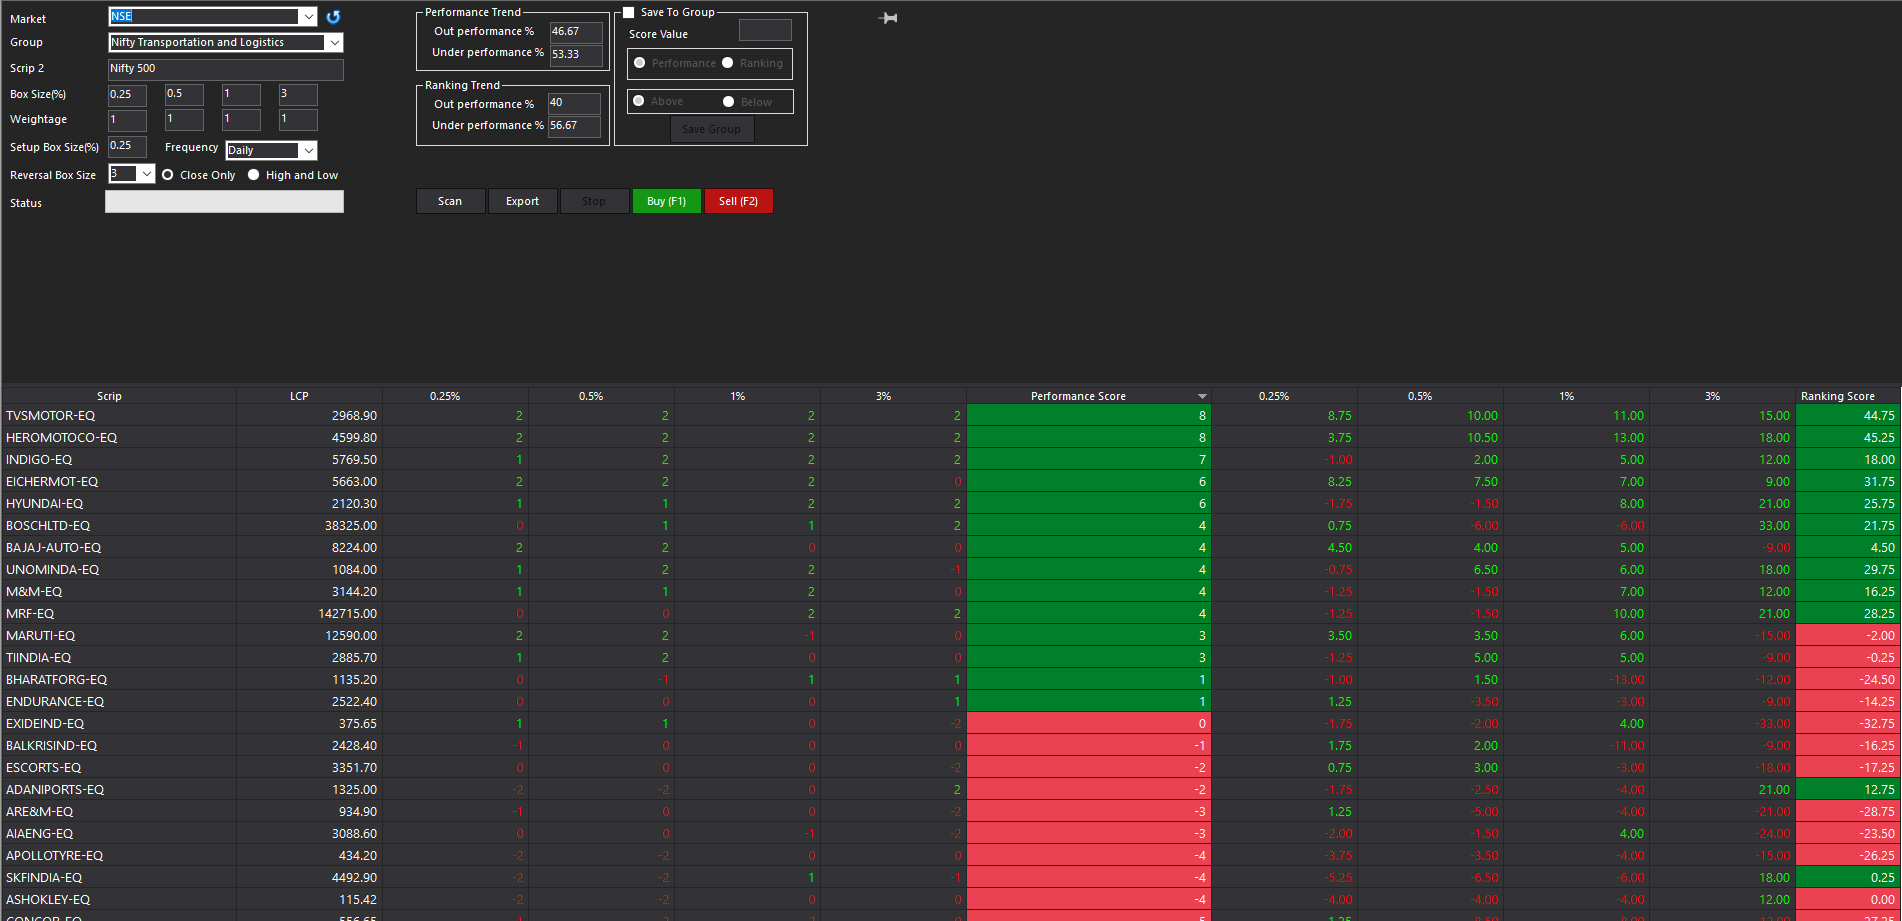
- Outperformance (Performance Trend): 46.67%
- Underperformance: 53.33%
- Ranking Trend: 40% outperforming, 56.67% underperforming.
- Insight: Sector RS is positive but leadership is concentrated in a few strong stocks.
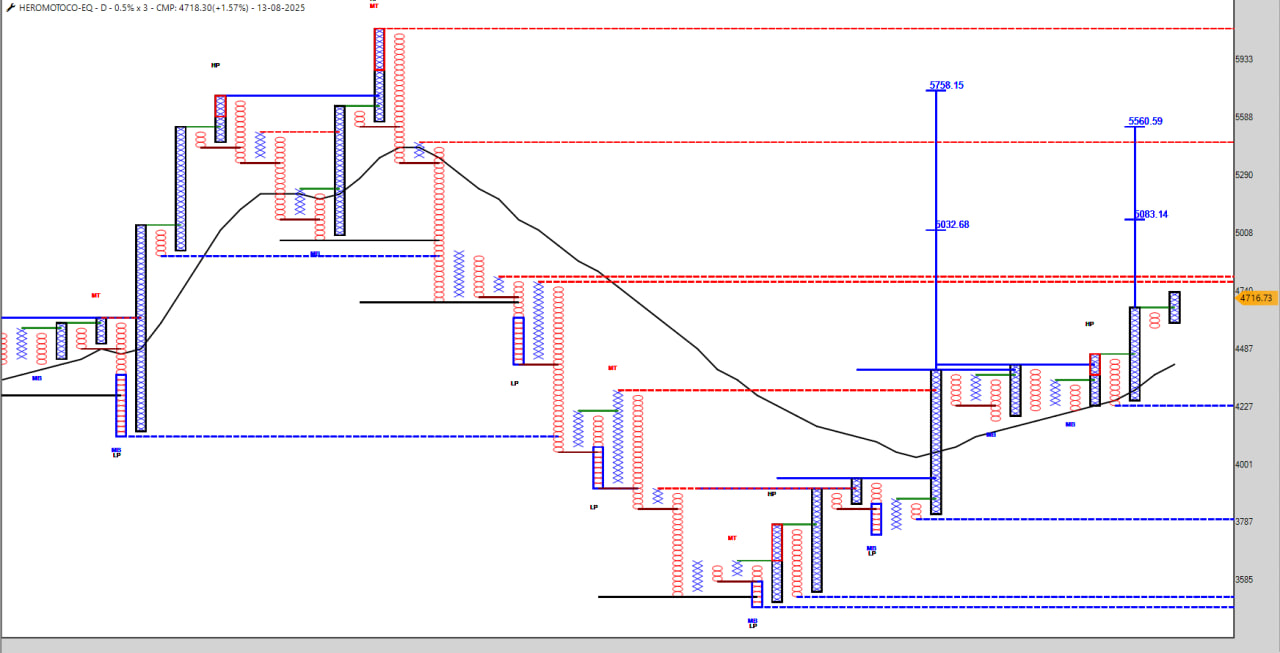
2. Top RS Leaders (Likely to Benefit Most if Nifty 500 Recovers)
Rank Stock Performance Score Ranking Score Comment 1 TVSMOTOR-EQ 8 44.75 Sector RS leader, strong across all timeframes. 2 HEROMOTOCO-EQ 8 45.25 Strong momentum and ranking stability. 3 INDIGO-EQ 7 18.00 Good RS even in a choppy market. 4 EICHERMOT-EQ 6 31.75 Steady RS trend; watch for breakout. 5 HYUNDAI-EQ 6 25.75 Healthy RS, could accelerate on sector strength. 6 BOSCHLTD-EQ 6 21.75 Consistent outperformer, defensive in corrections.
3. Neutral RS Stocks
Stock Performance Score Ranking Score Comment BAJAJ-AUTO-EQ 4 4.50 Needs ranking improvement. UNOMINDA-EQ 4 29.75 Solid RS, close to leadership zone. M&M-EQ 4 16.25 Holding up, watch for momentum shift. MRF-EQ 4 28.25 Positive RS but slower pace. MARUTI-EQ 3 -2.00 Needs sector tailwind.
4. RS Weak Laggards (Avoid Until Clear Turnaround)
Stock Performance Score Ranking Score ESCORTS-EQ -1 -17.25 APOLLOTYRE-EQ -4 -26.25 ASHOKLEY-EQ -4 -24.00 SKFNINDIA-EQ -4 -26.00 AIAENG-EQ -3 -23.50
5. Theoretical Note
In an RS setup:
- Numerator = Nifty Transportation & Logistics
- Denominator = Nifty 500
If Nifty 500 recovers and the Transport & Logistics index rises faster than it, RS will accelerate upward.
Current leaders are already outperforming in a weak market, so they could gain disproportionately in a broad market recovery.
 Disclaimer
This analysis is for educational and informational purposes only. It is not investment advice or a recommendation to buy/sell any security. Market conditions can change quickly, and past performance is not a guarantee of future results. Please consult a registered financial advisor before making any trading or investment decisions. You are solely responsible for your own risk management and capital protection.
-
Excellent Analysis !! Sir.
-