• Recent
  • Categories
  • 0 Unread 0
  • Popular
  • Tags
  • More
    • Guidelines
    • Disclaimer
  • Users
Skins
  • Light
  • Default
  • Cerulean
  • Cosmo
  • Flatly
  • Journal
  • Litera
  • Lumen
  • Lux
  • Materia
  • Minty
  • Morph
  • Pulse
  • Quartz
  • Sandstone
  • Simplex
  • Sketchy
  • Spacelab
  • United
  • Yeti
  • Zephyr
  • Dark
  • Cyborg
  • Darkly
  • Slate
  • Solar
  • Superhero
  • Vapor
Collapse
Definedge Forum Logo

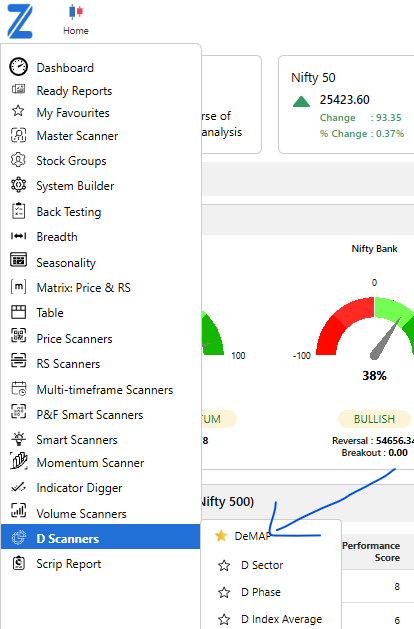
Query : some meaning in DeMAP

Scheduled Pinned Locked Moved Ask Definedge Team (Subject related)
@askdefinedge@prashantshah@askprashant
8 Posts 3 Posters 245 Views
    • Oldest to Newest
    • Newest to Oldest
    • Most Votes
Reply
  • Reply as topic
Log in to reply
This topic has been deleted. Only users with topic management privileges can see it.
  • Yogesh Varhadpande Offline
    Yogesh Varhadpande-1738656104214Y Offline
    Yogesh Varhadpande

    Pro User

    wrote on last edited by
    #1

    could @Definedge team explain what is the meaning of the expressions in DeMAP chart stock's tails has following

    1. up-down arrow shape
    2. diamond shape
    3. Box shape
    4. circle shape with there color.

    and can you add the section where we can select our watchlist and the portfolio to track that stocks with the help of DeMAP?

    By the way this is a very great product for stock selection with the help of visual form..

    PrasiddhShroffP 1 Reply Last reply
    0
  • Prasiddh Shroff Offline
    PrasiddhShroffP Offline
    Prasiddh Shroff

    Definedge

    replied to Yogesh Varhadpande on last edited by
    #2

    @Yogesh Varhadpande
    Hello sir,

    Definedge Momentum and Performance (DeMAP) is a unique study developed by Definedge. DeMAP enables you to analyse market at a glance.

    Price analysis, momentum indicators, trend following indicators, range-bound oscillators, relative strength analysis, dynamic relative strength analysis, analysis on candlestick chart, Point & Figure chart, Renko chart, Line-break chart and price patterns on different charting methods etc. Popular studies and factors practiced by traders are incorporated into the DeMAP calculation.

    The Momentum and Performance levels are calculated based on all the calculations above and presented in a unique format.

    You can plot a DeMAP chart of NSE Segments, NSE Sectors, Definedge Sectors and Constituents of any sector.

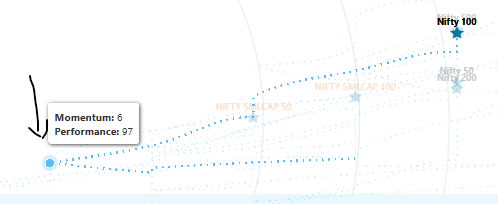
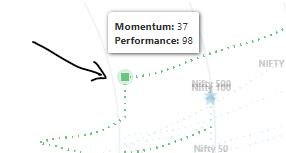
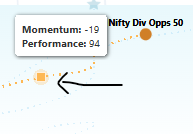
    DeMAP is divided into two parts: Sky and Water. Scrips above zero line are in Sky presented as stars. Scrips below zero line are in Water and presented as circle. You can view their last 10 session journey.

    Green Star (In the Sky) stocks are bullish and have strong momentum. Red Circle (In the Water) stocks are bearish. Blue Star (In the Sky) stocks are semi-bullish and Orange Circle (In the Water) stocks are semi-bearish.

    There is a circle in every chart. It is like a Sun in white theme and Moon in Black theme. When the circle is at left – the sector is bullish. When the circle is at right – the sector is bearish. When the circle is at middle – the sector is neutral.

    Below is a link to the video to understand DeMAP in detail.
    https://www.youtube.com/watch?v=QMMj-B_671I&t=1165s

    Yogesh Varhadpande-1738656104214Y 1 Reply Last reply
    0
  • R Offline
    R Offline
    Rajesh Khadkikar

    Pro User

    wrote on last edited by
    #3

    I can't see Demap section in Rzone, did I miss something? please suggest

    1 Reply Last reply
    0
  • R Offline
    R Offline
    Rajesh Khadkikar

    Pro User

    wrote on last edited by
    #4

    @Prasiddh-Shroff Sir, I can't see DeMAP section in Rzone. Please suggest the ways to solve this issue

    Yogesh Varhadpande-1738656104214Y 1 Reply Last reply
    0
  • Yogesh Varhadpande Offline
    Yogesh Varhadpande-1738656104214Y Offline
    Yogesh Varhadpande

    Pro User

    replied to Rajesh Khadkikar on last edited by
    #5

    @Rajesh Khadkikar
    75299457-90c1-4dac-8f4b-ee72ee421224-image.png

    1 Reply Last reply
    0
  • Yogesh Varhadpande Offline
    Yogesh Varhadpande-1738656104214Y Offline
    Yogesh Varhadpande

    Pro User

    replied to Prasiddh Shroff on last edited by Yogesh Varhadpande-1738656104214
    #6

    @Prasiddh Shroff
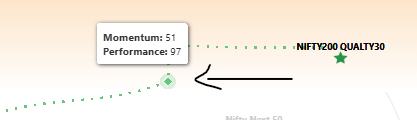
    Thank you sir, I know it thoroughly...But @Definedge didn't explain its TAIL'S SYMBOLS which are I have mention in the post.
    when we go to its tail, chart is showing some symbols, I have seen most of the DeMAP related videos 4to5 times but the didn't mention that symbols..

    eeccb161-1349-43d2-8154-4caf1a3b65fc-image.png
    6cf5db29-c344-4e7a-9b0f-3ea7ef3caf71-image.png
    5b45a9ef-2db6-41f6-97d0-c3988d7d75be-image.png
    36aa4da7-67bd-425c-aeb0-8868ed265bd5-image.png
    7f3a6200-c47d-4bd6-b51f-c335ce3a5909-image.png

    1 Reply Last reply
    0
  • Yogesh Varhadpande Offline
    Yogesh Varhadpande-1738656104214Y Offline
    Yogesh Varhadpande

    Pro User

    wrote on last edited by
    #7

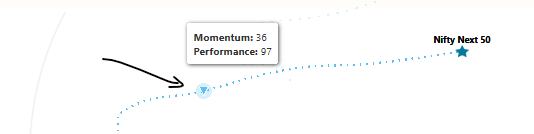
    @Prasiddh-Shroff or @Definedge could you please Explain these symbols?

    PrasiddhShroffP 1 Reply Last reply
    0
  • Prasiddh Shroff Offline
    PrasiddhShroffP Offline
    Prasiddh Shroff

    Definedge

    replied to Yogesh Varhadpande on last edited by
    #8

    @Yogesh Varhadpande Sir, these are just randomised icons to differentiate the tails for each scrip/group. The icons in the tail does not define anything sir

    1 Reply Last reply
    1


Recent Posts

  • S
    Different platform show different chart
  • A
    Wrong backtesting data on Quterly rebalancing
  • N
    How to scan stocks Ratio Chart?
  • A
    Suggestion for Improving RZone Backtesting Handling
  • DefinedgeD
    Trade point on mobile
  • Login

  • Login or register to search.
  • Blog
  • Youtube Videos
  • Refresh
  • First post
    Last post
0
  • Recent
  • Categories
  • Unread 0
  • Popular
  • Tags
  • More
    • Guidelines
    • Disclaimer
  • Users
  • Login

  • Login or register to search.
  • Blog
  • Youtube Videos
  • Refresh