• Recent
  • Categories
  • 0 Unread 0
  • Popular
  • Tags
  • More
    • Guidelines
    • Disclaimer
  • Users
Skins
  • Light
  • Default
  • Cerulean
  • Cosmo
  • Flatly
  • Journal
  • Litera
  • Lumen
  • Lux
  • Materia
  • Minty
  • Morph
  • Pulse
  • Quartz
  • Sandstone
  • Simplex
  • Sketchy
  • Spacelab
  • United
  • Yeti
  • Zephyr
  • Dark
  • Cyborg
  • Darkly
  • Slate
  • Solar
  • Superhero
  • Vapor
Collapse
Definedge Forum Logo

Optest Backtesting

Scheduled Pinned Locked Moved Ask Definedge Team (Subject related)
2 Posts 2 Posters 16 Views
    • Oldest to Newest
    • Newest to Oldest
    • Most Votes
Reply
  • Reply as topic
Log in to reply
This topic has been deleted. Only users with topic management privileges can see it.
  • J Offline
    J Offline
    Jagjodh Singh
    wrote on last edited by
    #1

    Hi @Definedge team, Hope you're doing well.
    I have a question regarding Optest backtesting. When we choose 'P & F Technical Trading', there are conditions related DMA and TMA. In this technical indicator, what period of moving averages are used? And I suppose these are EMAs only(comment on this as well). And when it says above DMA or TMA, does it also mean that these moving averages are aligned as well.(I mean if there're 20,30,40 EMAs, does above TMA mean price>EMA(20)>EMA(30)>EMA(40))?

    Thanks in advance!
    Warm regards!

    1 Reply Last reply
    0
  • Definedge Online
    DefinedgeD Online
    Definedge
    wrote on last edited by
    #2

    Dear Customer,

    Thank you for connecting with Definedge Securities.
    We are glad to address your queries about our services.

    For P&F Technical Trading method in Optest, Simple Moving Averages are used with values mentioned in the "Entry And Exit Condition"
    section tooltip. Attached herewith is the screenshot of the same for your reference.

    image (5).png

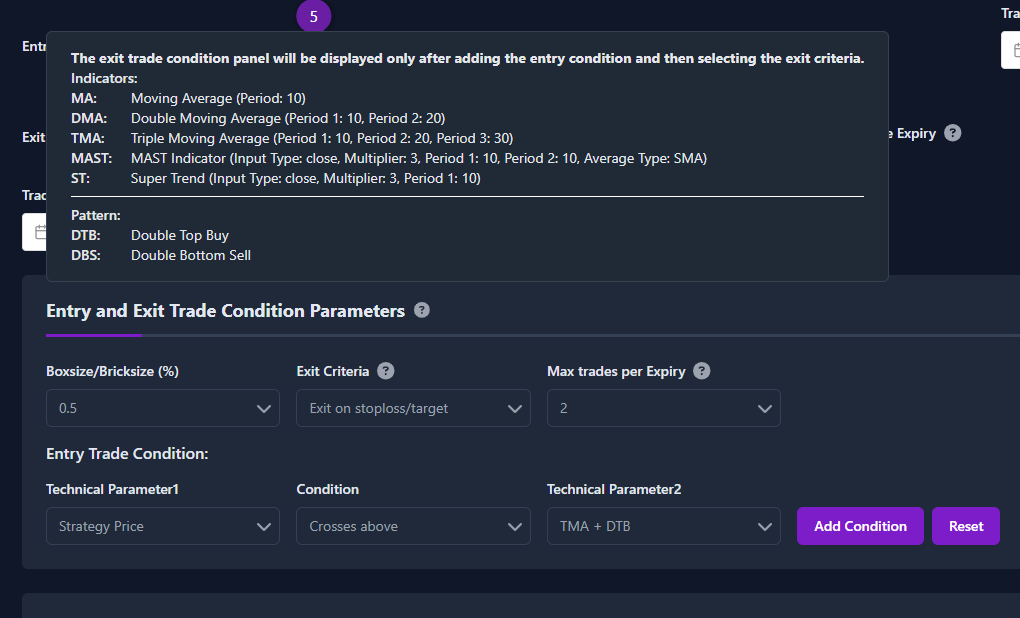
    The alignment of moving averages is not taken into account. However, when a positive crossover occurs, the moving averages naturally tend to move upward.

    Please note: Moving Averages work differently in Candle Charts and P&F Charts. For example, in a 5‑minute Candle Chart, the 10 EMA considers the last 10 candles, while in a P&F Chart with 1% boxes, the 10 EMA uses the last 10 columns.

    If you have any further queries reach us at 020-61923200, we will be happy to assist.

    Definedge

    1 Reply Last reply
    0


Recent Posts

  • DefinedgeD
    Optest Backtesting
  • DefinedgeD
    Query : Make New Indicator
  • Y
    Wrong closing price showing on P&F Chart ( R Zone )
  • N
    🚀 #VGM Stock Pick – BDL
  • M
    Momentify Investing Scanner
  • Login

  • Login or register to search.
  • Blog
  • Youtube Videos
  • Refresh
  • First post
    Last post
0
  • Recent
  • Categories
  • Unread 0
  • Popular
  • Tags
  • More
    • Guidelines
    • Disclaimer
  • Users
  • Login

  • Login or register to search.
  • Blog
  • Youtube Videos
  • Refresh