Wrong chart data on Zone (Web)
-
Hello Definedge Team,
Hope all the members are doing well.
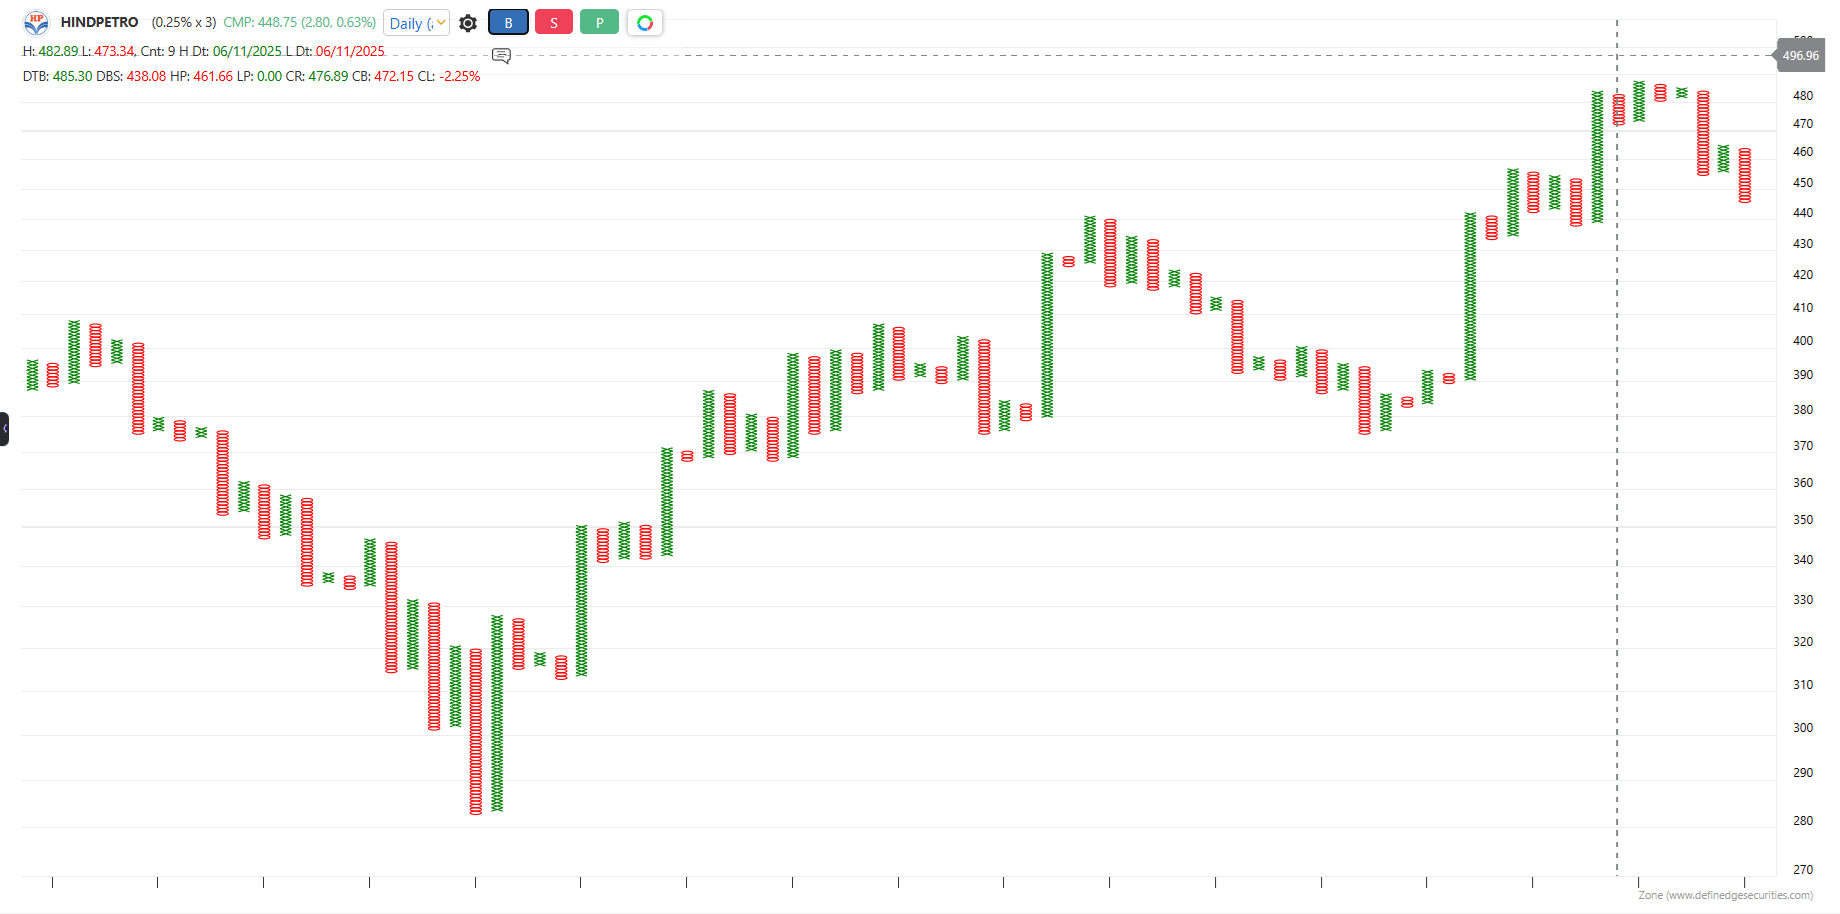
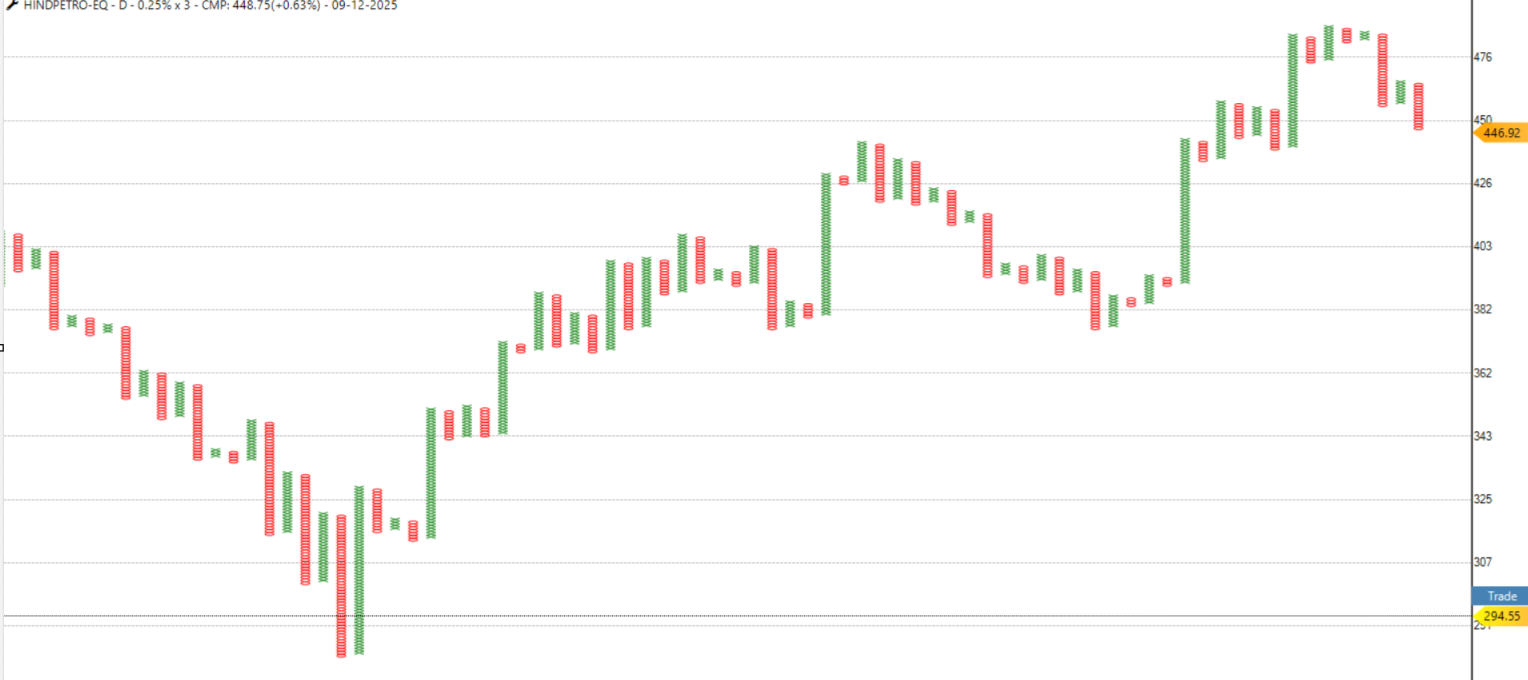
While looking at the charts, I have observed that in Rzone charts and data are not always correct, earlier also I have raised a query regarding discrepancy in Rzone data.Instrument - HindPetro, as per Zone chart, it is at all time high( CMP -446.3) closing basis, there is no resistance but same instrument on Trade point shows that there is a resistance the high is around 453.6
(you can check it on any chart type, OHLC or P&F, I am attaching a PnF for reference). Pls look into this.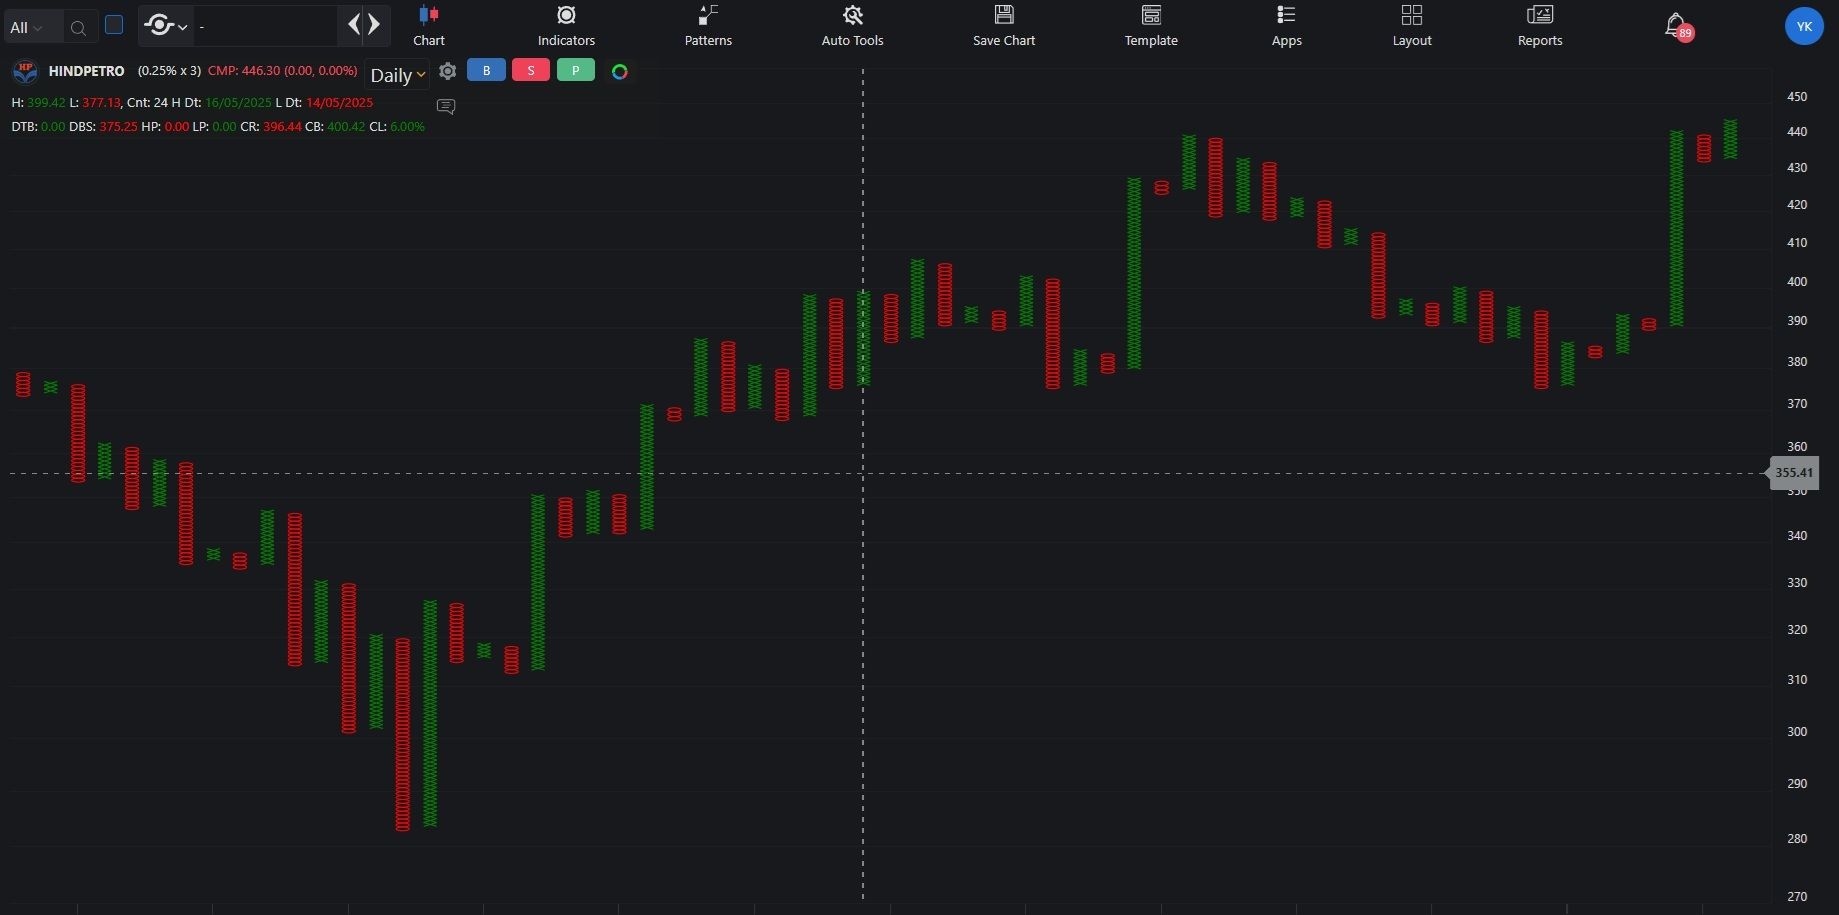
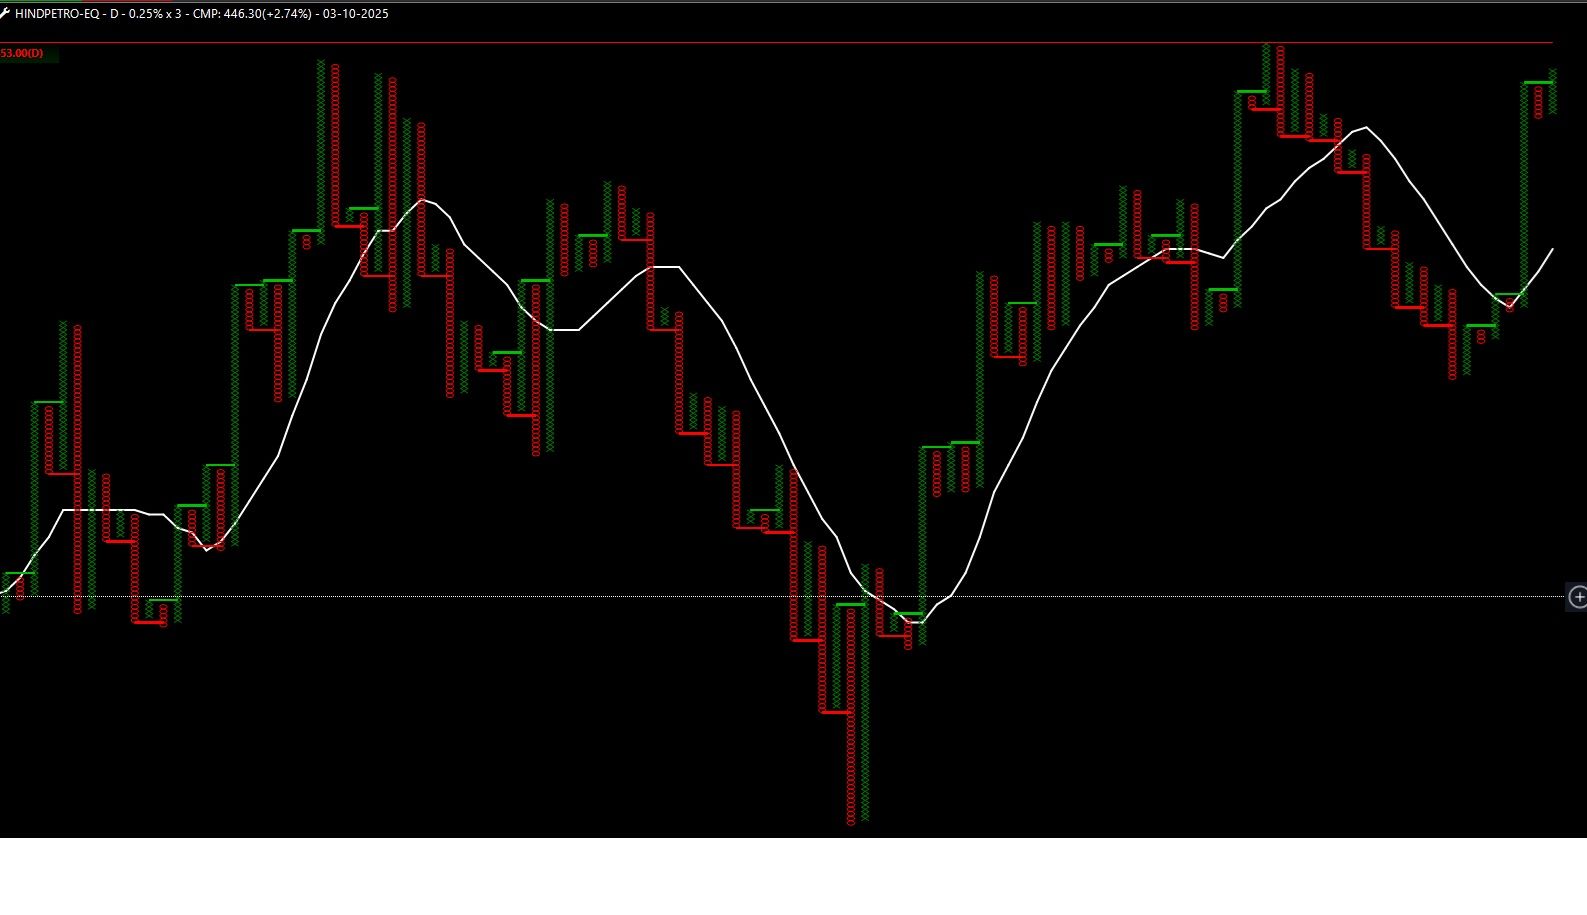
you have created a beautiful web platform (Zone) but such issues ruin the experience and we might end up taking the wrong trade if we don't recheck on other platforms and we can't do this every time. ( Trade point is showing the correct data and chart as always )
Wish you all a great weekend !
Thanks & Regards, -
@@Definedge-Experts no reply ?
-
@Definedge @@Definedge-Experts
Hello, I observed again the chart of hind petro, but the issue is still here, the chart is still wrong and its been more than2 months that I brought to your notice.
Pls understand, its not about a chart but data, that can impact our trading decision and can affect the backtesting results as well (there can be many charts, I just observed once, and hope its the only one). Hope you will do something regarding this. Tradepoint shows the correct price and chart but zone app chart n data is different, every time we can't check both apps for every chart.
@Brijesh-Bhatia sir, pls look into this.
I am attaching a screen shot for your reference again.
Thanks & Regards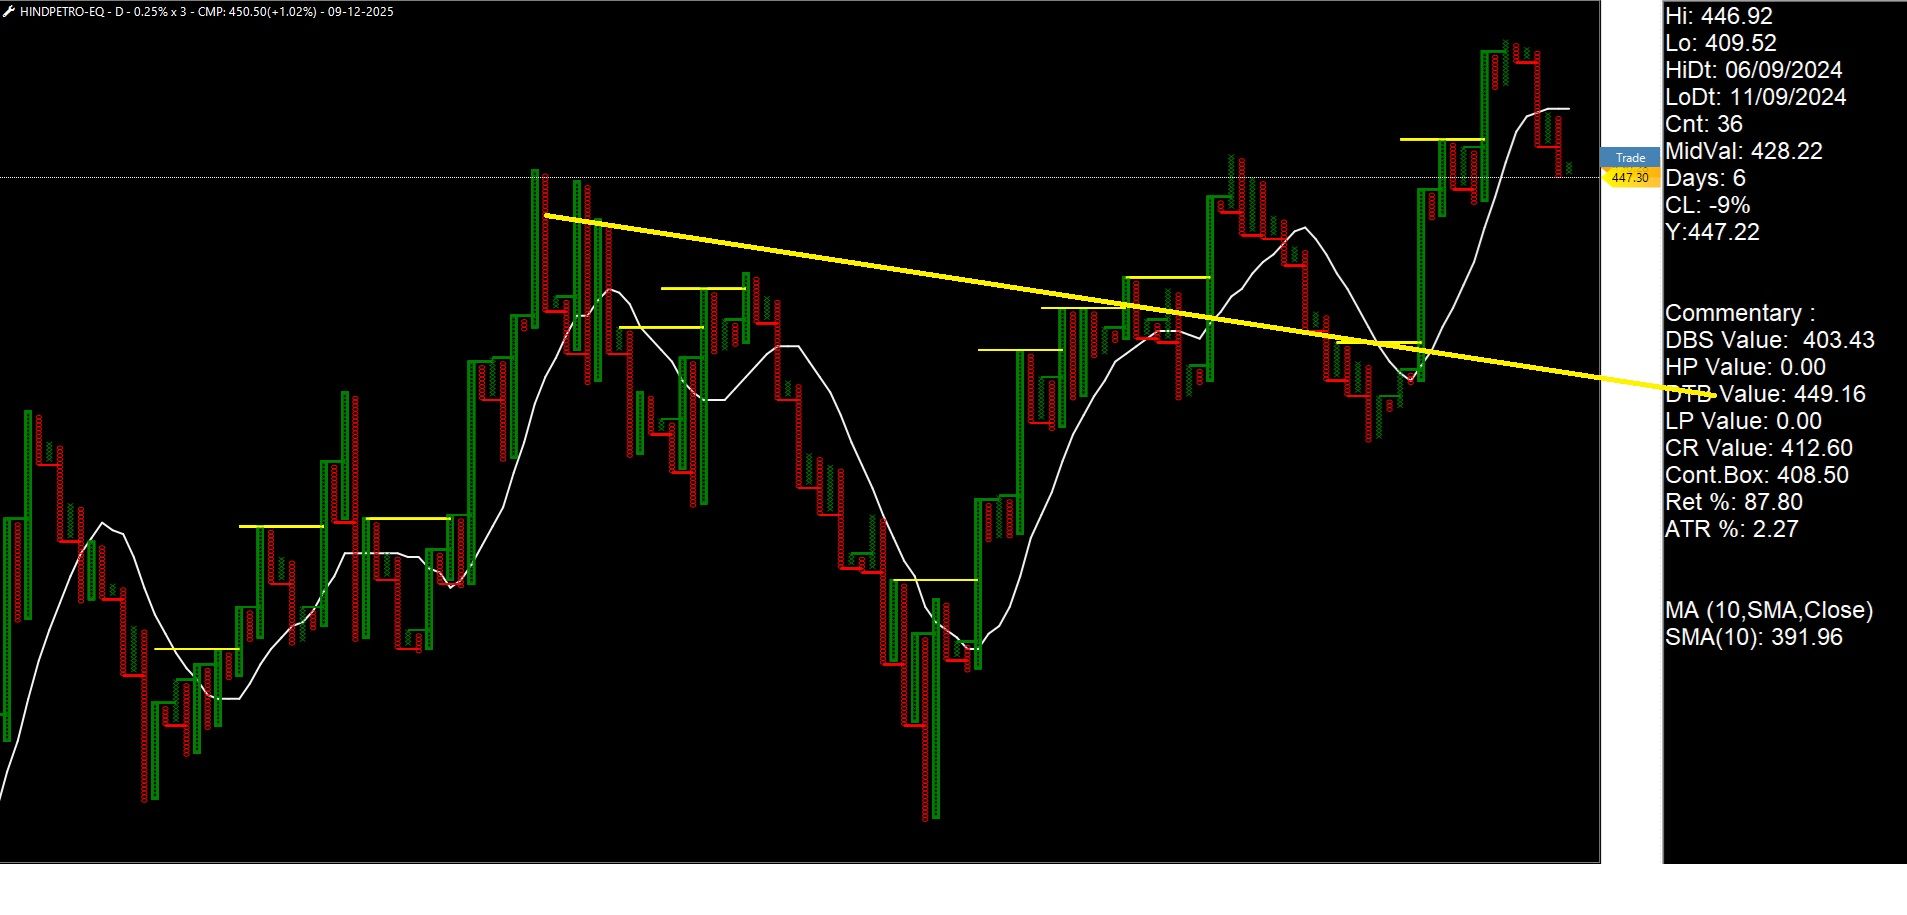
-
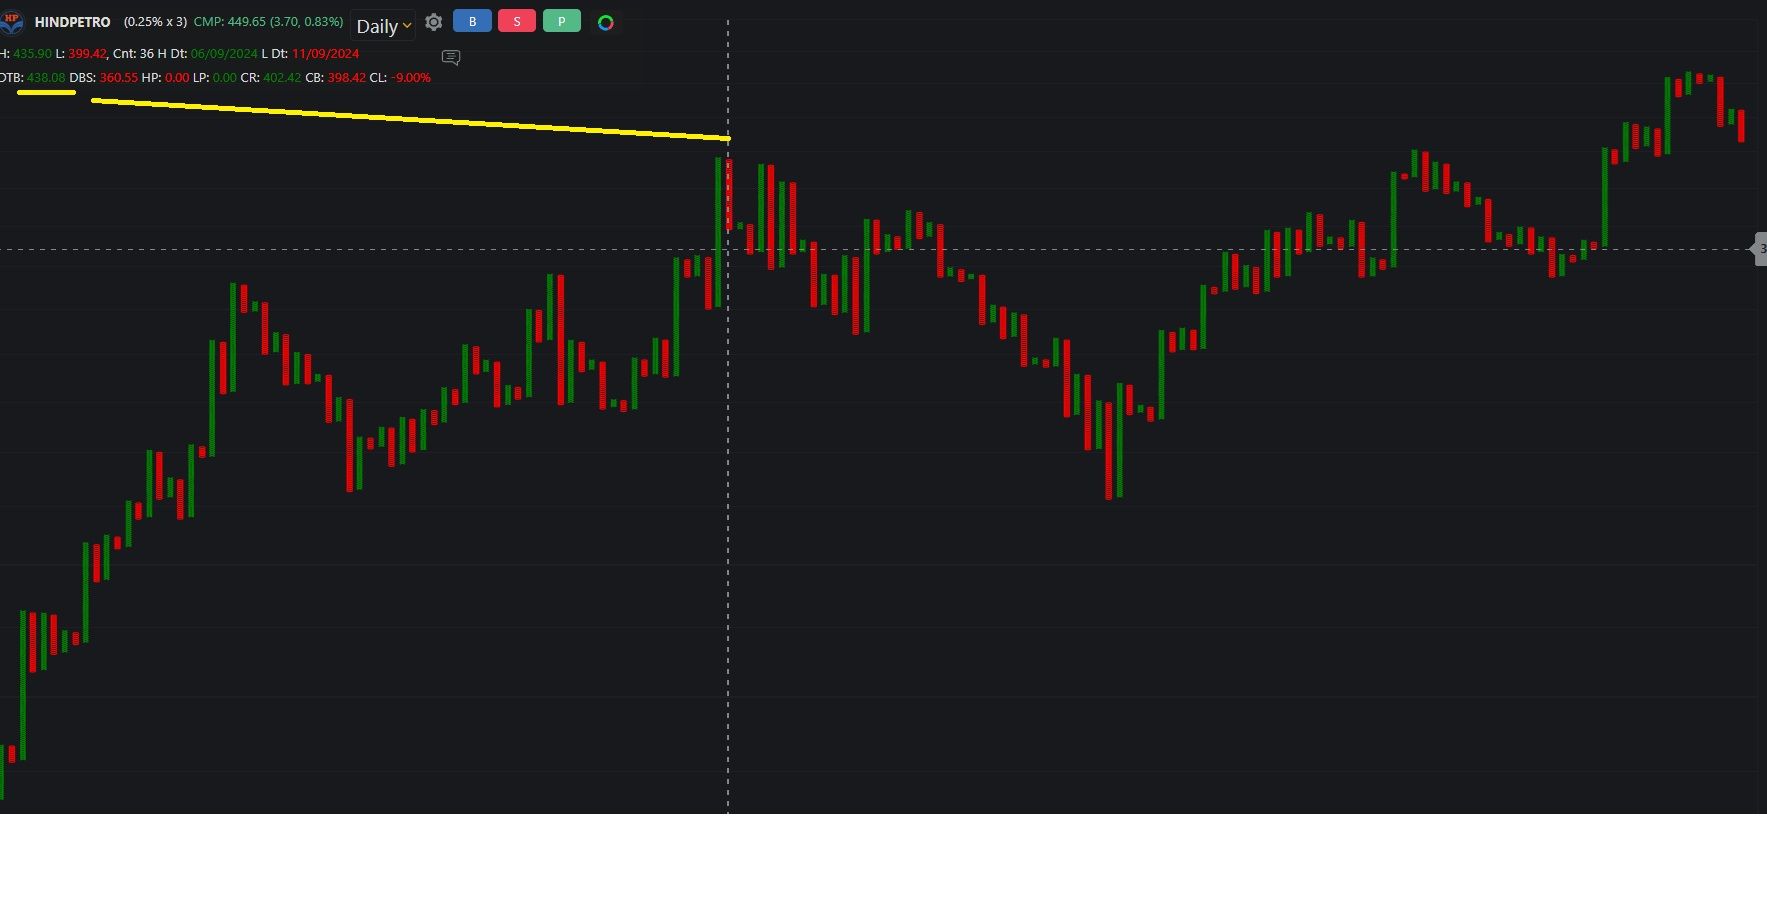
This is the chart on my screen right now
Web
Desktop
-
I see no difference. Please check at your end and share the screenshot if you still see the difference. Try repairing your desktop data. Please let me know.