Sudarshan Chemicals
-
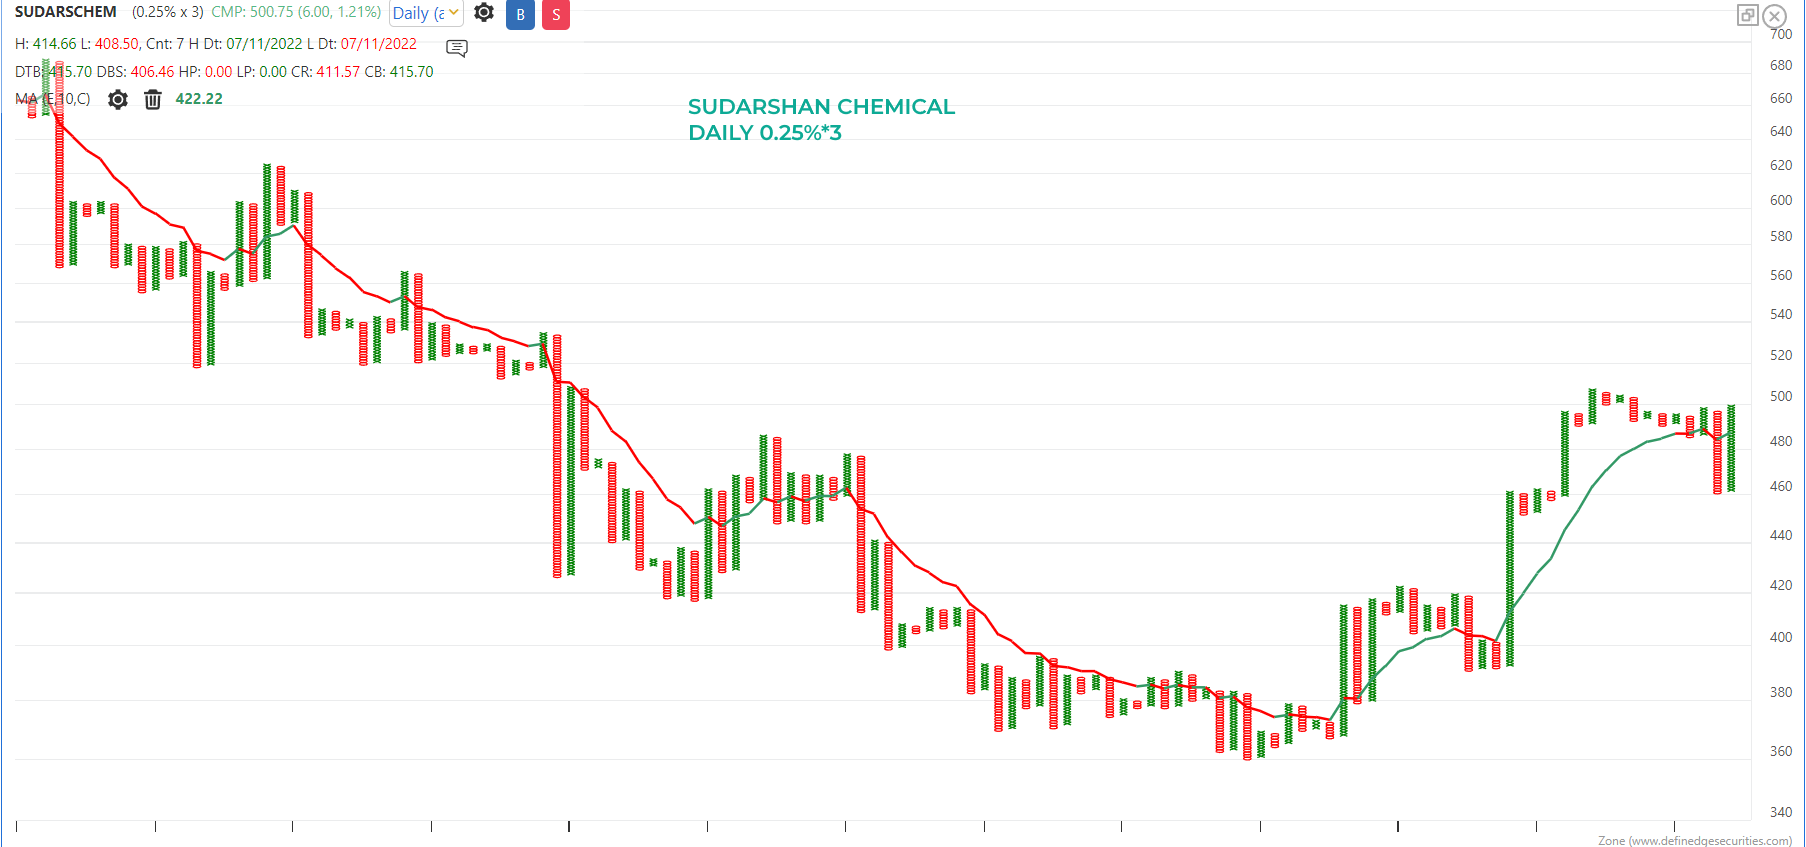
Sudarshan Chemical on Point and Figure 0.25%*3:
- We have a 100% bullish pole
- A higher mini bottom
- On 0.5%, we have a probable bullish ABC
On Renko 1% (chart below), we have a classic 123 pattern that @Krishna-Kumar Sir always talks in his weekly webinars.
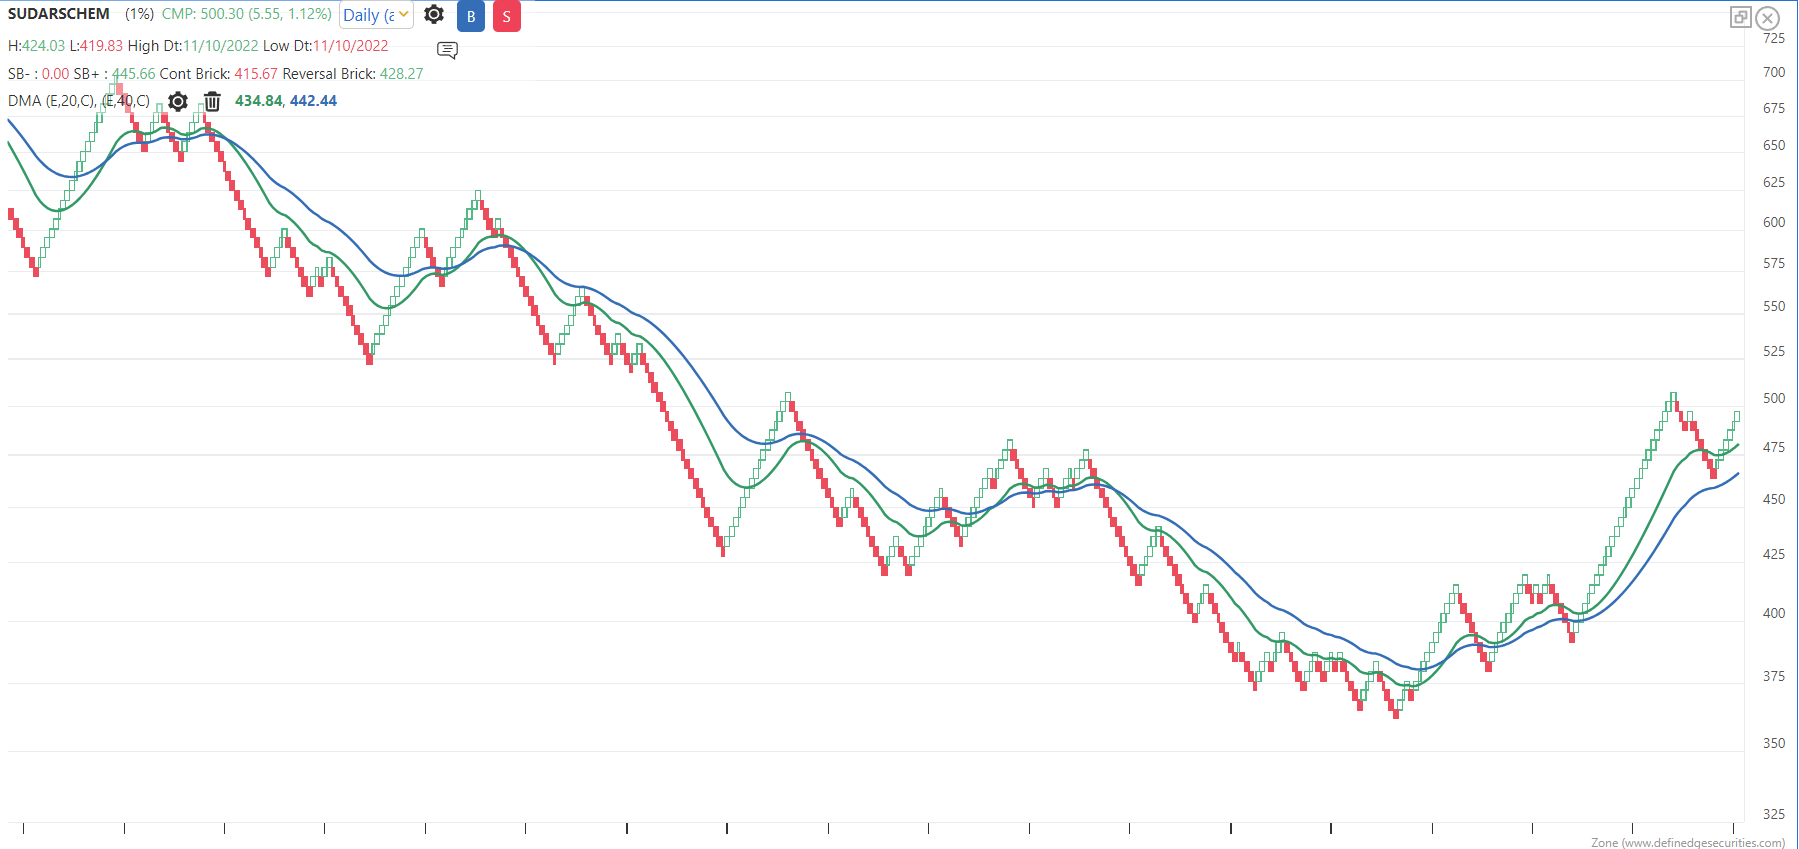
So, technically the stock is looking interesting. Let's talk a little about the fundamentals.
Sudarshan is the largest pigment manufacturer in India, with a market share of 35%. It is also the third largest pigment manufacturer in the world with an overall market share of about 3%. The products are used in various end-user industries such as decorative and automotive coatings, plastics, inks and cosmetics.
Triggers going forward:
Huge capex: The company recently concluded a huge capex (I guess this is the biggest capex in its history). They invested some Rs.750 crores in the last three years to transform its product portfolio. All the capex projects are now commissioned. We can expect optimum utilization in 3-4 years. Bulk of this capacity was for specialty products and some for backward integration - which means the overall margin profile of the business should improve going forward.
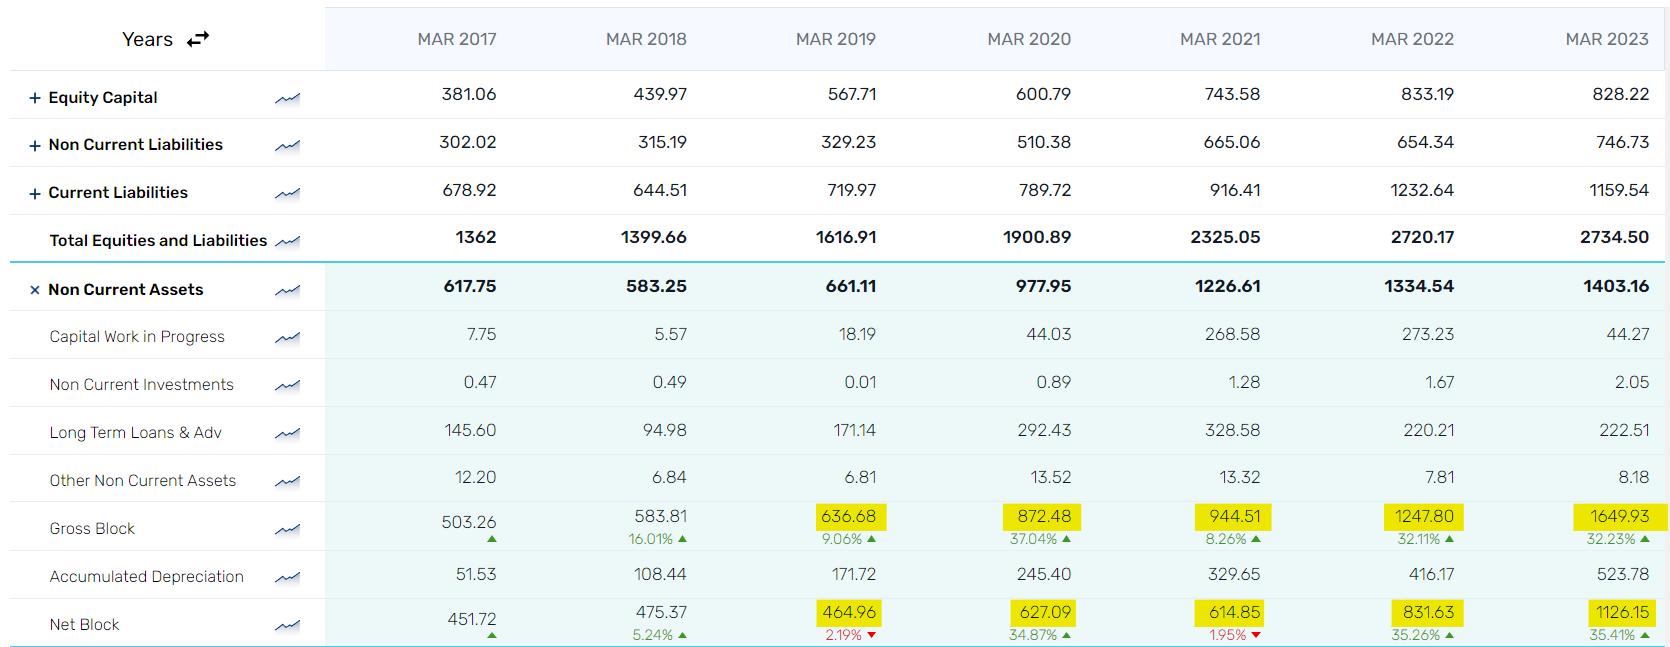
Notice the net block figure in the above image. Fixed asset more than doubled (2.4x) in last 4 years! Now imagine a scenario when this capacity gets fully utilized. No reward for guessing that there will be a sharp jump in topline and margins this happens.
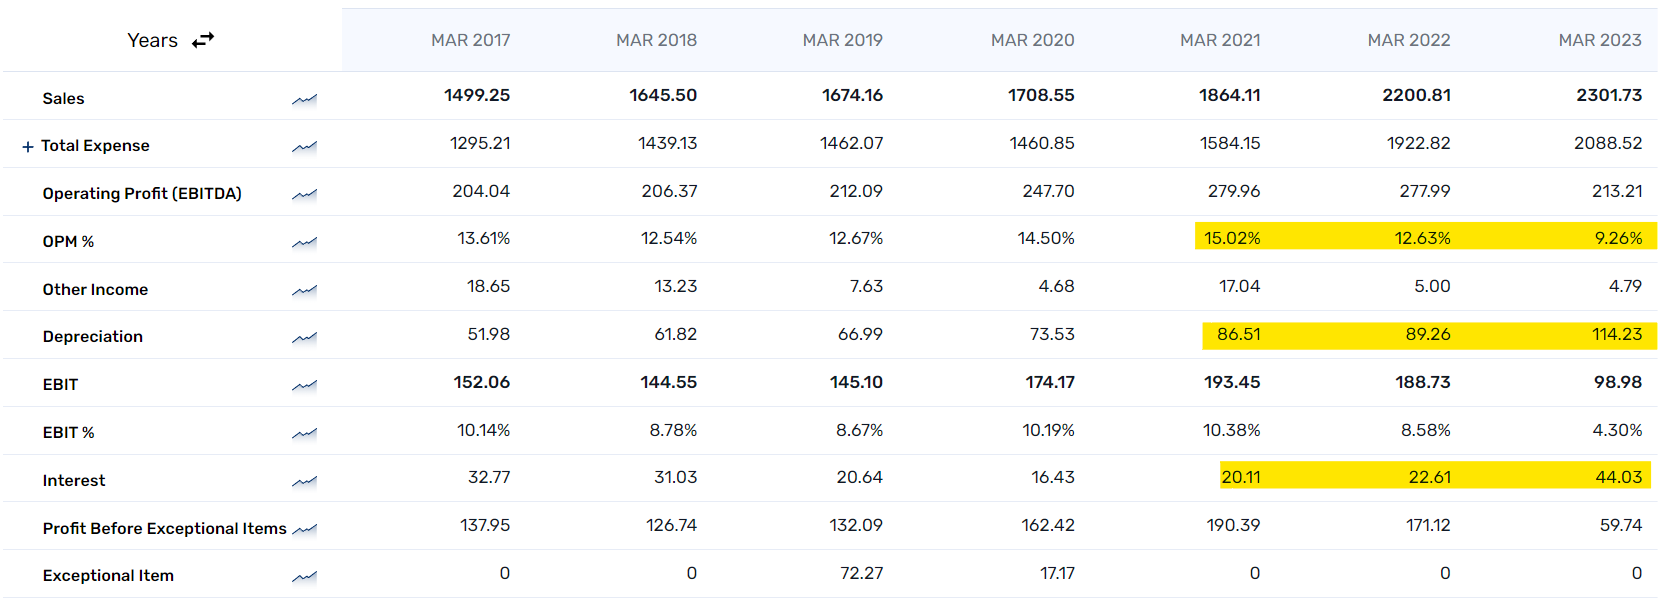
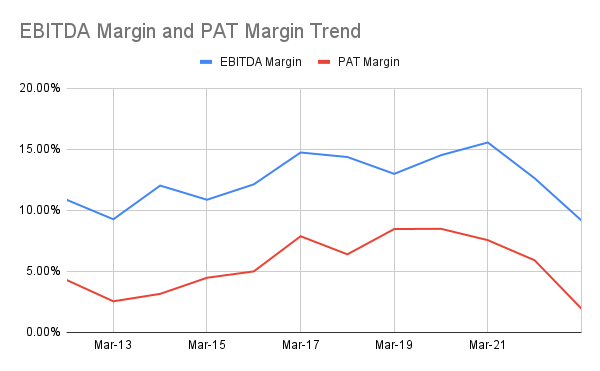
There is one more thing - the company started capex at the wrong time and by wrong time I mean at the peak of the cycle. As a result the company faced double impact on account of poor operating environment and high depreciation/interest outgo. Refer the image below. Notice the decline in OPM from FY21 (which was because of high input costs and increased expenses like logistic costs, crude price etc) and a consistent rise in depreciation and interest expense which was because of the capex. So, the company already paid the price in the last few quarters and now it is time to reap the benefit.
Due to lack of historical data on Radar, I am not able to show how bad the numbers were in FY23. But if you can spend some time collating data, you would find that this never happened in the company's history - well, actually it happened once in FY13 when the company was facing similar issues. But things resolved in FY14 and onwards.
Okay, moving ahead, with the recently concluded capex, the company launched several products, particularly in the niche specialty division. Technicality part/stability is done now. They are now waiting for customer approval and ramp up. Product approval timeline is 3 months to 6 months. As per the management, the initial ramp up in geographies like Europe might be slow due to weak environment but I think that would get compensated with the domestic market.
Margin Expansion: I always prefer company where there is a possibility of margin expansion because that results in profit growing even faster than the sales. Pick any multibagger stock and there is a high possibility that the company's sales and margin both grew over the years.
Talking about Sudarshan, there is a possibility of margin expansion. Why?
First because of mean reversion. Let me show -
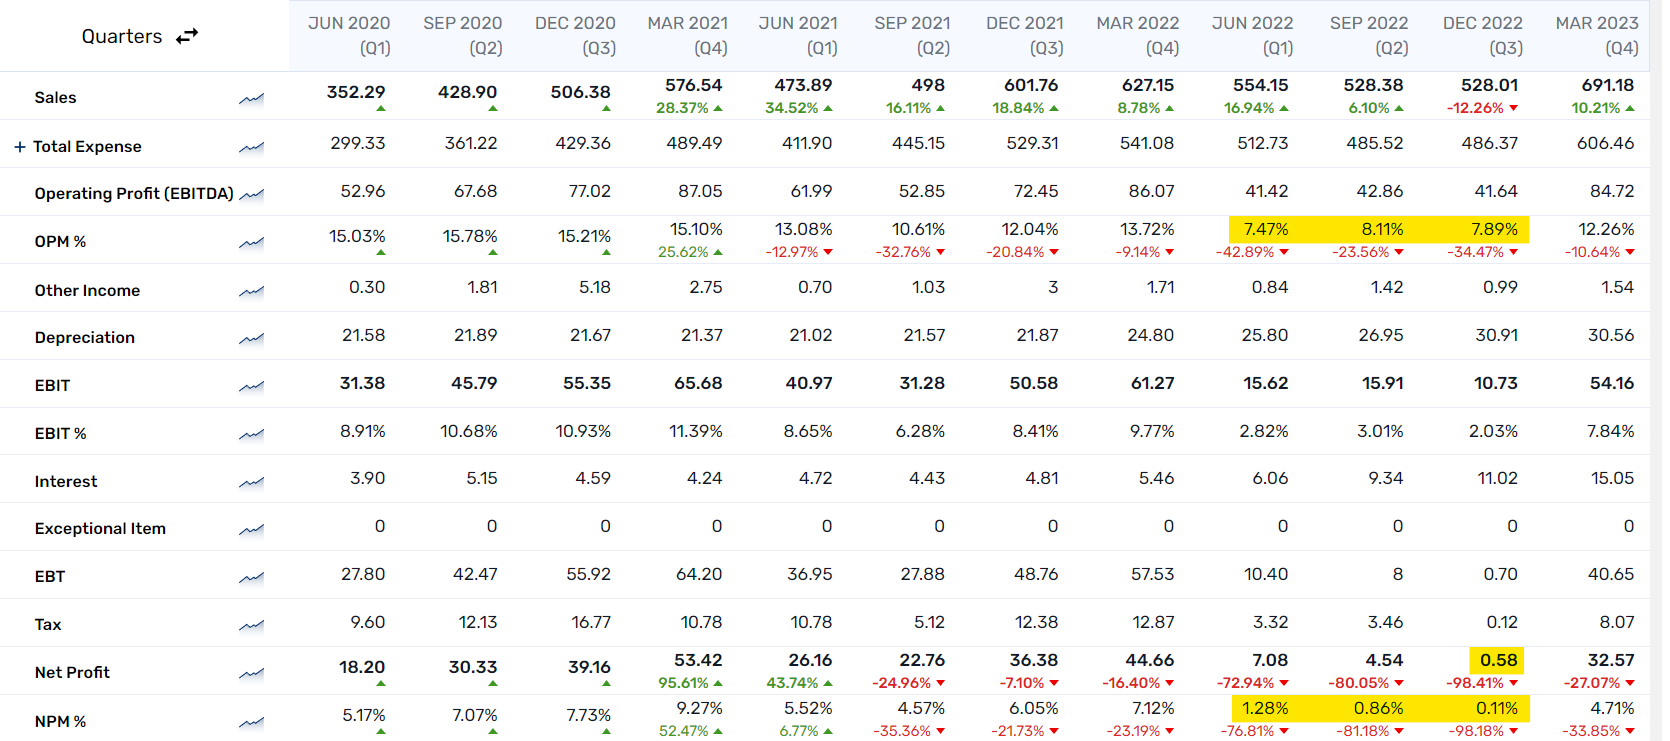
First look at the historical OPM%. At peak the margin used to remain around 15% and then it tapered down to 12-13% and finally it came down to ~8% in June/Sep/Dec quarter.
The condition of PAT margin was even worse and it dipped to 0.11% in December 2022 quarter! This is just not sustainable. Outliers on either direction is not sustainable and mean reversion has to happen. We see this on charts and the same happens in business world as well.
Well, mean reversion was bound to happen and it started in March 2023 quarter when PAT margin increased to 4.71% (best in last 4 quarters). Let me tell you this is not the end. The margin can further expand from here on. Read along.
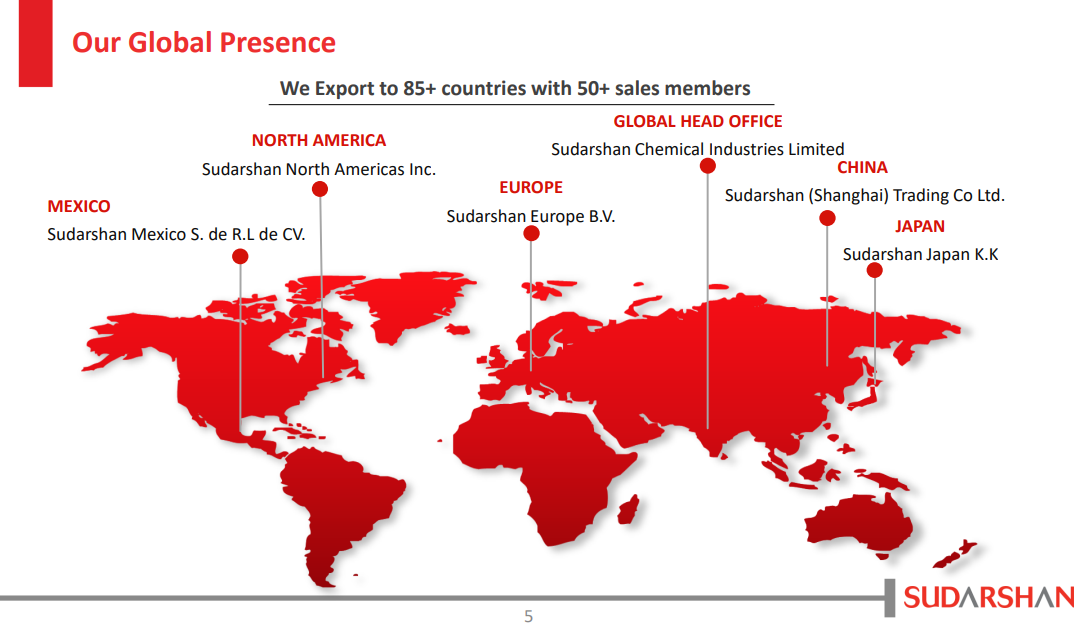
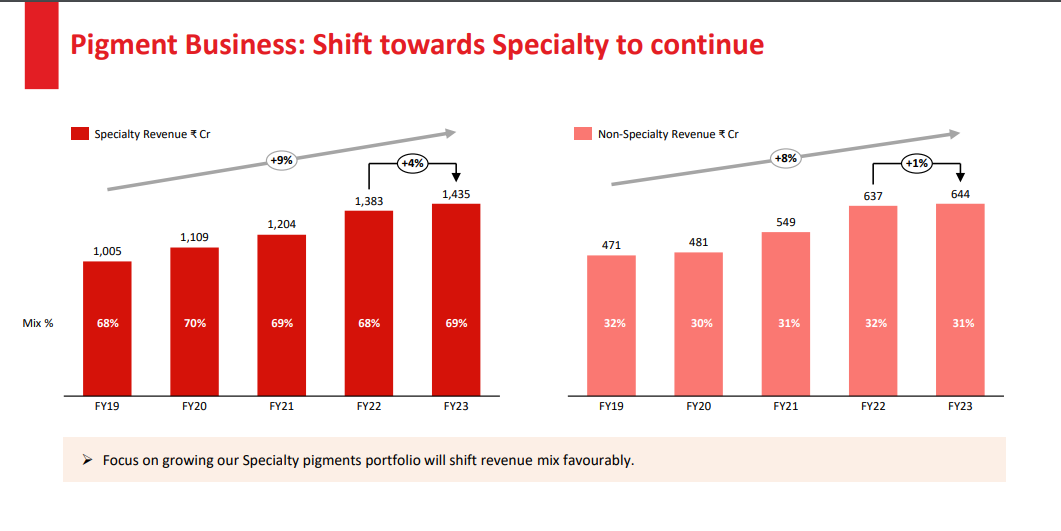
Focus on growing Specialty pigments portfolio will have a positive impact on the margins. Refer the slide below -
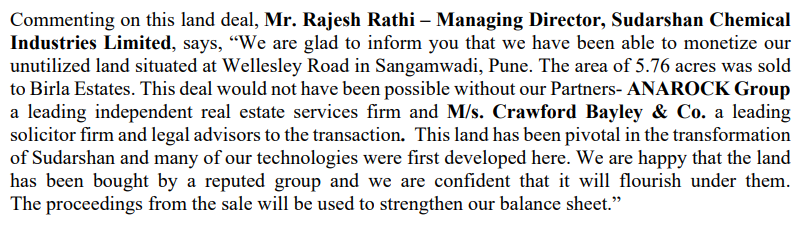
Another trigger for margin expansion is debt reduction. The company sold its land parcel in Pune. This transaction fetched Rs.356 crores which will be used to strengthen the balancesheet -
The last two triggers for margin expansion are - (a) positive operating leverage and (b) softening raw material cost, declining logistics cost.
Valuation: Right now the stock is trading at a TTM PE of 77 which looks optically high because of suppressed earnings in the earlier quarters. I am deliberately not sharing the expected numbers and target, I leave it to you to work this out.
Risks:
- Slower offtake for new products/capacity utilization not increasing at the desired pace
- Increase in input prices.
Disclaimer: I am holding the stock from lower levels and I am biased.
-
Great Analysis! Thank you for sharing, even I am tracking the company. Very interesting times going forward
One more exciting find is that an Ace investor - Akash Bhanshali has been increasing his stakes in the company for over a year now
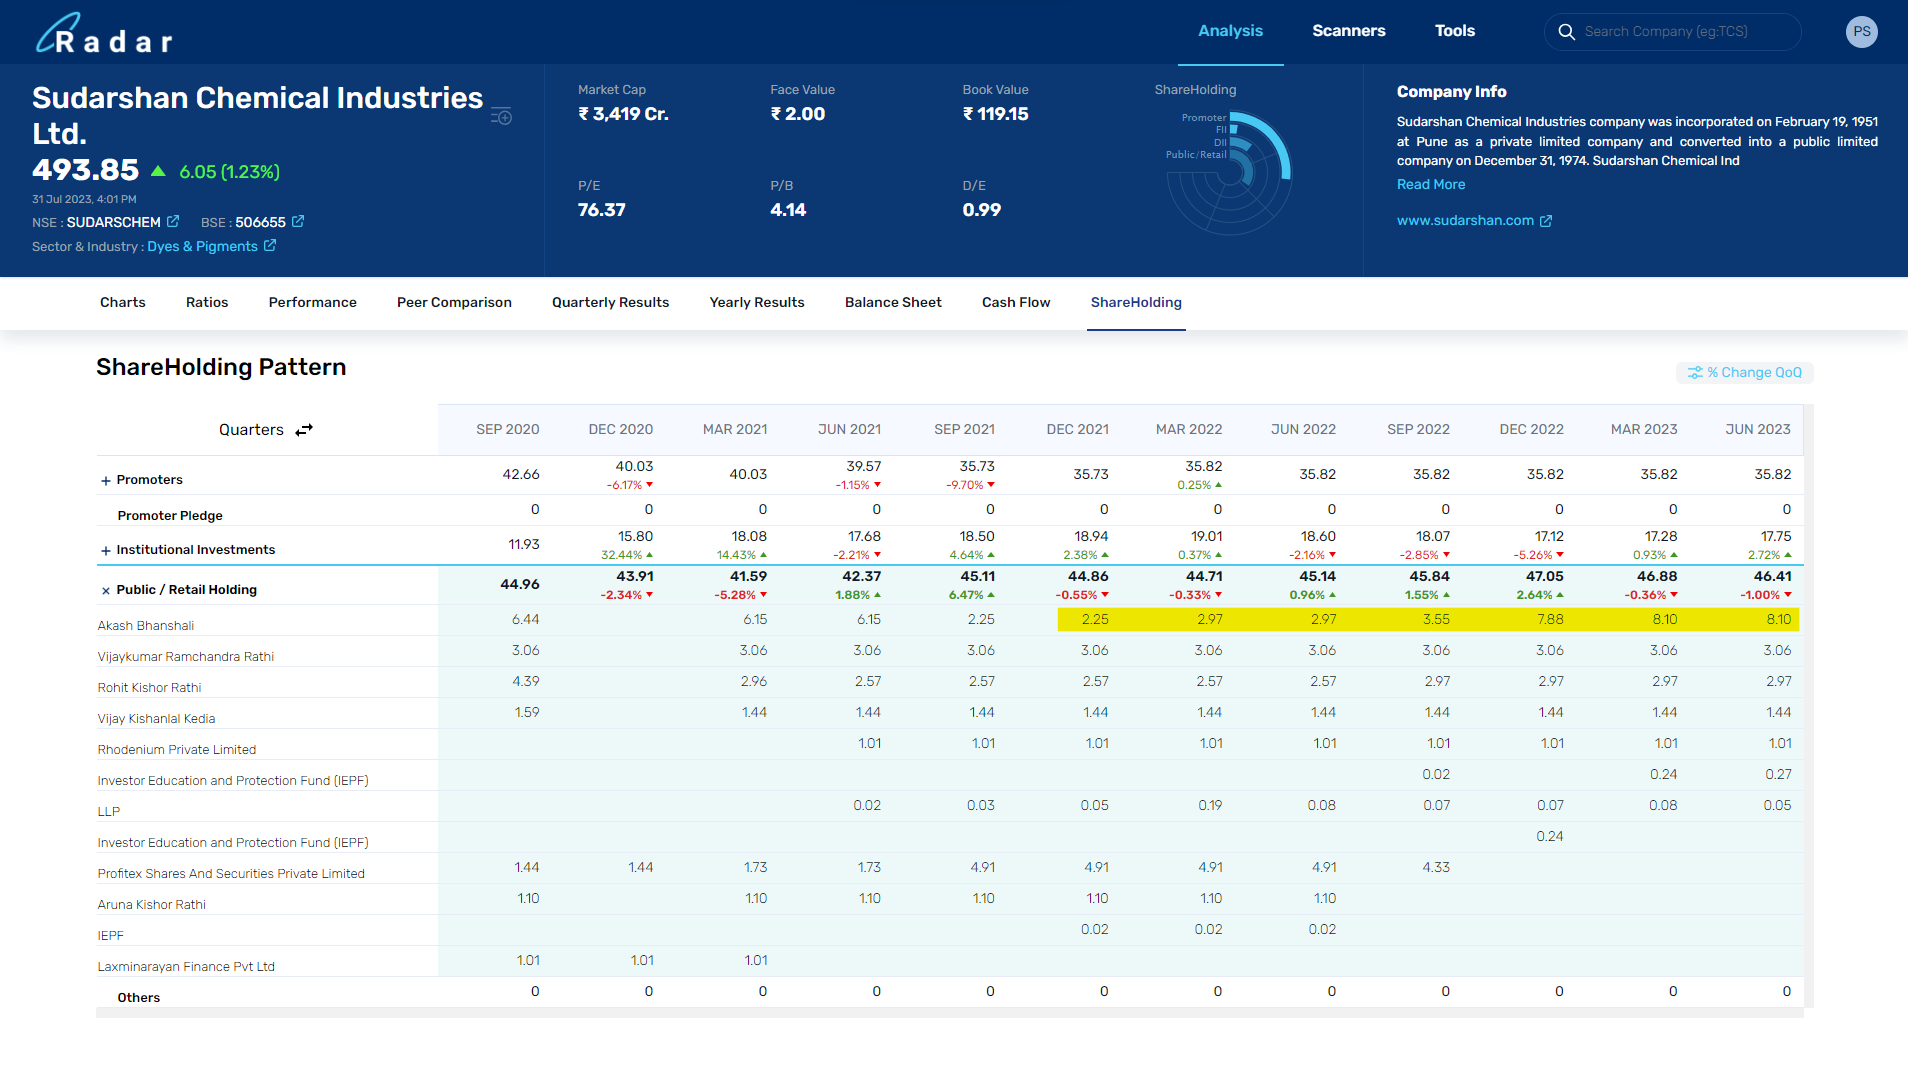
@Ab said in Sudarshan Chemicals:
I am not able to show how bad the numbers were in FY23
I think you meant FY13 numbers, currently, we are providing Financials data from 2017 onwards
-
@Prasiddh Shroff said in Sudarshan Chemicals:
I think you meant FY13 numbers, currently, we are providing Financials data from 2017 onwards
No no. I meant if we had the data from last 15-20 years then we could see how bad the numbers were in FY23 (when compared with the past).
On that note, here is the EBITDA margin and PAT margin trend since FY12. As we can see, we are at the decadal low.
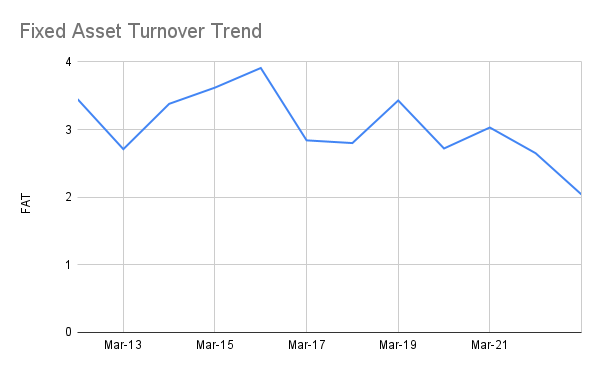
Same story with asset turnover - dipped because of huge capex. Even if we mean revert, then there is scope on the topline and margin front.
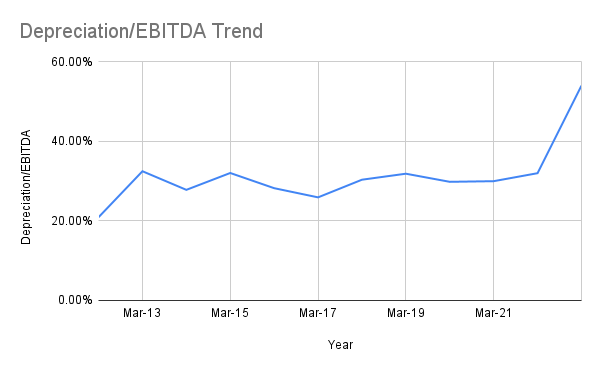
There are few metrics that I like to track in cyclical companies that are into manufacturing.
One is Depreciation to EBITDA ratio. As we can see here, a large part of EBITDA is eaten by depreciation and the ratio is at the historically highest level.
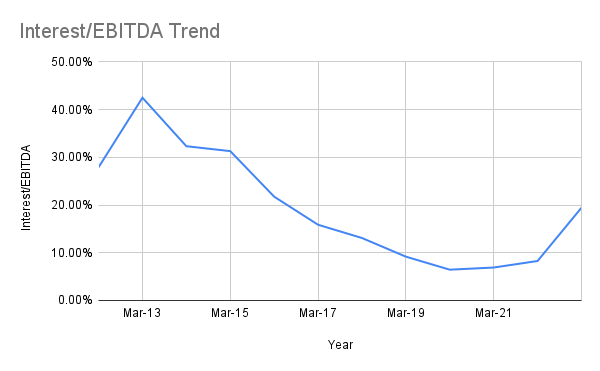
The other one is Interest to EBITDA. Here we are comfortably at a lower level. This basically tells us that despite a optically high debt to equity, the company can comfortably service it and is generating enough operating profit. This is remarkable considering that they have done a huge capex. Note that, we were never this comfortable even during FY12-FY13 period.
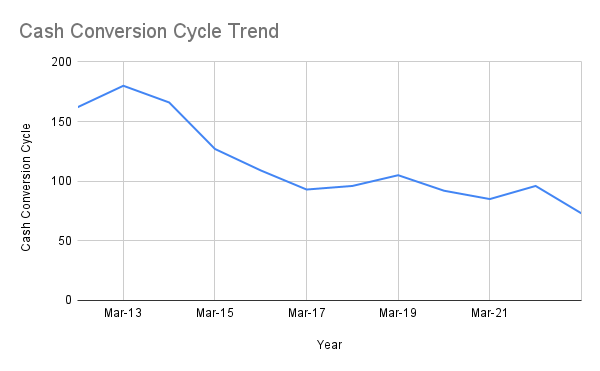
This brings to the last graph which is cash conversion cycle trend. Best in the last 12 years despite poor performance in the last few quarters. Tells a lot about the operational efficiency and execution capability of the management.
-
Thanks for the detailed analysis!
-
This was so very well-timed! @Ab