Market Breadth with Nifty50 P/B ratio (Undervaluation & Overvaluation)
-
I researched on Nifty50 P/B ratio and its relevance to Nifty50 prices, the co-relation is 80% accurate which means this can be helpful if you add in the Rzone Marketbreadth with P/B option. I have researched on it, more work can be done. Requesting the researchers to study this further.
Using P/B for Directional Calls
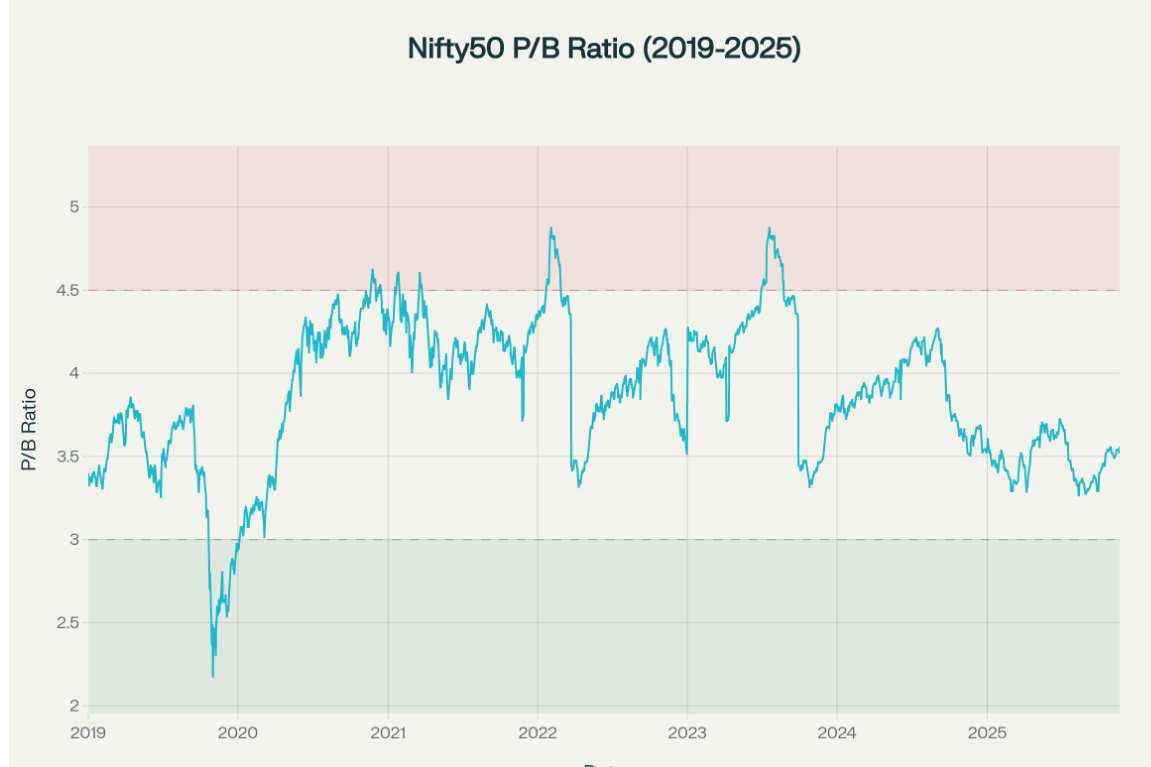
- When the P/B ratio is substantially above historical averages (e.g., > 4.5, the market tends to face mean-reversion headwinds. This often signals caution for new investments or may
suggest defensive positioning as correction risk builds. - Conversely, when the P/B drops below historical norms <3.0, it has signaled significant undervaluation, often coinciding with periods of strong forward returns after the panic phase
passes. Sustained movement in the upper quartile of the range suggests either extreme optimism or a new paradigm, so monitoring for sentiment shifts and macro inflections becomes crucial. - Thus, tracking the Nifty50 P/B ratio gives a quantitative signal for identifying market extremes and anticipating broad directional shifts—low P/B for bullish recovery setups, high P/B for defensive or cautionary tactical stance.
- When the P/B ratio is substantially above historical averages (e.g., > 4.5, the market tends to face mean-reversion headwinds. This often signals caution for new investments or may