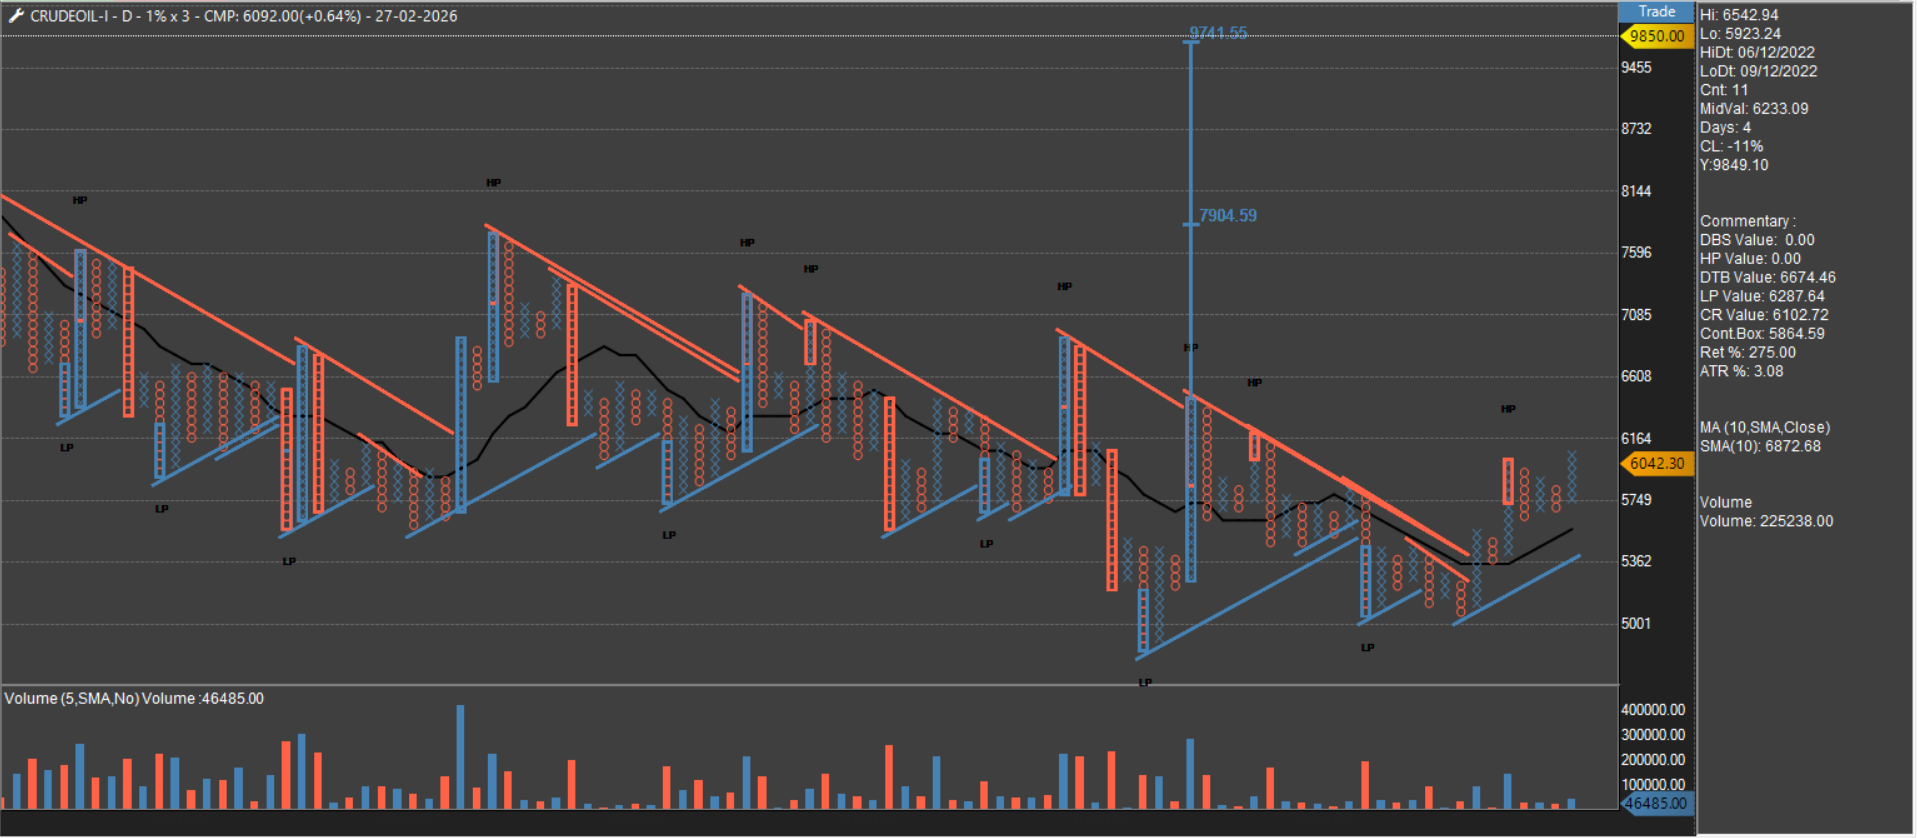
Crude Oil P&F Chart Observation
-
Technical charts often provide early indications of potential future price movements. The current Point & Figure (P&F) chart of Crude Oil, plotted in 1% box size, appeared to suggest a possible upward price movement. This chart shows formation of an Anchor Column followed by a period of consolidation, which may indicate the build-up of bullish momentum.