• Recent
  • Categories
  • 0 Unread 0
  • Popular
  • Tags
  • More
    • Guidelines
    • Disclaimer
  • Users
Skins
  • Light
  • Default
  • Cerulean
  • Cosmo
  • Flatly
  • Journal
  • Litera
  • Lumen
  • Lux
  • Materia
  • Minty
  • Morph
  • Pulse
  • Quartz
  • Sandstone
  • Simplex
  • Sketchy
  • Spacelab
  • United
  • Yeti
  • Zephyr
  • Dark
  • Cyborg
  • Darkly
  • Slate
  • Solar
  • Superhero
  • Vapor
Collapse
Definedge Forum Logo

Drawing trendline and support resistance lines on indicators

Scheduled Pinned Locked Moved Suggestions & Feedback
1 Posts 1 Posters 14 Views
    • Oldest to Newest
    • Newest to Oldest
    • Most Votes
Reply
  • Reply as topic
Log in to reply
This topic has been deleted. Only users with topic management privileges can see it.
  • R Offline
    R Offline
    Rajesh Khadkikar

    Pro User

    wrote on last edited by
    #1

    I noticed that drawing trendlines and SR lines on indicators like RSI can significantly improve buy/sell decisions. Can you please Enable 'Trendline' and 'Horizontal Line' tools within indicator panes.
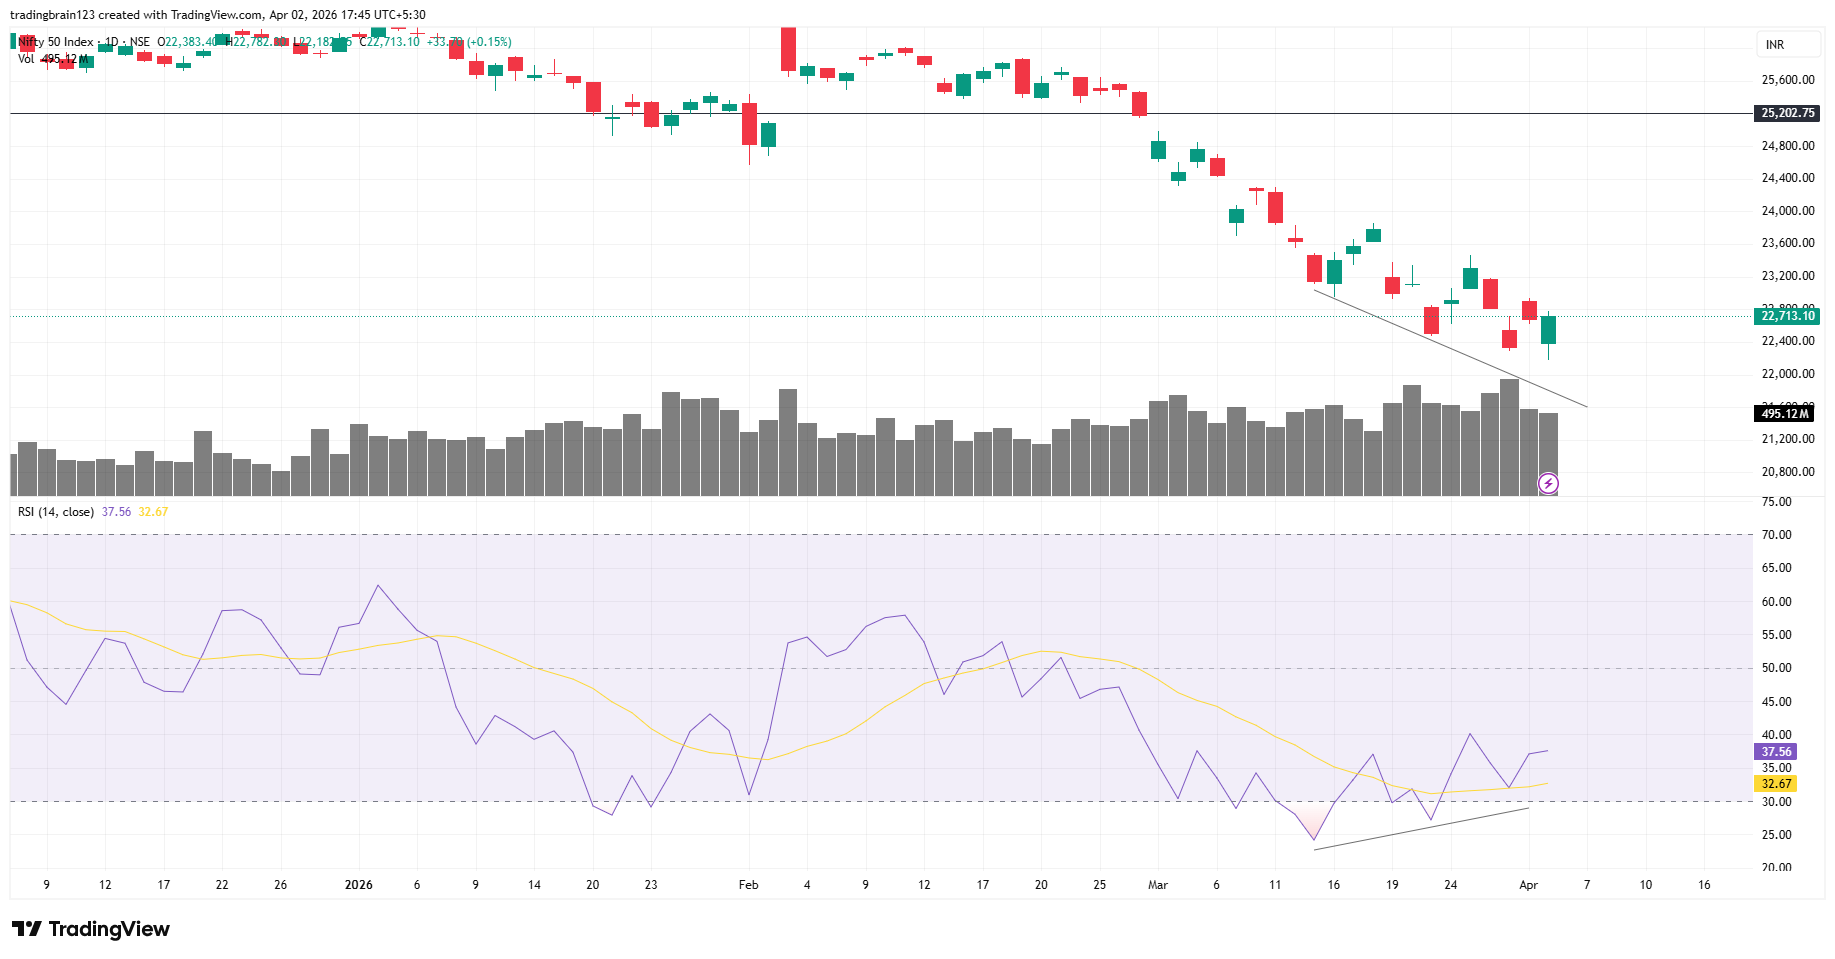
    f10775ba-0469-48a6-91cc-01844d3ebd3c-image.png

    just like this.

    1 Reply Last reply
    0


Recent Posts

  • R
    Drawing trendline and support resistance lines on indicators
  • A
    Nifty: A Perfect Storm - Bullish Harmonic Completion + RSI @ 2020 Levels
  • B
    Momentify Feature
  • B
    Multiple days selection option
  • PrasiddhShroffP
    Mobile app - no data to show
  • Login

  • Login or register to search.
  • Blog
  • Youtube Videos
  • Refresh
  • First post
    Last post
0
  • Recent
  • Categories
  • Unread 0
  • Popular
  • Tags
  • More
    • Guidelines
    • Disclaimer
  • Users
  • Login

  • Login or register to search.
  • Blog
  • Youtube Videos
  • Refresh