MIDSMALL vs Nifty 100 – What the Ratio Chart is Saying- “Tiger abhi zinda hai”
-
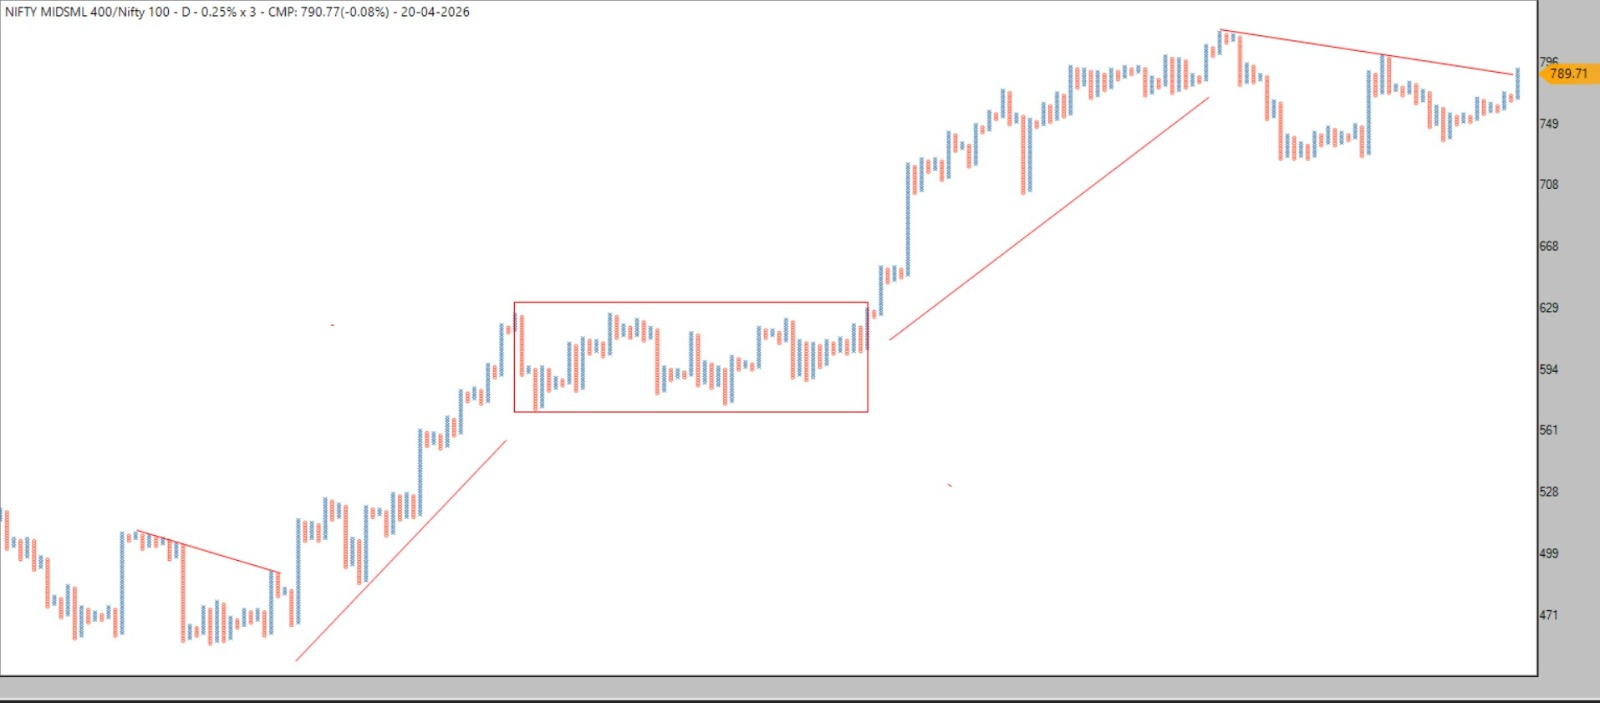
MIDSMALL vs Nifty 100 – What the Ratio Chart is Saying
Before COVID, MID & SMALL caps were clearly underperforming.
Then came the breakout — and what followed was a massive phase of outperformance. Post that rally, markets cooled off into a 2-year consolidation (sideways phase) — a necessary pause.
 2023–2024 again belonged to MIDSMALL.
And now?
We are approaching a breakout from a falling trendline. ️ Interestingly,
Most analysts, fund managers & investors are currently tilted towards Large Caps.
But Relative Strength (RS) tells a different story… “Tiger abhi zinda hai” – MIDSMALL is not done yet.
 Our Positioning:
We are already well capitalized through our ETF allocation:
 ️ ALPHA
️ MOMENTUM50
️ MIDSMALL
️ MID150BEES Message
Don’t follow consensus blindly.
Follow structure + relative strength + positioning. Markets reward those who stay ahead of the narrative, not those who react late.Nishesh Jani,CFTe
#Midcap #Smallcap #RelativeStrength #StockMarketIndia #ETFInvesting #MomentumInvesting #PortfolioStrategy #MarketOutlook #Nifty #WealthCreation #nisheshjani