NLC India Testing Major Resistance Again - Breakout or Another Bull Trap?
-
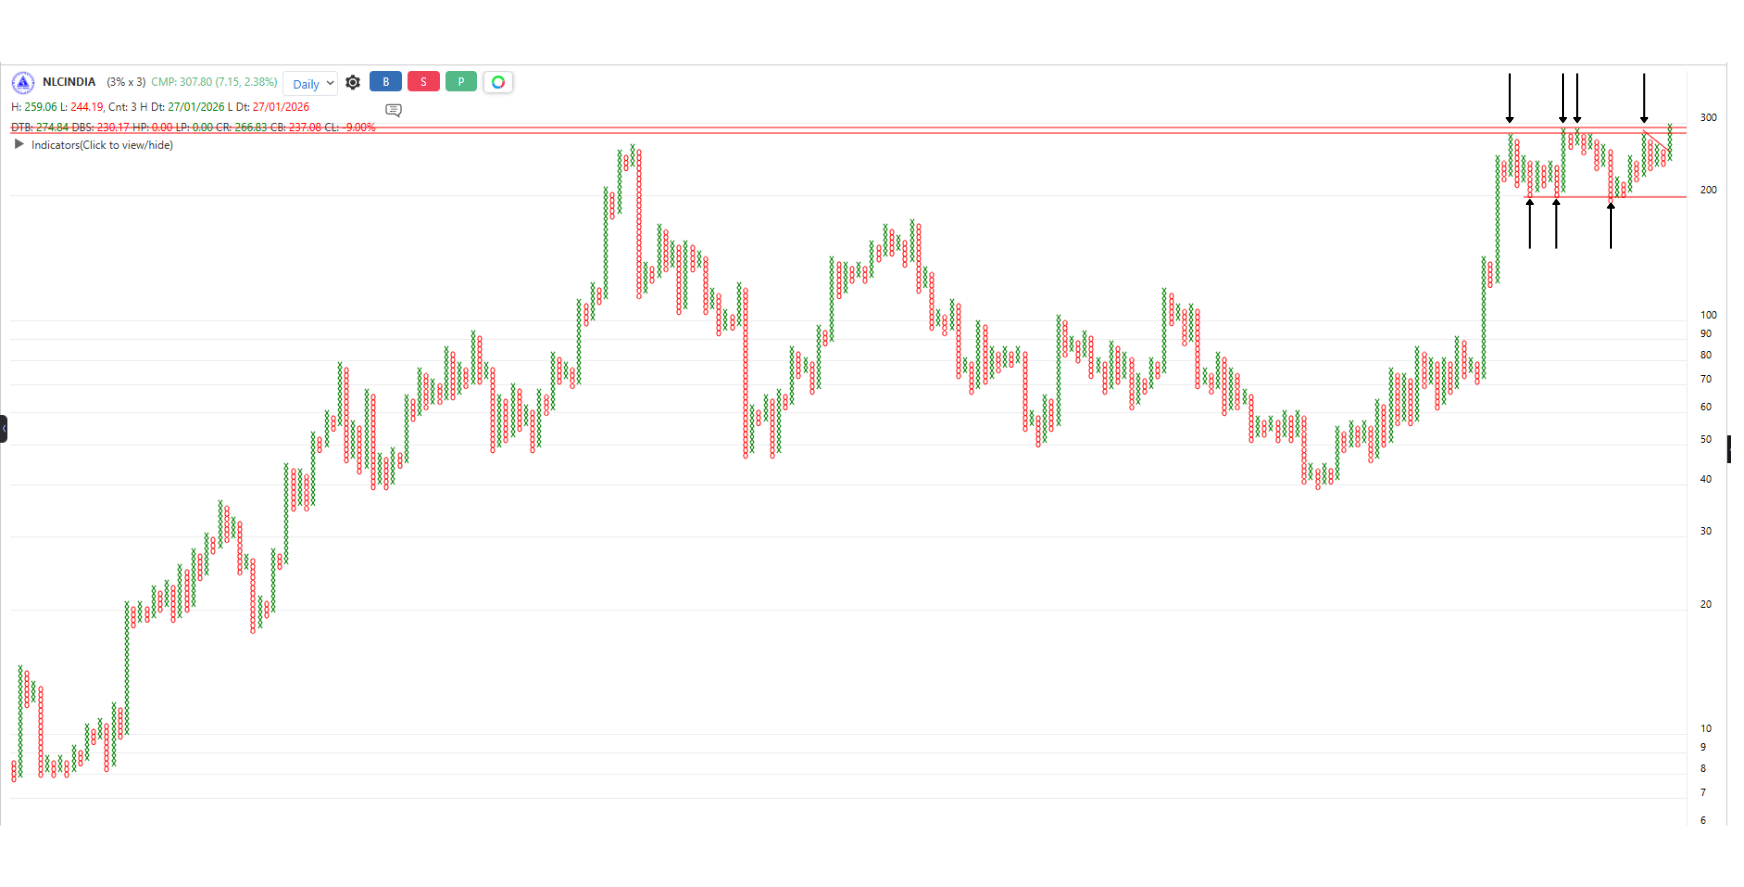
Been tracking NLC India for a while now, and one thing stands out clearly the stock is facing a strong resistance zone around its 2008 levels. Since 2024, it has tested this area multiple times but hasn’t been able to sustain above it.
As we know, when a stock keeps hitting the same level again and again, it can mean two things either the resistance is getting weaker, or strong supply is still sitting there.
This time, the structure looks a bit interesting. The stock is trying once again to move above this zone, and there seems to be a decent base formation, Also noticing an OOPS pattern forming during this base.
If the stock manages to sustain above these 2008 levels with strength, it could open up a fresh move on the upside. But if it fails again, it might turn into another bull trap like we’ve seen before.
Just sharing an observation from the charts for discussion and learning purposes. Would like to hear others’ views.!
 MIDSMALL vs Nifty 100 – What the Ratio Chart is Saying- “Tiger abhi zinda hai”